
• Exporting and Importing Report Templates
• Exporting Reports to a .CSV File or to Excel
• About Financial Statement Designer
Up to this point in the book I have discussed ways to review your data. Throughout each chapter I often included step-by-step instructions for creating specific reports to assist you with your data review. This chapter instead discusses ways you can make reporting work for you using many of the reporting tools found in QuickBooks.
If you are new to QuickBooks or if you have never reviewed the QuickBooks Report Center, in this section you can find out about the many features available for simplifying your reporting needs in QuickBooks.
The Report Center is available in the following editions of QuickBooks: Pro, Premier (all editions), and Enterprise (all editions).
To access the Report Center follow these steps:
1. Click the Report Center icon from the QuickBooks icon bar or click Reports, Report Center. The Report Center appears, as shown in Figure 16.1. (The image shown in Figure 16.1 might differ from your selection of reports depending on the QuickBooks version you are using.)
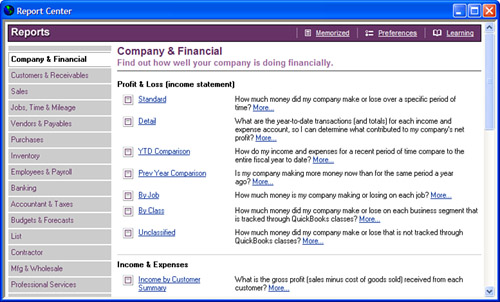
2. On the left of the Report Center are buttons for the different report groups in QuickBooks. Click on the desired group to see all the prepared reports for that group.
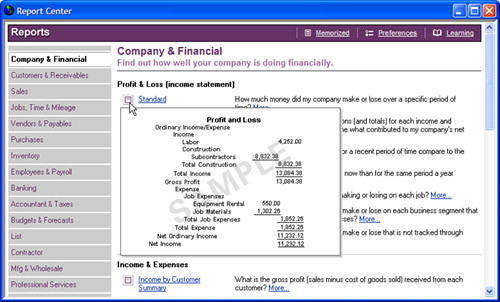
3. Hover the mouse pointer over the small icon image in front of the report name to have QuickBooks show you a preview of the report (see Figure 16.2).
4. Click the Report Name link to run the report using your data.
5. If you need additional information about the expected content of the report or why the report is useful, click the More links in the text. QuickBooks will open the help menu text specific to that report.
6. Click Memorized to access memorized reports. You can find more details about memorizing reports later in this chapter.
7. Click Preferences to set personal report preferences as well as company preferences (if you are logged into the data file as the Admin user). You can find more details about setting report preferences later in this chapter.
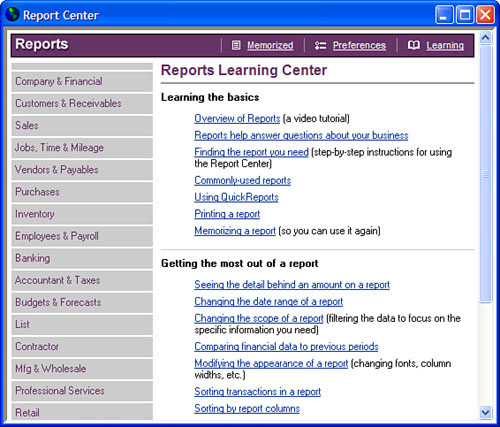
8. Click Learning to open the Reports Learning Center, shown in Figure 16.3. On this page are links for learning the basics, getting the most out of a report, and managing reports (not shown in Figure 16.3).
QuickBooks makes customizing reports globally through the use of the Reporting Preferences easy. Reporting Preferences come in two types: My Preferences, or those that are unique to a logged-in user, and Company Preferences, which can only be set by the Admin user and represent global settings for all users.
The My Preference setting for reports is user specific. These preferences are set only for the currently logged-in user. To access user-specific preferences for reports:
1. Choose Edit, Preferences and select the Reports and Graphs from the preferences dialog that opens.
2. Click the My Preference tab.
You can specify the following settings that will be unique for the currently logged-in user (if using QuickBooks in a multi-user mode):
• Prompt to modify report—When selected, this option causes QuickBooks to open the Modify Report window when each report is opened.
• Reports and Graphs refresh—You have a choice, when report details have changed, to request QuickBooks to prompt you to Refresh (this is the default option for a new data file), Refresh Automatically, or Don’t Refresh. I usually select the Refresh Automatically option. However, if the report is lengthy and you have multiple users entering data, you might want to review a report, make changes, and not have QuickBooks refresh at the time the change is made.
• Graphs Only—This option offers settings for drawing in 2D (which is faster) or using patterns.
Different from the My Preference setting for Reports and Graphs, the Company Preferences can only be set by the Admin user and are global settings for all users.
To access Company Preferences for reports, log in as the Admin user in single-user mode:
1. Choose Edit, Preferences and select the Reports and Graphs from the preferences dialog that opens.
2. Click the Company Preference tab and set global defaults (for all users) for each of the items listed below.
You can set defaults for the following options for all users:
• Summary Report Basis—You can choose Accrual (default) or Cash Basis. For business owners, I suggest that you discuss this option with your accountant.
• Aging Reports—You can choose to age from the due date (default) or age from the transaction date. This setting determines the aged status of your accounts receivable or accounts payable reports.
• Reports Show Accounts By—You can display accounts by Name Only (the default), Description Only, or Name and Description. These are fields you completed in the Add New Account or Edit Account dialogs, as shown in Figure 16.4. More detail on creating or editing your chart of accounts can be found in Chapter 2. The options are as follows:

• Name Only—Shows account name and account number, as shown in Figure 16.5 (if the use account numbers preference is enabled, see Chapter 2 for more details).
Figure 16.5 Resulting report when the Name Only report preference is selected in addition to having the account numbering preference enabled.
• Description Only—Shows only the information typed in the Description field (shown earlier in Figure 16.4).
• Name and Description—Shows account number, account name, and description, as shown in Figure 16.6.
Figure 16.6 When the Name and Description report preference is selected and if account numbering is enabled.
• Format—Click the Format button to set the following options globally for all reports:
• Click the Header Footer tab to set
Header Information—I recommend leaving each of these choices selected and not modifying them in this window.
Show Footer Information—Here you can enter an additional footer line, such as “Confidential Information” or the like.
Page Layout—Standard (the default), left, right, or center justified.
• Click the Fonts & Numbers tab to set
Fonts—Use this to set fonts for all text or specific text lines. As you select the text line on the left QuickBooks will display the current font choice and size for that text.
Show Negative Numbers—Format choices include normal –300.00; in parentheses (300.00) or with a trailing minus 300.00–. Optionally, you can select to have these numbers print in red.
Show All Numbers—Use this setting to divide all numbers by 1,000, to not show zeros, or to show numbers without the cents. These options are most often used by accounting professionals when providing a statement to a bank and so on.
• Statement of Cash Flows—Click the Classify Cash button to open the Classify Cash dialog. In it you define your Balance Sheet accounts as Operating, Investing, or Financing cash flow types. Typically, the QuickBooks defaults in this dialog are sufficient and you need make no additional modifications.
QuickBooks makes gathering information from your data quick and easy. Though many reports are already created and organized for your use, you might on occasion want to modify an existing report.
This section briefly discusses the options available when you want to modify a report.
A few of the options to modify a report are available directly on any active report dialog. The options include
• Hide Header—Removes the header from the report. Click Show Header when you want it to appear.
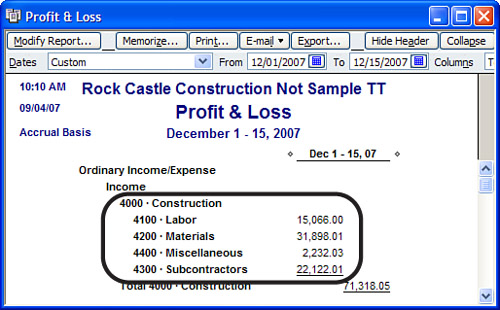
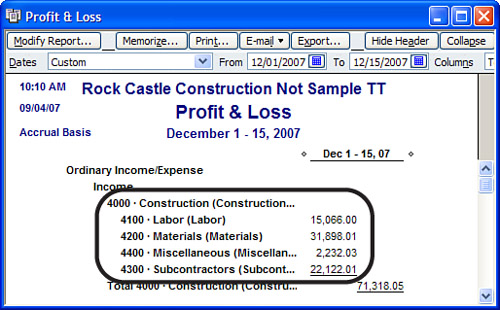
• Collapse—You can also collapse the information as shown in Figure 16.7. When you click the Collapse button, QuickBooks removes the subaccount detail from view only. The report details are not changed, just viewed with fewer line details.

• Columns—For certain reports, you can easily control how the data is subtotaled or grouped.
• Sort By—Use this to group the detail into useful ways for your review. I use this frequently, especially when looking at reports with many lines of detail.
There are other options on the active report window that simply allow you to email, print, or export the report to an Excel format. The additional option to memorize a report is discussed in a following section.
You can modify the report further by clicking the Modify Report button at the top left of the open report dialog. The options for modifying reports vary by report type. Some reports offer the following choices; others might not offer the same report modification choices:
• Display tab—This tab opens automatically when you choose to modify an existing report. From this window you can modify
• Report Date Range—Choose from the QuickBooks predefined date ranges, or set a custom date range for your report.
• Report Basis—You can choose Accrual or Cash. This option is not available on all reports.
• Columns—This setting is useful for selecting what information you want to see and whether you want it sorted or totaled by a specific field on the resulting report.
• Advanced tab—This tab is often overlooked but its settings allow users to display active, all, or non-zero rows as well as the desired reporting calendar.
• Filters tab—Use these options to filter for specific accounts, names, or transaction types as well as many other fields that can be filtered on.

Filtering a report is easy and convenient to do when you only want specific information from a longer report.
If you do filter, you might want to modify your report title so that it identifies what has been filtered. For example, if you are filtering a report to show employee advances detail, you might want to modify the report title to Employee Advances Detail so that those who read the report will know it is pulling out specific information.
• Header/Footer tab—Use this tab to modify the report title and the appearance of the information that appears on the report. You can set this information globally for all users; see the previous section, “Company Preferences.”
• Fonts & Numbers tab—Use this tab to specify fonts for specific line text as well as how numbers appear in your reports. You can set this information globally for all users; see the previous section, “Company Preferences.”
If you have not set up your own customized report groups, you might not know how easy they are to work with and how efficient they can make reporting on your QuickBooks data. This section highlights how to create, use, and manage report groups.
For accountants, this feature can save you precious time each period that you work with your client’s data. You can create a group of reports that you will want to review each time you work with the client’s file.
If my clients were prone to making mistakes when entering data, I would teach them how the data should look, give them their own report group, and request that they review these reports before my appointment.
To create a report group, follow these steps:
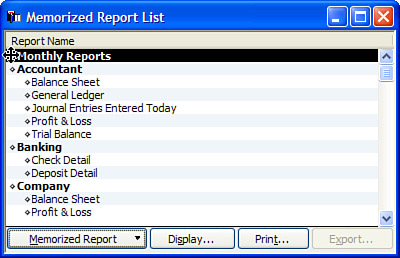
1. Choose Reports, Memorized Reports and select the Memorized Report List menu. The Memorized Report List dialog appears (showing predefined groups and associated reports).
2. Click the Memorized Report drop-down menu at the bottom of the list and select New Group menu.
3. In the New Memorized Report Group dialog provide a name for the group. Click OK to return to the Memorized Report List dialog. QuickBooks places your new group alphabetically in the existing list of report groups.
4. Click on the red X in the upper right to close the Memorized Report List dialog.
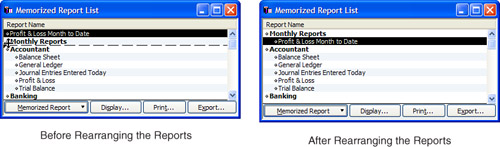
If you are going to be creating several reports that will be included as part of this report group, you will want to move this newly created report group to the top of the list. This is because as you memorize reports for this group, QuickBooks defaults the report group in the Memorize Report dialog to the first one on the list.
When you are done memorizing the reports to this report group (see the next section) then you can move the group list item back alphabetically within the rest of the memorized reports or groups.
To move a report group up or down the list, place your cursor over the diamond shape in front of the report group name. Drag the item up or down. Figure 16.8 shows the new Monthly Reports group being moved to the top of the list.
The primary purpose of report groups is to simplify displaying, or printing multiple reports at one time.
To display a group of reports, follow these steps:
1. Click Reports, Process Multiple Reports. The Process Multiple Reports dialog appears.
2. From the Select Memorized Reports From drop-down menu, select the specific group of reports you want to create, as shown in Figure 16.9. Figure 16.10 shows the Banking report group selected.
Figure 16.9 The Process Multiple Reports dialog allows you to choose what group you want to conveniently create.
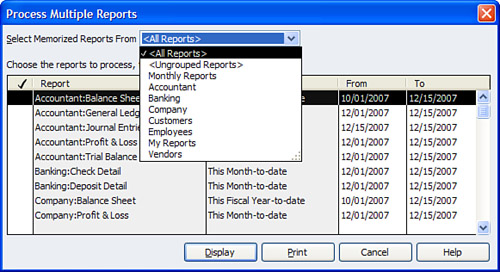
Figure 16.10 The Banking report group has been selected, and those reports memorized with this group are shown.
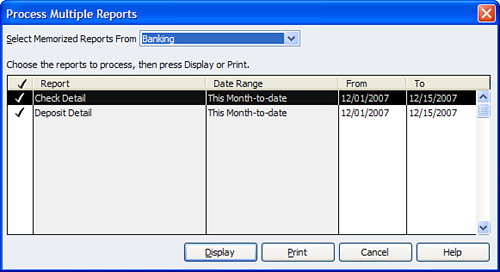
3. Remove the check mark for any report you do not want to process in the group.
4. In the From and To columns, change the date as needed. Be aware that these changes are not permanent. The next time you create the report group, the original date range stored with the report will appear.
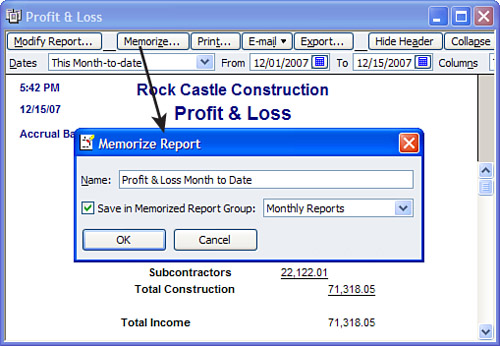
When memorizing a report that you will be adding to a report group, be aware of the date range selected. If you want to see the dates for the current month-to-date, you would select This Month-to-Date for the date range for the report so that the report, whenever it is generated, will use data from the then current month-to-date.
If you select a specific range of dates on a memorized report, QuickBooks considers those dates custom and will always generate the report with those specific dates.
5. Click Display to view the reports on your computer screen or click Print to send the selected reports to your printer.
Your report group will now generate the multiple reports for you to view or print. I often create a report group for my clients called either Monthly or Quarterly Reports. In this group I put certain reports I want them to review before my appointment. This method helps them help me in keeping their QuickBooks data organized.
To manage a report group, follow these steps:
1. Click Reports, Memorized Reports and select Memorized Report List. The Memorized Report List dialog appears (showing predefined groups and associated reports).
2. Click the Memorized Report button at the bottom of the list to choose the following memorized report list options:
• Edit Memorized Report—Edit the name of an existing report list item or which group it is associated with (you do not edit the date ranges or filters from this dialog).
• New Group—Used to create an association of multiple reports, discussed in the prior section.
• Delete a Memorized Report—Helpful in managing the list and changes over the years.
• Print the List—Do this if needed to manage what reports are useful.
• Re-sort the List—Not often needed with this list, but if used, your list will return to its original order before any custom changes to the organization of the list items.
• Import or Export a Template—Create and then use reports for multiple client data files. See the section titled “Exporting and Importing Report Templates.”
3. To rearrange your reports, simply place your cursor on the diamond in front of the report name, and click and drag down and to the right, as demonstrated in Figure 16.11. Release the mouse button when the report is in the proper position.
Figure 16.11 Click and drag the diamond in front of any report or group to rearrange the list manually.
From the memorized report list you can also export your reports to Excel without first displaying them in QuickBooks. Use these report groups to streamline your data reviews. You can use the Memorize feature for many of the special reports discussed in this book and place them in a report group for easy and frequent access.
After you have created a report group, you will want to use the memorize feature for the reports that you want in that group. Placing your memorized reports in a group is optional, but using groups will help keep your memorized reports organized.
To memorize a report, simply click the Memorize button at the top of an open report, as shown in Figure 16.12. QuickBooks asks you to give the report a Name and lets you assign it to a report group (optional). (You must first create the report group so it appears in the drop-down list in the Memorize Report window.)
Figure 16.12 Click Memorize in any report, give the report a name, and (optionally) assign it to a report group.
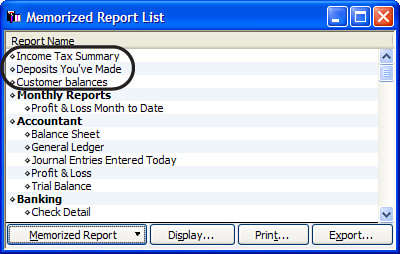
If you choose not to assign a report group, your memorized reports are listed individually at the top of the Memorized Report List, as shown in Figure 16.13.
QuickBooks offers the option to export and import report templates. This feature is very useful for accountants who want to save time by having several clients use the same report template.
Only the format and filter settings are stored with report templates. If you create a report template and then have several clients use it, when the client imports it the desired report is generated with the current client’s data, not the data that it was created with.
You can export and import a single report or a group of reports only from the Memorized Report List. So before you attempt to export a report, be sure QuickBooks memorizes it first.
To export a report or report group template, follow these steps:
1. Click Reports, Memorized Reports. The Memorized Reports List dialog appears.
2. On the Memorized Reports List dialog select Export Template from the Memorized Reports List drop-down menu.
3. The Specify File Name dialog appears in Windows Explorer, allowing you to select a location to store the template (.QBR extension).
4. Simply attach the stored report template or report group to an email, or copy it to a removable storage device such as a USB drive to share with other QuickBooks data files.

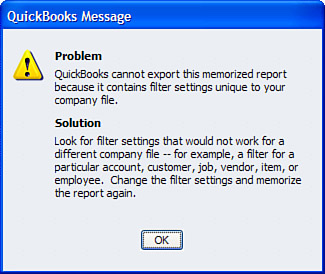
Certain restrictions exist when creating a template for export. For example, if you filter for a specific account that might not be present in every customer’s file, QuickBooks will provide the message shown in Figure 16.14, indicating that this report cannot be exported.
To import a report or report group template, follow these steps:
1. Click Reports, Memorized Reports. The Memorized Reports List dialog appears.
2. On the Memorized Reports List dialog select Import Template from the Memorized Reports List drop-down menu.
3. The Specify File Name dialog appears in Windows Explorer, allowing you to select the stored location of the .QBR template.
4. Select the appropriate .QBR report or report group template.
5. Click Open. The Memorize Report dialog appears for you to assign a name for the report and optionally assign it to a group.
6. Click OK to add the report to your memorized report list.
Did you know that an abundance of reports are already created for you to import into your or your clients’ data file?
Both business owners and accountants will find these reports useful and unique to what you already have in QuickBooks.
Go to www.quickbooksgroup.com. On the left, select QB Library and from the QB Library menu dialog, select Reports. QuickBooks provides a long list of reports available for you to download and import into your or your client’s own QuickBooks data file.
You might have occasions where you want to export your reports to Excel to manipulate them in some more extensive method than is available while working in QuickBooks.
I generally try to discourage exporting to Excel and do my best with a client to find the appropriate report in QuickBooks, simply because any changes you make to your report in Excel do not “flow” back into your QuickBooks data file. Also, any changes you make to your QuickBooks data file do not change the information in an existing exported Excel copy of your QuickBooks report.
To export a report to either .CSV or Excel format, follow these steps:
1. From the open report, click the Export button at the top of the report. The Export Report dialog appears.
2. Choose between the .CSV or Excel format.
3. On the Basic tab of the Export Report dialog, you can select to export to a new Excel file or an existing Excel file. In Figure 16.15 I have selected a new Excel workbook.
Figure 16.15 The Export Report dialog allows you to choose the format for the export as well as to create a new file or import into an existing file.
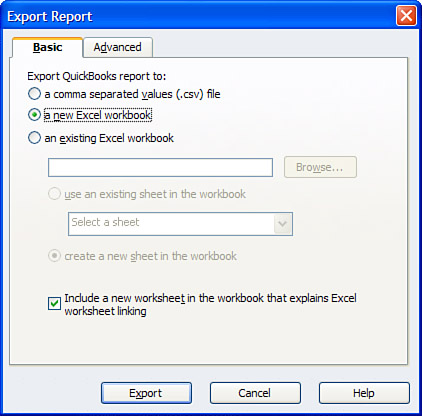
4. On the Advanced tab of the Export Report dialog are options for preserving QuickBooks formatting, enabling certain Excel features, and printing options. Test these options a few times, alternating what features or print options are selected. You might be surprised at the outcome.
5. Click Export to create the exported report, as shown in Figure 16.16.
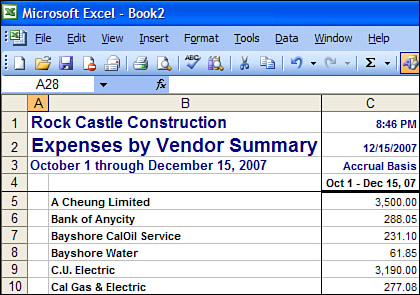
Remember, however, that exported reports are “static”—their information is fixed in time. Changes made to the Excel report do not go back into QuickBooks and changes in QuickBooks do not update the Excel report until it is exported again. So, use the export tool with caution so that you do not create more work for yourself.
Did you know that you can email reports from your QuickBooks data? This can be a very convenient way to get paper data to your customers, vendors, and even accountant. QuickBooks 2008 has greatly enhanced the functionality of email, now offering Outlook users the option of sending reports and forms through your own Outlook account, the benefit of having a record kept in the “sent” folder.
When you email the report, QuickBooks offers two options when emailing: one is to create a separate Adobe PDF for each report, or you can also choose to create an Excel file that is attached to the email. You must have an Internet connection on the computer that is used to send the report from.
To email a report, follow these steps:
1. From the open report, click Email and choose whether to send the Send Report as Excel or to send the Send Report as PDF.
2. If a security message appears indicating that sending information over Internet email is not secure, click OK to continue or click Cancel.
New for QuickBooks 2008, if you clicked OK, QuickBooks launches Outlook (if it’s not already open) within QuickBooks and creates a new message with the report attached, as shown in Figure 16.17. This feature allows you to use your Outlook database for email addresses as well as track your sent items. This improvement over previous years’ versions of QuickBooks is another great reason to upgrade your software.
Figure 16.17 New for QuickBooks 2008, reports sent as PDF or Excel attachments can use your Outlook to send.
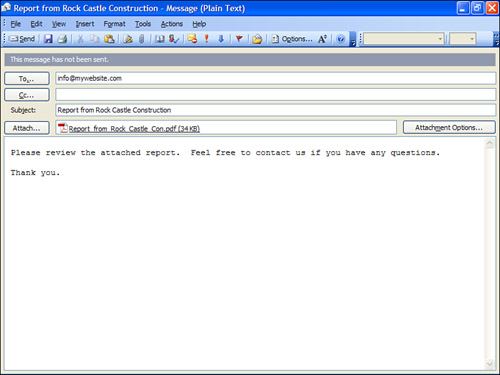
If you do not use Outlook for your email, QuickBooks continues to send the email through QuickBooks Business Solutions, which has been available for years. Figure 16.18 shows how the email is created within QuickBooks when Outlook is not your email program.

3. If you are sending the report through Outlook simply add your email address and any additional comments to the email. Click Send when done. You are returned to your QuickBooks data file and the email is stored in your Outlook sent folder.
If you are not using Outlook for email, simply click Send Now and QuickBooks transmits the email for you.
QuickBooks offers an automated sync of contacts with Microsoft’s Outlook. To obtain this tool simply download it from http://support.quickbooks.intuit.com/support/tools/contact_sync/.
This free tool will create a menu option in your Outlook program where you can sync your QuickBooks contacts to Outlook or Outlook to QuickBooks.
The tool has been improved greatly over the last couple of years and any business using both QuickBooks and Outlook can be more efficient when syncing shared data between the two programs.
The Financial Statement Designer tool is unique for the accounting professional and is only available from the QuickBooks: Premier Accountant Edition as well as QuickBooks Enterprise (all editions).
The Financial Statement Designer, commonly referred to as FSD, offers accounting professionals the ability to create a standard set of financial statements that comply with Generally Accepted Accounting Principles (GAAP) without changing the way that the client works or reports in QuickBooks.
For example, with FSD you can combine all the cash accounts within QuickBooks into one “Cash & Cash Equivalents” line on your GAAP-compliant financials, all without changing the client’s QuickBooks data.
A few of the other benefits of using FSD include the following:
• Excel spreadsheet-like tools allow you to customize data fields and format your report in any way that meets your specific reporting needs.
• FSD is linked in “real time” to the QuickBooks data, which means that you can click on a number in the FSD report and it will take you into the QuickBooks data where you can edit the transaction. Unlike exporting to Excel, changes made in FSD do affect your QuickBooks data.
• FSD comes with many different templates for the Balance Sheet, Income Statement, and Statement of Cash Flows, as well as Compilation and Review letters. Or you can start from scratch and create your own.
• FSD is integrated with QuickBooks Premier: Accountant Edition and QuickBooks Enterprise Solutions all editions and does not need to be purchased separately.
• FSD limits the need to use outside programs to produce a complete set of financials. FSD offers you the ability to design your title page as well as review letters in addition to customizing the financials.
• FSD lets you assign the order in which you want to print the documents making it simple to produce a complete set of professional-looking financials right from within QuickBooks.
Discussing in detail how to work with the Financial Statement Designer tool is beyond the scope of this book.
To find out more about the Financial Statement Designer tool, from the QuickBooks: Premier Accountant Edition or Enterprise Solutions Accountant Edition, click Accountant, Financial Statement Designer. If you are not currently using a version of the QuickBooks product that offers this tool, you can get more information about it by going to http://accountant.intuit.com/, clicking on QuickBooks Accountant Edition, and selecting Key Features.