Chapter 17. Generating Financial Statements
When you keep your company’s books day after day, all those invoices, checks, and other transactions blur together. But hidden within that maelstrom of figures is important information for you, your accountant, your investors, and the IRS. When consolidated and presented the right way, your books can tell you a lot about what your company does right, does wrong, could do better, and has to pay in taxes.
Over the years, the Financial Accounting Standards Board (FASB) has nurtured a standard of accounting known as GAAP (Generally Accepted Accounting Principles). GAAP includes a trio of financial statements that together paint a portrait of company performance: the income statement (also known as the Profit & Loss report), the balance sheet, and the statement of cash flows.
Generating financial statements in QuickBooks is easy. But unless you understand what financial statements tell you and you can spot suspect numbers, you may end up generating fodder for your paper shredder. If you’re new to business, get started by reading about what the income statement, balance sheet, and statement of cash flows do. If you’re already an expert, you can jump to the section on generating these reports in QuickBooks (Generating a Profit & Loss Report).
Note
When you close out a year on your company books, these three special financial reports are a must. You’ll learn how financial statements fit into your year-end procedures in Chapter 18. If you’re a business maven and need a bunch of additional reports to manage your business, Chapter 21 has instructions for finding the reports you need and customizing them to your demanding specifications.
The Profit & Loss Report
The Profit & Loss report is more like a video than a snapshot. It covers a period of time, usually a month, quarter, or a full year, and it shows whether your company is making money—or hemorrhaging it.
Understanding the Profit & Loss Report
The money you make in sales (income) sits at the top of the Profit & Loss report. Beneath it, your expenses gradually whittle away at that income until you’re left with a profit or loss at the bottom. The Profit & Loss report (Reports → Company & Financial → Profit & Loss Standard) and the bullet points that follow explain the progression from sales to the net income your company earned after paying the bills.
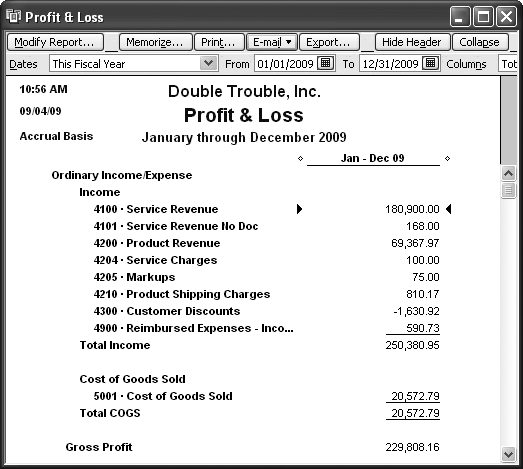
Income. The first category in a Profit & Loss report is income, which is simply the revenue your company generates by selling products and services to your customers. Regardless of how you earn revenue (selling services, products, or even charging fees), the Profit & Loss report shows all the income accounts in your chart of accounts and how much you brought into each, as shown in Figure 17-1.
Figure 17-1. The Income section at the top of the Profit & Loss report lists the accounts that represent the money you make when you sell to customers. Frustratingly, most companies have to subtract the cost of goods sold from income to figure out how much they really brought in. Cost of goods sold usually includes the cost of materials and labor to build products, or the cost of the products you purchase for resale.Tip
The Profit & Loss report lists accounts in the order they appear in the Chart of Accounts. If you want to report your income and expenses in a specific order, you can rearrange the accounts in the Chart of Accounts window (press Ctrl+A to open it). Hover the pointer over the diamond to the left of the account name. When the pointer changes to a four-headed arrow, drag it to where you want to move the account.
Cost of Goods Sold. Unless you gather rocks from your yard and then sell them as alien amulets, the products you sell carry some initial cost. For example, with products you purchase for resale, the cost is the original price you paid for them, the shipping costs you incurred to get them, and so on. In the Profit & Loss report, Cost of Goods Sold adds up the underlying costs associated with your product sales.
By the way, if you don’t sell inventory items, you might not have a Cost of Goods Sold section. Most of the time, Cost of Goods Sold relates to the costs of buying materials and building the products you sell. But depending on the type of business, Cost of Goods Sold can include labor costs, product shipping, an agent’s percentage, and so on.
Gross Profit. Gross profit is the profit you make after subtracting the Cost of Goods Sold. For example, if you sell equipment for $100,000 and you paid $60,000 to purchase that equipment, your gross profit is $40,000. The box below explains how to see whether your gross profit is in line with your industry.
Expenses. The next and longest section is for expenses—all the things you spend money on running your business, sometimes called overhead. For example, office rent, telephone service, and bank fees all fall into the overhead expense bucket. The name of the game is to keep these expenses as low as possible without hindering your ability to make money.
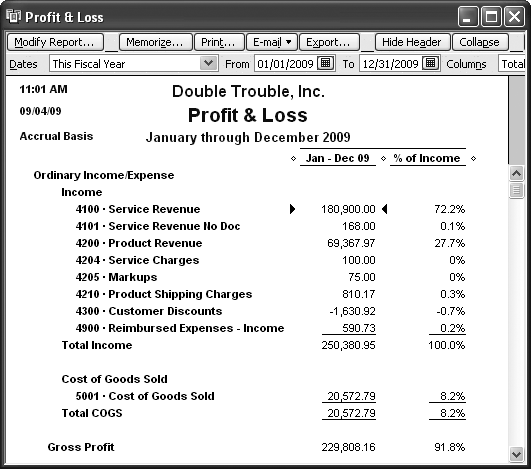
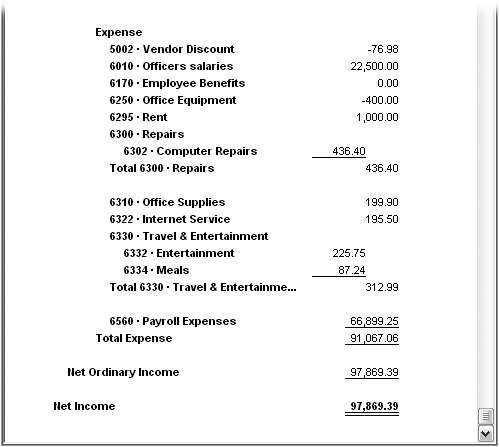
Figure 17-2. You can use the percentages in the “% of Income” columns to analyze company performance in other ways. For example, when you’re trying to find places to cut costs, look for expense accounts that take up a large percentage of your income. Or compare the percentage of net profit to the average for your industry.Net Ordinary Income. QuickBooks uses the term Net Ordinary Income to describe the money that’s left over after you pay the bills. You’ve probably also run across this measure referred to as net profit or net earnings. Figure 17-3 shows the expenses and net ordinary income portion of a Profit & Loss report.
Figure 17-3. If your company makes more money than it spends, your net income (also called net profit) is a positive number. Despite the report’s name, QuickBooks doesn’t label your result a loss when your company spends more than it makes. Instead, a loss shows up as a negative number for net income.Other Income/Expense. Income and expenses that don’t relate to your primary business fall into the Other Income/Expenses category. The most common entrants are the interest income you earn from your savings at the bank, the interest you pay on your loans, or bad debt. In this category, income and expense are bundled together and offset each other. The result is called Net Other Income. For example, if you have only a smidgeon of cash in savings but a honking big mortgage, Net Other Income will be a negative number.
Net Income. At long last, you reach the end of the report. Net Income is the money that’s left after subtracting all the costs and expenses you incur. If Net Income is positive, congratulations—your company made money! When Net Income is negative, your expenses were more than your income, and something’s gotta give.
Generating a Profit & Loss Report
If you choose Reports → Company & Financial, QuickBooks gives you several built-in Profit & Loss reports to choose from. Choose Profit & Loss Standard to see a month-to-date report, which, if you’ve built your mom-and-pop shop into a merchandising monster, might be just the one you want.
Note
Before you generate your first financial statements, be sure that QuickBooks reports your numbers using your company’s own accounting method. The Summary Reports Basis preference (Preferences That Apply to Every Company Report) sets your reports to use either accrual or cash accounting. When you choose the Cash option, your Profit & Loss reports show income only after you receive customer payments, and show expenses only after you pay bills. With the Accrual option, income appears in Profit & Loss reports as soon as you record an invoice or other type of sale, and expenses show up as soon as you enter bills.
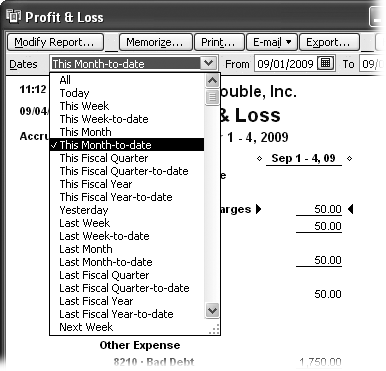
But for many small companies, month-to-date numbers can be rather sparse. You can change the month-to-date report that QuickBooks produces into a year-to-date Profit & Loss report, as described in Figure 17-4. (The box on Understanding the Balance Sheet tells you how to save a Profit & Loss report after you tweak it to look the way you want.)
Tip
In accounting, pro forma reports are financial statements that show financial results excluding unusual or one-of-a-kind transactions. In business lingo, pro forma means projected results. QuickBooks doesn’t produce pro forma reports out of the box, but you can trick it into doing so. Create a new company file (Company Information) using the same accounts as your real company file and create a journal entry (Creating General Journal Entries) to set the values for all your accounts. Anytime you want to create a pro forma report, edit the account debits and credits in the journal entry to the values you want, and then run whichever report you want.
Other Profit & Loss Reports
If the Profit & Loss Standard report in the previous section isn’t what you want, take a few minutes to see if any of the other built-in Profit & Loss reports fit the bill. Here’s a guide to the other Profit & Loss reports on the Reports → Company & Financials menu and when you might use them:
Profit & Loss Detail. Only the tiniest of companies—or the most persnickety of bookkeepers—uses this report regularly. The Profit & Loss Detail report is a year-to-date report that includes a separate line for every service and product you sold, every other charge that produced revenue, and every item on every bill you paid. It comes in handy when the numbers on your standard report seem a bit off and you want to find the culprit.
Tip
If you spot questionable numbers in a Profit & Loss report, just double-click the number for a closer inspection. When you hover the pointer over a number, an icon that looks like a Z inside a magnifying glass appears; that’s your clue that double-clicking the number will drill down into the details. For example, if you double-click a number in a Profit & Loss Standard report, QuickBooks displays a Transaction Detail By Account report with each transaction that contributed to the total. In a Profit & Loss Detail report, double-clicking a transaction opens the Create Invoices window (or corresponding window) to view that transaction.
Profit & Loss YTD Comparison. This report pits the Profit & Loss results for two periods side by side: the current month to date and the year to date. You might find a reason to run this report, but comparing a period to its predecessor from the previous year usually shows business trends more clearly (see the next report), especially for seasonal businesses such as retail or landscaping.
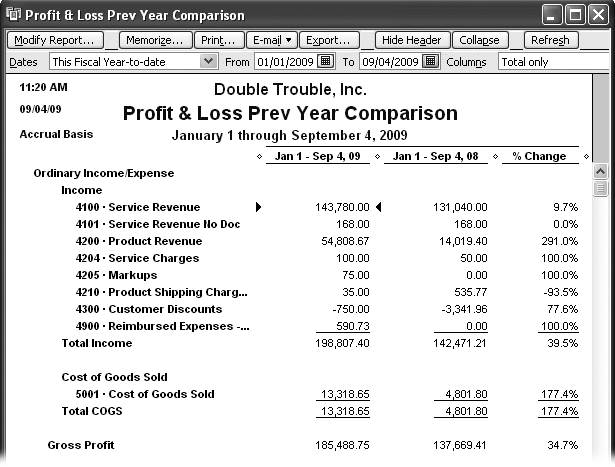
Profit & Loss Prev Year Comparison. If you own a gift shop, you know that sales are highest around the holidays. If you compare the last quarter of one year to the first quarter of the next, the Profit & Loss report would look pretty grim. Sales would be down and possibly exacerbated by returns from holiday purchases. To see whether your business is growing, compare your previous year to the current year with the report shown in Figure 17-5.
Figure 17-5. The Profit & Loss Prev Year Comparison report sets the Dates box to “This Fiscal Year-to-date” and shows your results for the current year in the first column and those from the previous year in the second column. If you want to see where growth is strong or stagnant, include the columns that show the change in dollars or percents (Understanding the Balance Sheet). Right after your fiscal year ends, you can change the Dates box to “Last Fiscal Year” to compare the year you just finished to the one before.Profit & Loss by Job. If you suspect that some of your customers and jobs are less profitable than others—and you want to learn from your mistakes—choose the Profit & Loss by Job report. In this report, each of your customers and jobs appears in its own column so you can compare how much profit you made for each. The box on Understanding the Balance Sheet tells you how to compare apples to apples.
Profit & Loss by Class. When you use classes to track performance for different business units or locations, use this report to produce a Profit & Loss report for each business entity. Each class has its own column. If you’d rather generate a Profit & Loss report that shows only one class, modify the report to filter for that one class (see Filtering Reports). Unclassified is the label for last column in this report, which represents all the transactions that don’t have a class assignment.
Profit & Loss Unclassified. Before you pretty up and print your class-based Profit & Loss reports, run this one to see the numbers for transactions without class assignments. Depending on how you use classes, unclassified transactions might be perfectly acceptable. For example, if you track income by partner, overhead expenses aren’t related to individual partners. You shouldn’t see any non-zero values for income accounts, but you might see expense accounts with non-zero values.
The Balance Sheet
If a Profit & Loss report is like a video, a balance sheet is more like a portrait. This report shows how much your company owns (assets), how much it owes (liabilities), and the equity in the company at a given point in time. While a Profit & Loss report tells you whether you’re making money, the balance sheet (Reports → Company & Financial → Balance Sheet Standard) measures your company’s financial strength.
Understanding the Balance Sheet
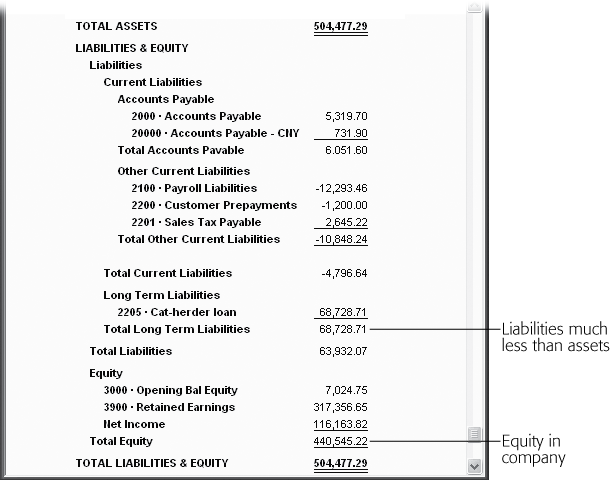
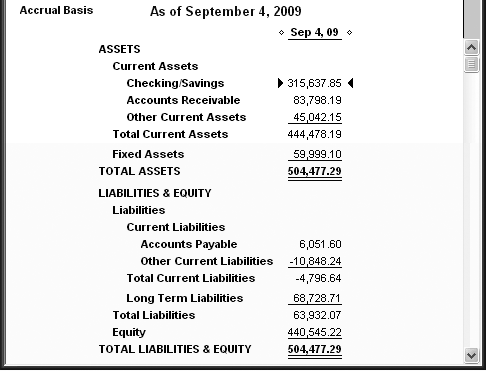
One thing you can count on with a balance sheet is that the total assets in the report always exactly balance the total of the liabilities and equity, as you can see in Figure 17-6. The key to a good-looking balance sheet is not having too much debt. How much is too much? It depends on the industry you’re in, but the acid test is if you closed up shop today and sold all your assets, would you have enough money to pay off your liabilities? If the answer is no, you’ll have a hard time finding a bank to loan you more money. A balance sheet is strong when it shows a lot of assets but not many liabilities.
Here’s what to look for in each section of a balance sheet:
Assets. Assets are things of value that a company owns, such as equipment, land, product inventory, accounts receivable, cash, and even brand names. On a balance sheet, you want to see significantly more money in the asset section than in the liabilities section.
Figure 17-6. The Balance Sheet report earns its name because of math, not magic, and this is the formula that puts the balance into a balance sheet: Equity = Assets—Liabilities. As you buy more or borrow more, the value of your equity changes to make up the difference.Note
Even with assets, you can have too much of a good thing. Assets aren’t corporate collectors’ items. Companies should use assets to make money. A measure called return on assets (the ratio of net income to total assets) shows whether a company is using assets effectively to produce income. Return on assets varies from industry to industry, but, typically, less than five percent is poor.
Liabilities. Liabilities include accounts payable (bills you haven’t yet paid), unpaid expenses, loans, mortgages, and even future expenses, such as pensions. Debt on its own isn’t bad. It’s too much debt that can drag a company down, particularly when business is slow. Debt payments are due every month whether your business produced revenue or not.
Equity. Equity on a balance sheet is the corporate counterpart of the equity you have in your house. When you buy a house, your initial equity is the down payment you make. But both the increasing value of your house and the decreasing balance on your mortgage contribute to an increase in your equity. Equity in a company is the dollar value that remains after you subtract liabilities from assets.
Generating a Balance Sheet Report
A balance sheet is a snapshot of accounts on a given date. The difference between the built-in balance sheet reports that QuickBooks offers is whether you see only account balances or all the transactions that make up those balances. Choose Reports → Company & Financial and you can choose any of the following reports on the menu:
Balance Sheet Standard. This report includes every asset, liability, and asset account in your chart of accounts—unless the account has a zero balance. QuickBooks automatically sets the Dates box to “This Fiscal Year-to-date”, so the report opens showing your balance sheet for the current date. If you want to see the balance sheet at the end of a quarter or end of the year, in the Dates box, choose This Fiscal Quarter, This Fiscal Year, or Last Fiscal Year.
Balance Sheet Detail. Printing the Balance Sheet Detail report is a good way to use up the last of your old printer paper, but it isn’t that useful for managing your business. This report shows the transactions over a period in each of your asset, liability, and equity accounts. Should a number on your regular balance sheet report look odd, use this report to verify your transactions. Double-click the value for transactions to open the corresponding window, such as Enter Bills.
Balance Sheet Summary. If you want to see the key numbers in your balance sheet without scanning past the individual accounts in each section, this report shows subtotals for each category of a balance sheet, as shown in Figure 17-7.
Balance Sheet Prev Year Comparison. If you want to compare your financial strength from year to year, this report has four columns at your service: one each for the current and previous year, one for the dollar change, and the fourth for the percentage change.
Note
When you review your Balance Sheet Prev Year Comparison report, you typically want to see decreasing liabilities. If liabilities have increased, then assets should have increased as well. You don’t want to see more debt without more assets to show for the trouble. Equity is the value of your—and your shareholders'—ownership in the company, so it should increase each year. (If you use QuickBooks to keep the books for your one-person consulting company, the equity may not increase each year if, for example, you use the same assets like your laptop and printer, and withdraw most of the profit you make as your salary.)
The Statement of Cash Flows
Thanks to non-cash accounting anomalies like accrual reporting and depreciation, profit and loss reports don’t tell you how much cash you have on hand. Cash flow helps you figure out whether your company generates enough cash to keep the doors open. Your balance sheet might look great—$10 million in assets and only $500,000 in liabilities. But if a $50,000 payment is due and you only have $3,000 in the bank, you have cash flow problems.
Understanding the Statement of Cash Flows
The concept of cash flow is easy to understand. In the words of every film-noir detective, follow the money. Cash flow is nothing more than the real money that flows in and out of your company—not the non-cash transactions, such as depreciation, that you see on a Profit & Loss report.
Figure 17-8 shows sources of cash in a sample statement of cash flows.
Warning
When you sell an asset, which is an investing activity, it shows up as a gain or loss on the Profit & Loss report, which temporarily increases or reduces net income. Beware: the effect of investing activities on the Profit & Loss report can hide problems brewing in your operations, which is why you should examine the "Statement of Cash Flows” report. If your income derives mainly from investing and financing activities, instead of operating activities, you’ve got a problem.
Generating a Statement of Cash Flows
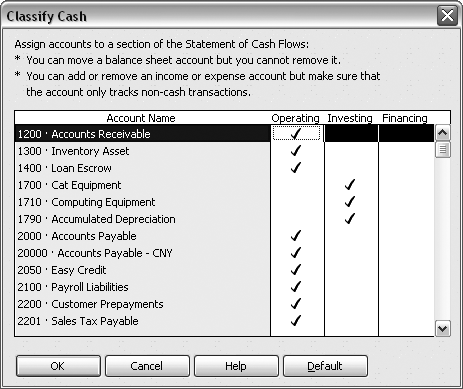
To create a “Statement of Cash Flows”, QuickBooks automatically deals the accounts that appear in your company’s balance sheet into one of the three cash flow categories: Operating, Investing, and Financing. And the program almost always gets those assignments right. For example, Accounts Receivable and Inventory appear as operating accounts, fixed asset accounts show up as investing, and accounts for loans fall under financing. Unless you’re a financial expert or your accountant gives you explicit instructions about a change, you’re better off leaving the QuickBooks account classifications alone. If you need to reassign accounts for your “Statement of Cash Flows” report, this section tells you how.
Generating a “Statement of Cash Flows” is easy, because you have only one report to choose from. Simply choose Reports → Company & Financial → “Statement of Cash Flows”. QuickBooks creates the report (see Figure 17-8) with your cash flow for your fiscal year to date. To view the “Statement of Cash Flows” for a quarter or a year, in the Dates box, choose This Fiscal Quarter or This Fiscal Year.
Note
The Operating Activities section of the report includes the unfortunate label: “Adjustments to reconcile Net Income to net cash provided by operations”. QuickBooks calculates the net income at the top of the "Statement of Cash Flows” on an accrual basis (income appears as of the invoice date, not the day the customer pays). But the "Statement of Cash Flows” is by nature a cash-based report. So the program has to add and subtract transactions to get net income on a cash basis.
The account assignments for the “Statement of Cash Flows” report are a collection of preferences you can find in the Preferences dialog box. Here’s how to view the account assignments or change them:
Choose Edit → Preferences to open the Preferences dialog box.
In the Preferences icon bar, click Reports & Graphs, and then click the Company Preferences tab.
Click Classify Cash.
QuickBooks opens the Classify Cash dialog box. As described in Figure 17-9, here’s where you change your account categories.
When the assignments are the way you want, click OK to close the dialog box.
Other Helpful Financial Reports
Although financial statements are the ones that other people like shareholders and the IRS want to see, other financial reports help you, the business owner, keep tabs on how your enterprise is doing. This section introduces a few other QuickBooks reports that help you evaluate your business performance.
Note
Reports that apply to specific bookkeeping and accounting tasks are explained in the chapters for those tasks, such as accounts receivable reports in Chapter 13, Chapter 13.
Reviewing income and sales. If you’re introducing enhanced services to keep your best customers—or you’re looking for the customers you want your competition to steal—use the "Income by Customer Summary” report. Choose Reports → Company & Financial → “Income by Customer Summary” to see total income for each of your customers; that is, the total dollar amount from all of a customer’s invoices and statement charges. Customers with low income totals might be good targets for more energetic sales pitches. High income values could indicate customers ripe to purchase more of your goods and services. If you find that most of your income comes from only a few customers, you may want to protect your income stream by lining up more customers. (One thing this report doesn’t show is how profitable your sales to customers are. Understanding the Profit & Loss Report explains how to see that.)
Reviewing expenses. On the expense side, the "Expenses by Vendor Summary” report shows how much you spend with each vendor. If you spend tons with certain vendors, maybe it’s time to negotiate volume discounts, find additional vendors as backups, or set up electronic ordering to speed up deliveries.
Comparing income and expenses. The Income & Expense Graph (on the same submenu) includes a bar graph that shows income and expenses by month and a pie chart that breaks down either income or expenses. You can’t change the time periods for each set of bars on the graph, so it’s not much help with spotting trends. You can click Income or Expense at the bottom of the window to see the breakdown of income or expense. To specify how income or expense is broken down, click By Account, By Customer, or By Class in the window icon bar.
What you’ve sold. Most companies analyze their sales to find ways to improve. Maybe you want to beef up sales to customers who haven’t bought from you in a while, turn good customers into great ones, or check on how well your stuff is selling. The Sales By Customer Summary is a terse listing of customers and how much you’ve sold to each one during the timeframe you specify (it shows “This Month-to-date” initially). Choose Reports → Sales → Sales By Customer Summary to run it.
The Sales Graph presents sales data in a cheery rainbow of colors, but you can quickly switch the graph to show the breakdown of sales by customer, item, and sales rep. Choose Reports → Sales → Sales Graph to generate it. The bar graph shows sales by month for the year to date. If you want to change the duration covered by the graph, click Dates and specify the date range you want. The pie chart shows sales slices based on the category you choose. In the window’s button bar, click By Item, By Customer, or By Rep to switch between seeing pie slices for items, customers, and sales reps, respectively.
The Sales By Item Summary shows how much you sell of each item in your Item List, starting with inventory items, then non-inventory parts, and finally service items. This report includes a column for average cost of goods sold (COGS) and gross margin, which apply only to inventory items you sell.
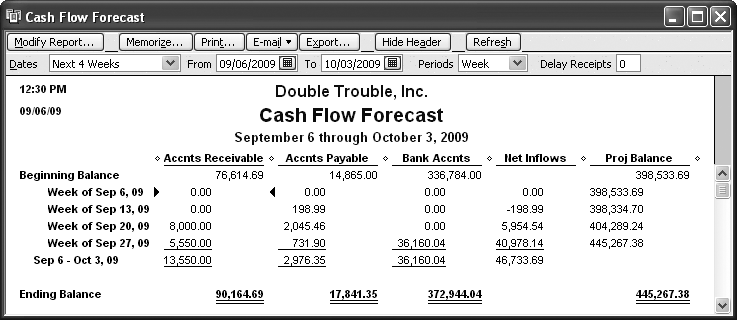
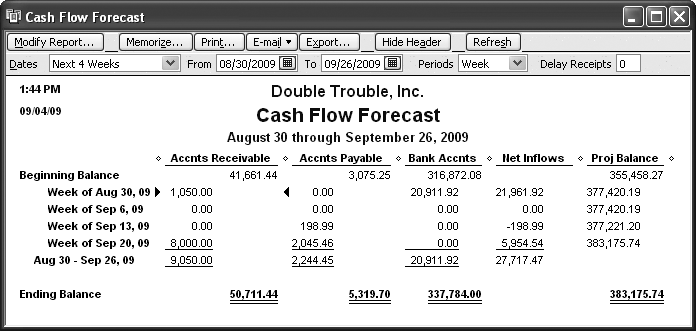
Forecasting cash flow. You may be wondering whether you have any invoices due that will cover a big credit card bill that’s coming up or whether income over the next few weeks is enough to meet payroll. Use the Cash Flow Forecast report to see how much cash you should have over the next four weeks, as shown in Figure 17-10. The Beginning Balance line shows the current balance for your Accounts Receivable, Accounts Payable, and bank accounts. The Proj Balance column shows how much money you should have in your bank accounts at the end of each week (or longer if you choose a different period in the Periods drop-down list). If a number in the column starts flirting with zero, you’re about to run out of cash. You’ll have to speed up some customer payments, transfer cash from another account, or look into a short-term loan.