
Chapter 10
Raspberry Pi in the Sky
In This Chapter
![]() Understanding the cloud
Understanding the cloud
![]() Storing data in Google Docs from your Raspberry Pi
Storing data in Google Docs from your Raspberry Pi
![]() Creating a dashboard and temperature alerts using PrivateEyePi
Creating a dashboard and temperature alerts using PrivateEyePi
![]() Creating a database logger
Creating a database logger
Sensors can generate enormous amounts of data that need to be stored, monitored, and analyzed. In this chapter, we explore Internet service providers that do just that. Later in the chapter, we show you how to log temperature data into a database and view it through a web browser.
Understanding the Cloud
An abundance of services are available through the Internet that can be used by the Raspberry Pi. Increasingly, we’re seeing everyday appliances and sensors connecting to a network providing us with real-time information from and control over those devices. The Raspberry Pi is very good at interfacing with sensors through the general-purpose input/output (GPIO) ports. Its small form factor, processing capability, and simple connectivity to the Internet makes the Raspberry Pi the perfect fit for this new world of connected devices called the Internet of Things.
Connecting to the cloud
Storing sensor data on the Internet requires a connection of some kind to the service provider. Each service provider specifies how to connect to its service and how to send sensor information. The service provider usually requires you to apply for an account or create a user profile, and some charge a fee depending on what services you choose.
In this chapter, we show you the following two free options for storing and viewing sensor data on the Internet:
- Storing data in a Google Docs spreadsheet
- Creating an online dashboard and alerts using PrivateEyePi
For each of these projects, you use the DS18B20 temperature sensor to collect temperature readings. In the next section, we describe how to interface to the DS18B20 sensor that will be used for the basis of the temperature reading you’ll send to each service provider.
Assembling the parts you need
In this project, you use the readily available DS18B20 temperature sensor. Here are all the parts you need to construct your temperature sensor and link it to your Raspberry Pi:
- A DS18B20: This sensor looks like a transistor, but it’s actually a highly accurate one-wire temperature sensor.
- A 4.7k ohm 0.5W carbon film resistor ±5 percent
- A solderless breadboard: A solderless breadboard is a prototyping board where parts and wires can be connected by clipping them into the board. It’s used for prototyping electronics without having to solder parts together.
- A variety of jumper wires: You need male-to-male for breadboard connections and male-to-female for connecting the breadboard to the GPIO pins. Jumper wires usually come in packs of various quantities, colors, and sizes. Although you need only 6 for this project, having 20 to 30 of each should see you through most projects. Any size will do for this project, but shorter male-to-male (10cm) and longer male-to-female (20cm) are best.
Constructing the temperature sensor
Besides the power and ground connections, all you need to do is connect the 4.7k ohm pull-up resistor between the signal and power, as shown in Figures 10-1 and 10-2.
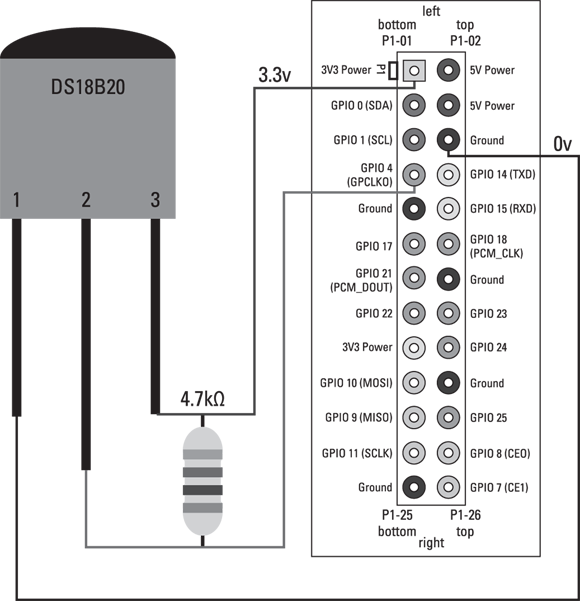
Figure 10-1: A wiring diagram for a DS18B20 temperature sensor connected to a Raspberry Pi.
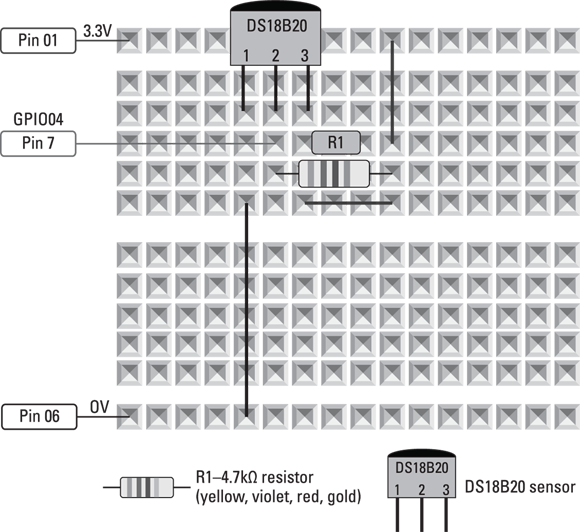
Figure 10-2: A breadboard diagram for a DS18B20 temperature sensor connected to a Raspberry Pi.
 Be sure to use pin 7 on the Raspberry Pi for the sensor connection. The software you use to interface with the DS18B20 is hard-coded for pin 7, so you can’t use another pin for this sensor.
Writing the software
The software required to interface with the DS18B20 has already been written and is built into your Raspberry Pi kernel. You’ll be using an application called modprobe to retrieve the temperature value.
Log into your Raspberry Pi using the root user for this chapter so you don’t run into permission issues during installations. If you don’t have a root user or don’t know whether you have one, you can easily create one using the following command:
sudo passwd root
It’s also a good idea to protect your Raspberry Pi by disabling root access via Secure Shell (SSH). SSH can be used to connect to your Raspberry Pi from a remote location. Edit the SSH configuration file by typing the following command:
sudo nano /etc/ssh/sshd_config
Then look for a setting called PermitRootLogin and change it to no as follows:
PermitRootLogin no
Save the file by pressing Ctrl+X, pressing Y, and pressing Enter. Then log out or restart your Raspberry Pi and use the root user and password you just created.
In the next few sections, you edit files on your Raspberry Pi. If you don’t know how to work with editors on the Raspberry Pi, use Table 10-1 and practice creating new files, editing content, and saving files.
Table 10-1: Useful File-Editing Commands Using the nano Editor
|
Description |
Sample Linux Commands |
|
Navigate to the desired directory |
|
|
Create a new file |
|
|
Edit the file |
Use the keyboard to create the content of the file. |
|
Save the file |
Press Ctrl+X, press Y, and then press Enter. |
|
Create a new folder (directory) |
|
|
Copy the file |
|
|
Change directory |
|
|
Delete the file |
|
At the Raspberry Pi command prompt, type the following two commands:
modprobe w1-gpiomodprobe w1-therm
One of the nice features of the DS18B20 sensor is that it has a unique number that allows you to use multiple sensors and uniquely identify the temperature of each sensor. The preceding command interfaces with the sensor and retrieves the temperature, which it then writes to a new directory on the Raspberry Pi. This directory can be found in /sys/bus/w1/devices/. In order to check whether this file was created, you can do a directory listing by typing the following command:
ls /sys/bus/w1/devices/
You should see a directory that correlates to the unique number of your sensor. Every sensor has a unique number, so it won’t be the same as our file, but it will be similar to this:
28-0000040be5b6
Take note of this number for use later in this chapter. If you don’t see a directory with lots of numbers and letters like this one, do the following:
- Check your circuit wiring.
Make sure that you have the correct resistor.
You need to have a 4.7k ohm resistor (sometimes written as 4k7 ohm). Check your resistor by looking at the colored bands on it. If there are four bands, your resistor should have bands in this order: yellow, violet, red, and gold. If there are five bands, look for: yellow; violet; black; brown; and brown, red, gold, or silver for the fifth band.
Feel the temperature gauge with your finger.
If it feels hot, you have it wired back to front.
If you see the new directory, navigate into it and view the contents of the w1_slave file, which will contain the temperature value. (Remember to replace our number with yours.)
cd /sys/bus/w1/devices/28-0000040be5b6nano w1_slave
You see the contents of the w1_slave file, which contains the temperature data in Celsius. In our example (shown in Figure 10-3), the temperature is 20.812°C. Press Ctrl+X followed by N to exit.

Figure 10-3: The temperature shown in the w1_slave file that was created by modprobe.
Now that you’ve completed testing your circuit and you have the sensor working, you can proceed to the next sections about interfacing with public cloud service providers.
Storing Data in Google Docs from Your Raspberry Pi
In this section, we send the temperature readings obtained from the temperature sensor you build in the last section to a Google Docs spreadsheet that gives you access to your sensor data from anywhere on the Internet. The main prerequisite for sending data to Google Docs is having a Gmail address. But we don’t recommend using your Raspberry Pi’s web browser (Midori) because it’s very slow. Instead, use a computer or device that you normally use for browsing the web.
Creating a new Google Docs spreadsheet
Using a PC or a device you normally use to browse the web (but not your Raspberry Pi), go to https://docs.google.com/spreadsheet.
Enter three new column headings — Temperature, Date, and Unit — and give the spreadsheet a name, as shown in Figure 10-4. Take note of the document key that is contained in the URL. The URL will look something like this:
https://docs.google.com/spreadsheet/ccc?key=0Ah0775EeJVAAp0BkTEJha0RyUTBiOU13RS1BVThKcmc#gid=0

Figure 10-4: A new spreadsheet in Google Docs.
The document key is the bold part of the preceding URL, which starts after key= and ends before cmc#gid=0.
Creating an authentication token
You’re using Google’s OAuth 2.0 for devices to authenticate your Raspberry Pi to the Google spreadsheet service. For more details on OAuth 2.0 for devices, go to https://developers.google.com/accounts/docs/OAuth2ForDevices. The authentication process requires that you authorize your Raspberry Pi to write data to Google Docs. Authorizing the Raspberry Pi is a one-time three-step process.
Step 1: Creating a client ID
To create a client ID, start by using a web browser to navigate to https://console.developers.google.com. Then follow these steps:
Click Create Project.
The screen shown in Figure 10-5 appears, prompting you to enter a project name and project ID.
- Enter the project name (as shown in Figure 10-5), and leave the project ID whatever Google made up for you.
Click Create.
A screen providing the menu options for your new project appears.
Click APIs & Auth from the menu bar on the left, and then click Credentials.
The screen shown in Figure 10-6 appears.
Click the Create New Client ID button.
The screen shown in Figure 10-7 appears.
Click the Installed Application radio button, and click the Create Client ID button.
A screen showing your client ID and client secret appears. It looks like Figure 10-8.
You use these two codes later in this section.
Click the Consent Screen option in the menu on the left.
A screen showing your email address and a project name appears.
- Enter your email address in the Email Address field and enter a description like “Temperature Log” in the Project Name field and click Save.

Figure 10-5: Enter a project name.

Figure 10-6: The Credentials menu option.

Figure 10-7: Create a new client ID.
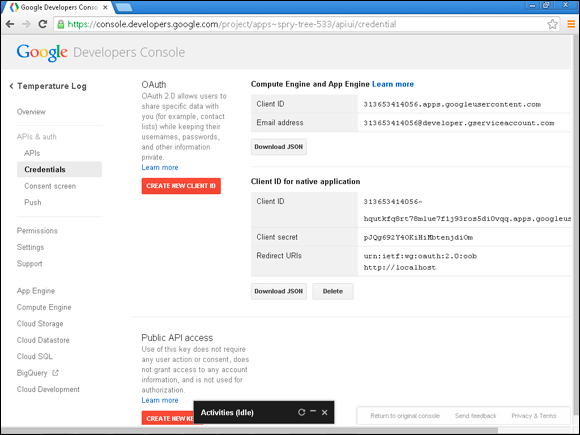
Figure 10-8: Client ID and Client Secret codes.
Step 2: Initializing the token for your Raspberry Pi
You need to download and run the Python program that will log the temperature sensor values to the spreadsheet. The first time you run the program, it prompts you to go to a URL and enter a code (see the next section), which, when entered, gives the program access to the spreadsheet.
On the Raspberry Pi, log in as the root user and type the following commands:
$ cd /home$ apt-get install python-gdata$ git clone git://github.com/gadjetnut/rpipfd.git$ cd rpipfd$ git clone git://github.com/guyc/py-gaugette.git$ ln -s py-gaugette/gaugette gaugette
This process downloads all the software you need. Three Python programs in particular are important for understanding how the software works:
- templogger_gdocs.py: The main program that takes the temperature reading from the sensor and sends it to the Google Docs spreadsheet.
- ds18b20.py: The interface program for the temperature sensor. It contains a function called
GetTemperaturethat takes two parameters:Fahrenheitanddirectory. WhenFahrenheitis set toTrue, this function returns a temperature reading in Fahrenheit. WhenFahrenheitis set toFalse, it returns a Celsius reading. Thedirectoryparameter is the directory name of your DS18B20 that you recorded in the “Constructing the temperature sensor” and “Writing the software” sections, earlier in the chapter. - gdocs.py: Contains the functionality to authenticate with Google Docs. This was largely adapted from libraries developed by Guy Carpenter (
http://guy.carpenter.id.au/gaugette).
Before you run the temperature logger, you need to do some configuration. At the command prompt of your Raspberry Pi, perform the following steps:
$ nano templogger_gdocs.py
As shown in Figure 10-9, edit the following configurations:
ds18b20_dir: Enter the unique directory for your DS18B20 sensor that you took note of in the “Constructing the temperature sensor” section.-
client_id: Enter the client ID you obtained in the section “Step 1: Creating a client ID.” -
client_secret: Enter the client secret you obtained in the section “Step 1: Creating a client ID.” -
spreadsheet_key: Enter the spreadsheet key you obtained in the “Creating a new Google Docs spreadsheet” section. -
fahrenheit: Set this toFalseif you want a Celsius reading; otherwise, leave it set toTruefor a reading in Fahrenheit.

Figure 10-9: An example of the completed configurations.
Press Ctrl+X, press Y, and then press Enter to save. Now run the database logger from the command line using the following command:
$ python templogger_gdocs.py
You’re prompted to go to www.google.com/device
and enter a code that is displayed on the screen, as shown in Figure 10-10.
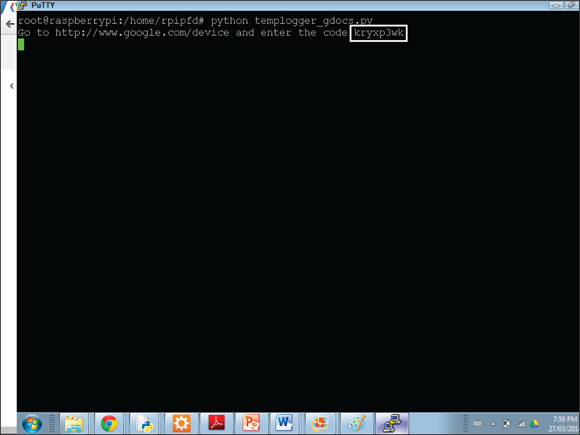
Figure 10-10: An authentication token has to be validated online before the Raspberry Pi is allowed accessed to Google Docs.
Step 3: Authenticating the token online
Open a web browser, go to www.google.com/device, and enter the code given to you on your Raspberry Pi, as shown in Figure 10-11. Click the Allow Access button. You should get the following message:
Success! You've authorized Project Default Service Account. Please return to your device to continue.

Figure 10-11: Validate your token from the Raspberry Pi online.
Return to your Raspberry Pi, which automatically resumes and starts logging temperature values to the spreadsheet. You see the temperature reading written to the screen on the Raspberry Pi as follows:
Temperature of 73.06F loggedTemperature of 73.06F loggedTemperature of 73.06F logged
Finally, open the spreadsheet and check that the temperature values are being recorded in the spreadsheet, as shown in Figure 10-12.

Figure 10-12: The Google Docs spreadsheet temperature log populated by the Raspberry Pi.
Creating a Dashboard and Temperature Alerts Using PrivateEyePi
In this section, you create an online temperature dashboard and define rules that will trigger email alerts to you based on the temperature reading. In this section, the Raspberry Pi sends temperature readings to PrivateEyePi, where you can view the temperature and a 24-hour graph on your dashboard. Additionally, each temperature reading is checked against a set of customizable rules that allow you to create temperature email alerts.
Follow these steps:
- Go to
www.privateeyepi.com, click the New User link, enter your details, and click the Update button. Click the GPIO menu option and click Add.
The screen shown in Figure 10-13 appears.
- Type 7 in the Number field, enter a description in the Description field, and click Update.
Click the Location menu option.
The screen shown in Figure 10-14 appears.
- In the Description field, enter a description of the location of the temperature sensor, and click Update.
Download the software that will poll the sensor and send the values to the PrivateEyePi web service.
If you completed the previous section, you can skip this step. Otherwise, type the following command at the Raspberry Pi command prompt:
cd /homegit clone git://github.com/gadjetnut/rpipfd.gitThe preceding commands download the software into the
/home/rpipfddirectory.Edit the
globals.pyfile in order to enter your username and password that you used earlier on the PrivateEyePi website.At the Raspberry Pi command prompt, type the following:
cd /home/rpipfdnano globals.pyAs shown in Figure 10-15, enter the user and the password in between the quotes. The user is the email address you used in the signup process from the PrivateEyePi website.
Page down until you see the
DallasSensorNumbersettings (see Figure 10-16). You need to set the GPIO number to 7 in between the brackets (for example,DallasSensorNumber(7)). Look forDallasSensorDirectoryand replace the numbers you see in the file with your own numbers (refer to the “Constructing the temperature sensor” section, earlier in this chapter), as shown in Figure 10-16. If you want your temperature to be displayed in Fahrenheit instead of Celsius, find the line that says Fahrenheit=Falseand change it toFahrenheit=True.- Press Ctrl+X, press Y, and then press Enter to exit.

Figure 10-13: Configure the GPIO port on the PrivateEyePi website.

Figure 10-14: Configure the location of the sensor.
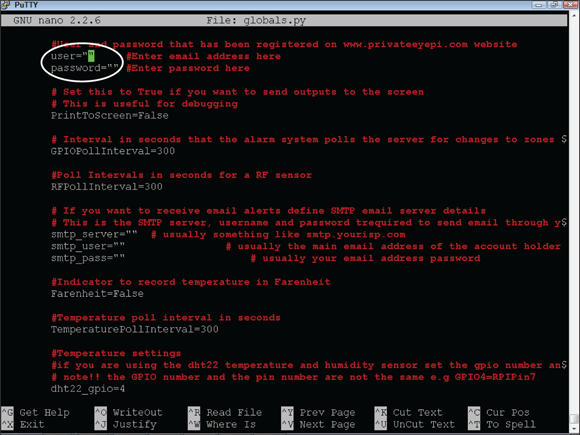
Figure 10-15: User and password for the Private EyePi website.
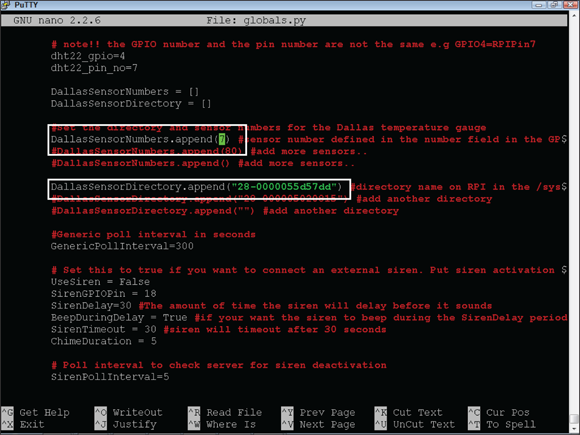
Figure 10-16: Configure your unique sensor number and sensor directory.
Now you’re ready to run the script and view the temperature on your PrivateEyePi dashboard display. At the Raspberry Pi command prompt, type the following:
cd /home/rpipfdpython templogger_pep.py
Using a web browser, go to www.privateyepi.com
and log in using your email and password. You’re directed to your dashboard, where you see your temperature displayed, as shown in Figure 10-17. You can switch on the graph by selecting Settings from the dashboard and then selecting the Config menu option.
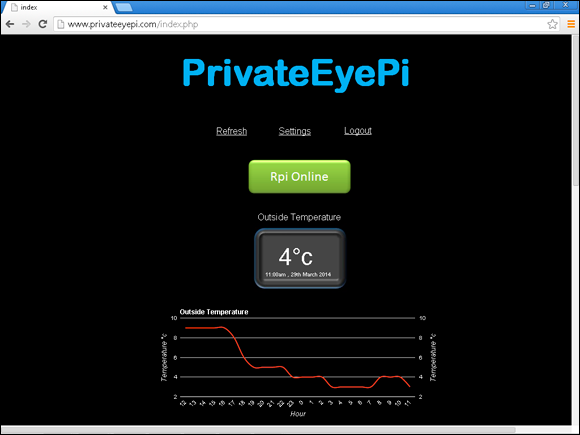
Figure 10-17: The PrivateEyePi temperature dashboard with graph.
You can create rules and actions for each of your sensors. This is useful for creating a temperature sensor alert if the temperature reaches a certain threshold or drops below a threshold. Follow these steps:
- From the dashboard, click Settings and then select the Rules option.
Click the Add button and configure a rule and action as shown in Figure 10-18 .
In this example, we configured a rule to send an email when the temperature reading on GPIO 4 is between 0 and –10. (Your email details need to be configured in the
globals.pyfile.)Alternatively, you could choose to send an email if the temperature reaches or exceeds 30°C, for example, which may be an indication of a fire or a problem with the heating system in your house.
You can define as many rules as you need and you can also combine up to three rules by clicking the AND drop-down box on the right side of the screen. For example, you may not want alerts during the day or you may want them only on specific days of the week.
PrivateEyePi also has alarm system functionality for the Raspberry Pi so you can configure alerts to be triggered only if the alarm is armed (refer to
www.projects.privateeyepi.comfor more details).
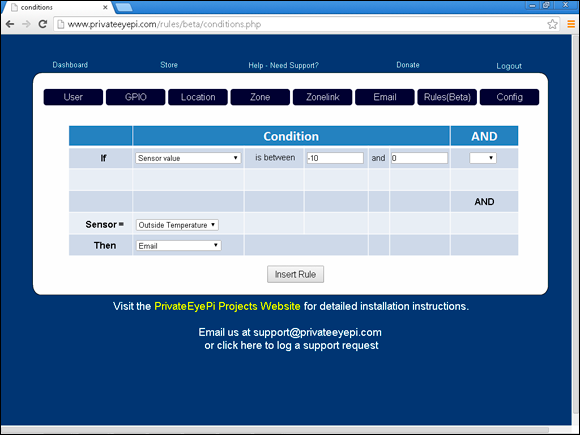
Figure 10-18: Define rules in PrivateEyePi.
For more details on how to configure PrivateEyePi rules and actions, visit www.projects.privateeyepi.com.
Creating a Database Logger
Logging data to the cloud is one way to log data, but you may want to take matters into your own hands and do it yourself. In the next section, you develop your own data-logging application and web page to display the data. You install a database and web server on your Raspberry Pi and write some code to log to the database and then some HTML and PHP code to view the data. Figure 10-19 shows how all the components fit together.
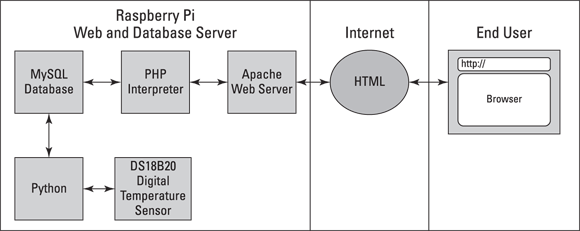
Figure 10-19: The interaction of the various components you build in this section.
In the next few sections, we cover topics about which entire books have been written. Our intent here is to provide you with the tools you need to further your knowledge in these areas. By following each of the upcoming sections, you end up with a working database-logging application. You can build on these basics by modifying the code to add new functionality.
 Use the Internet to search for more information. It’s a wonderful resource for developers seeking knowledge on how to solve problems or in need of reference material.
Understanding web servers and databases
A web server contains the content (text, pictures, links, tables, and so on) for a website. It sends the content to a web browser upon request from the web browser. The content can be static or dynamic. Static content on a web page does not change (like a book). Dynamic content changes automatically over time, and the content usually comes from a content management system (CMS) of sorts. An example of a website with dynamic content is a newspaper website that is continuously updated with new stories.
In this section, you create a dynamic webpage that displays the temperature and temperature log, as shown in Figure 10-20.
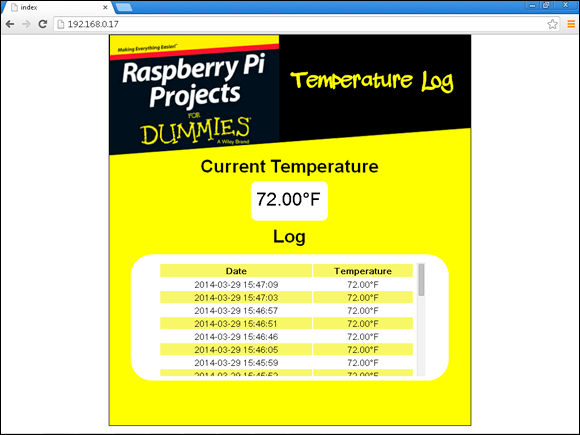
Figure 10-20: The web page you’ll build.
A database is used to store and query information (data). It’s capable of storing data and retrieving it at a rapid rate. In this section, we use a database to log the temperature sensor data and return the data to the web page, which displays the temperature data to the user (refer to Figure 10-20).
Explaining HTML and server-side scripting
A web page is served from the web server to the browser using Hypertext Markup Language, more commonly known as HTML. Your web browser interprets the HTML and displays it. The web browser interprets the HTML and translates it into graphics, text, links, and tables, but HTML is not a programming language — it’s a markup language. There are, however, programming languages that can run in the browser. JavaScript, for example, is a very popular development language that is inserted into the HTML code and executed in the browser.
Many books have been written on each of these topics, most of which are beyond the scope of this chapter, but here we share with you the fundamentals of each that provide you with a platform to further your database knowledge. Try to understand each line of code and experiment with your own modifications.
For this project, you retrieve data from a database and send it to the web browser as HTML. Programming languages that perform this function are called server-side languages because they reside and are executed on the web server (refer to Figure 10-19). There are a number of reasons why you want to perform this action on the server side and not on the client side (the browser). The most important reason is security. It’s incredibly risky to expose your data layer to the public Internet. Another reason to perform it on the server side is that you don’t know what’s running on the client side, so you can run into incompatibility issues with all the different operating systems, PCs, tablets, smartphones, and so on that use browsers. That’s why it’s good practice to keep the client side as simple as possible (using HTML) and do your database programming on the server side.
There are a number of server-side scripting languages you could use (for example, PHP, Perl, ASP, or JSP). You use Hypertext Preprocessor (PHP) in this project. From the browser, you call a PHP file the same way you call an HTML file, except it has a .php extension (for example, index.php instead of index.html). Figure 10-19 shows interaction between the browser, web and database servers, and PHP interpreter.
When a PHP file is requested, the web server passes the file to the PHP interpreter, which executes the PHP code and typically passes back HTML, which the web server sends back to the browser to display. In Listing 10-1, you can see an example of a PHP file that resides on the web server that displays either Hello world or I love Raspberry Pi, depending on the result of a random number. This demonstrates how PHP can create the dynamic web pages described earlier. Most of Listing 10-1
is normal HTML except the sections demarcated with <?php and ?> that mark the beginning and end of the PHP code. You don’t need to type this program in, but we’ve provided it to show you the difference between PHP and HTML. You code in PHP and HTML later in this chapter.
Listing 10-1: An Example of PHP Code That Resides on the Web Server
<!DOCTYPE html>
<html lang="en">
<head>
<title>An example PHP application</title>
</head>
<body>
<?php
random_number=rand(1,2);
if (random_number==1){
echo "Hello world";
}
else {
echo "I love Raspberry Pi";
}
?>
</body>
</html>
In Listing 10-2, you can see the HTML that was sent back to the browser. Notice that the PHP code is not present anymore. Only the result (that is, I love Raspberry Pi) was sent back to the browser. This is the basic principle of how server-side scripting works. You build on this principle later in this chapter when you use PHP to read and write to a database.
Listing 10-2: The HTML That Is Sent to the Web Browser
<!DOCTYPE html>
<html lang="en">
<head>
<title>An example PHP application</title>
</head>
<body>
I love Raspberry Pi
</body>
</html>
Delving into database basics
You store the data from the sensor in a database. Think of a database as a collection of lists of data. Each list is known as a table. Each table has a number of columns, and each line item in the list is called a row (refer to Figure 10-21).

Figure 10-21: A depiction of a temperature log database table with rows and columns.
A database can store and retrieve large amounts of data very quickly. In this section, you create a new table called TemperatureLog that contains the temperature values coming from the temperature sensor. In addition to the temperature value, you store other information, such as date, time, and unit of measure (Celsius or Fahrenheit). These data elements will be columns in the table. The fourth column is a unique identifier for every row called temp_id. It isn’t strictly required for this project, but it’s good practice to create a unique identifier, called the primary key, for each row. We configure temp_id to automatically increment every time a new row is inserted in the database.
The TemperatureLog table will have four columns: temp_id (primary key), temperature, date/time, and unit_of_measure. Date and time can be stored in the same column using the DateTime data type. Next, think about how you’ll manipulate the data. This helps you understand which columns need to be indexed. An index allows the database to find and sort data very quickly. The ability to sort the temperature log by date and time is important for reporting, so you’ll create an index on the date/time column. Lastly, think about how to describe the content of each of the columns (for example, alphanumeric, numeric, date/time, size, and so on). These are called data types.
Installing MySQL, PHP, and Apache
After you’ve done some basic database design planning, go ahead and create the table. You’ll be installing Apache (a very popular web server), MySQL (a database management system), and PHP (see the “Explaining HTML and server-side scripting” section, earlier in this chapter). All are open-source software and work very well on a Raspberry Pi.
You’ll be using the root user in this chapter so you don’t run into permission problems. Start off by logging into your Raspberry Pi as the root user. At the command prompt, type the following commands:
apt-get update
apt-get install apache2
apt-get install php5
apt-get install php5-mysql
apt-get install mysql-server mysql-client
apt-get install python-mysqldb
During the installation, you’ll be prompted to enter a password for the root user in MySQL.
Creating the data logger
Now you’re ready to create the temperature log table. At the Raspberry Pi command prompt, type the following:
$ mysql -u root -p
Enter the password you configured earlier during the installation. This will take you into the command-line interpreter of MySQL. Here you can issue SQL commands to MySQL. Standard Linux commands will no longer work when you’re in the MySQL interpreter. Type exit or quit to return to the Linux command prompt.
Next, create a new database by typing the following:
mysql> CREATE database sensor_logs;
Type in the USE command to tell MySQL that all subsequent commands will relate to the temperature_log table:
mysql> USE sensor_logs;
Next, create a user and password, which you use again later, and assign all privileges to that user.
We don’t recommend changing the username and password at this point because we refer to the user “dblogger” with a password of “password” and it’s also contained in the code. When you have it working, you can come back and change the password and edit the code with the new password, if you want.
Create the user and password as follows:
mysql> CREATE USER 'dblogger'@'localhost' IDENTIFIED BY 'password';
mysql> GRANT ALL PRIVILEGES ON sensor_logs.* TO 'dblogger'@'localhost';
mysql> FLUSH PRIVILEGES;
mysql> quit
Now log back in using the user you just created and create the new table:
mysql -u dblogger -p
mysql> USE sensor_logs;
mysql>CREATE TABLE temperature_log (temp_id INT NOT NULL AUTO_INCREMENT,
temperature DECIMAL(10,2), date DATETIME, unit_of_measure CHAR, PRIMARY
KEY (temp_id));
Check that the table was created successfully by typing the following:
mysql>SHOW TABLES;
As shown in Figure 10-22, you should see the new table listed in the database.

Figure 10-22: Results of a SHOW TABLES command.
Last, create an index on the Date column so that you can search and sort easily by date:
mysql>CREATE INDEX idx_date ON temperature_log(date);
Now make sure that you’re happy with the new table you’ve created (see Figure 10-23):
mysql>SHOW COLUMNS IN temperature_log;

Figure 10-23: Column view of the temperature_log table.
Log out of MySQL by typing quit.
If you made some mistakes and want to delete the table and start again, use the DROP statement:
mysql>DROP TABLE temperature_logs;
 Be very careful with this command because there is no option to undo it and you don’t get a warning message that all data in the table will be deleted.
Developing a sensor logger
The next step is to log data into the database from the temperature sensor you built earlier. You accomplish this by using Structured Query Language (SQL) syntax. SQL is made up of commands that closely resemble spoken language. Here are some examples of SQL statements. The following SQL statement will return the first name, surname (last name), and grade of all students with a surname of Evans:
SELECT firstname, surname, grade FROM student WHERE surname = "Evans"
The following SQL statement creates a new row of data in the student table:
INSERT INTO student (firstname, surname, grade) VALUES ("Jonathan",
"Evans", "A");
The following SQL statement changes the grade of all students that have a surname of Evans to B:
UPDATE student SET grade = "B" WHERE surname="Evans"
Notice the use of surname in the preceding WHERE clauses. Earlier in the chapter, we describe how to create an index to sort data and how to make searching data quicker. Surname would be an ideal candidate for an index. If surname were not indexed, the database engine would scan through the entire table looking for students with the surname of Evans. However, by creating an index on the surname column, the database engine will be able to sort through and pull out the relevant records much more quickly. However, don’t create an index on many columns because every index adds overhead to the performance of the table. This is why planning your database tables, fields, and indexes is important.
Your database logger application will use two SQL statements: an INSERT statement to log the data and a SELECT statement to retrieve the data that will be displayed on a web page.
You use a Python program called templogger_db.py to log the temperature readings to the database. If you didn’t download the chapter software earlier, you need to download the software using the following commands:
$ git clone git://github.com/gadjetnut/rpipfd.git
Edit the file and observe its contents by typing the following:
$ cd /home/rpipfd
$ nano templogger_db.py
Input the sensor directory name for your DS18B20 sensor (refer to the “Constructing the temperature sensor” section, earlier in this chapter), as shown in Figure 10-24.
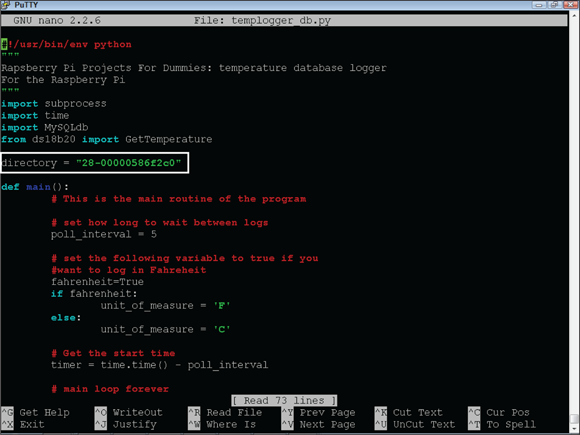
Figure 10-24: Configure your DS18B20 sensor number.
Page down in the code and observe how the program works. The program starts execution at def main(): by setting the poll interval to five seconds (poll_interval = 5). This means you store a temperature reading in the database every five seconds.
Next, you configure whether you want a Celsius or Fahrenheit temperature to be stored (fahrenheit=True or False). The program then goes into a loop that logs the temperature every five seconds. The program uses a function in the ds18b20.py program called GetTemperature that will run the modprobe application to obtain a reading from the sensor. If you’re interested in seeing how the sensor information is retrieved, edit ds18B20.py, which is in the same directory as templogger_db.py.
Next, the program logs temperature readings to the database using a sequence of database commands: connect, create cursor, insert, commit, and close. The MySQLdb.connect statement creates a new database connection, where you pass to it the IP address of the database server (localhost), the database user name (dblogger), the password (password), and the name of the database you want to open (sensor_logs).
Next, prepare a cursor object to execute the SQL statement, followed by execution of the statement. The commit statement writes the data to the database, and the close statement closes the database connection.
Exit and save by typing the following:
CTRL-x together, followed by pressing 'Y', then followed by pressing ENTER
Run the program:
$ python templogger_db.py
The program prints temperature readings to the screen and also writes those values into the database. After the program has logged a few readings, quit by pressing Ctrl+C. Go back into MySQL and view the data that has been logged by typing the following commands:
$ mysql -u dblogger -p (then type the password)
$ mysql> USE sensor_logs;
$ mysql> select * from temperature_log;
The rows that were inserted into the database will be listed in a table, as shown in Figure 10-25.
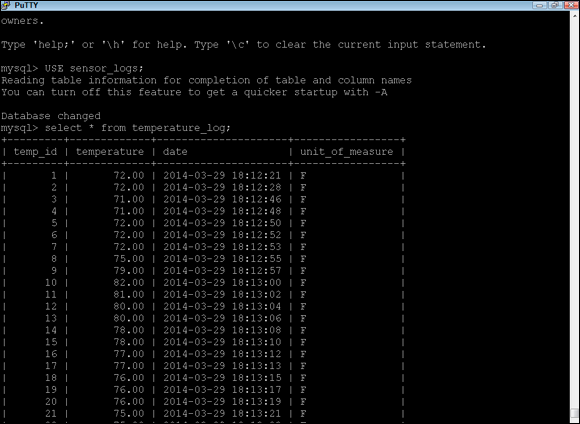
Figure 10-25: Temperature readings in the database.
Creating a dynamic web page
In this section, you create a web page that displays the temperature log you created in the previous section on a web page. In the “Installing MySQL, PHP, and Apache” section of this chapter, you install PHP and Apache. You use both in this section to create a web page to display your temperature readings. Check that the Apache installation worked. Open a browser either by typing startx and opening a browser on your Raspberry Pi, or by using another PC connected to your network, and type in the IP address of your Raspberry Pi as the URL.
You should see a web page that says It works!, as shown in Figure 10-26.

Figure 10-26: The default page displayed after you’ve installed Apache web server.
You can find the IP address of your Raspberry Pi by typing the following:
/sbin/ifconfig
The output will look something like this:
wlan0 Link encap:Ethernet HWaddr d8:eb:97:18:16:ef
inet addr: 192.168.0.2 Bcast:192.168.0.255 Mask:255.255.255.0
Your IP address is the number provided after inet addr:, which in this case is 192.168.0.2.
Now that you have your web server up and running, you work with the following two PHP files to retrieve and display the data on a web page:
-
dbreader.php: Contains two functions:DisplayTemperatureLogdisplays the temperature log, andDisplayTheLatestTemperaturedisplays the last temperature stored in the log. -
temptest.php: The second PHP file calls both of these functions and displays the data that the functions return on a web page.
Later in this section, you create a nicer-looking web page using HTML that reuses the dbreader.php, but be concerned with the functionality, not the look. PHP files need to be located in the web server’s directory (/var/www), so you need to copy both the files into that directory as follows:
$ cd /home/rpipfd
$ cp dbreader.php /var/www
$ cp temptest.php /var/www
Before you run these programs, edit them and observe their contents. At the command line, type the following:
$ cd /home/rpipfd
$ nano dbreader.php
Read through the PHP code and you see similarities to the Python code you used earlier to log temperature readings to the database. The syntax is very different, but the essence of the database commands is the same. A new connection to the database is made with the following statement:
$mysqli = new mysqli("localhost", "dblogger", "password", "sensor_logs");
Read the database using the following statement:
$res = $mysqli->query("SELECT * FROM temperature_log ORDER BY date
DESC");
The preceding SQL statement returns all the temperature readings and sorts them in descending order by date. This operation is very fast, even though the table may contain millions of rows. The reason for the high speed at which SQL can sort these rows goes back to the index you created on the Date column. The rest of the function loops through all the records until it reaches the num_rows_to_display value. The following section loops through the data:
for ($row_no = 0; $row_no < $res->num_rows/
&& $row_no < $num_rows_to_display; $row_no++)
{
echo "<tr>";
$res->data_seek($row_no);
$row = $res->fetch_assoc();
}
The echo statements send the HTML back to the web server and then on to the web browser to get displayed. Press Ctrl+X, press N, and press Enter to exit without saving.
Next, open the other PHP file that will call each of the two functions and display the data on the web page:
$ cd /home/rpipfd
$ nano temptest.php
The contents of this program are very simple. All this program does is call the two functions in dbreader.php and display the contents on the screen. Press Ctrl+X, press N, and press Enter to exit without saving.
Now return to the browser you used earlier and type the following URL:
where IPaddress is the IP address of your Raspberry Pi.
The latest temperature and a table containing the temperatures over the past calendar day will be displayed on the web page, as shown in Figure 10-27.
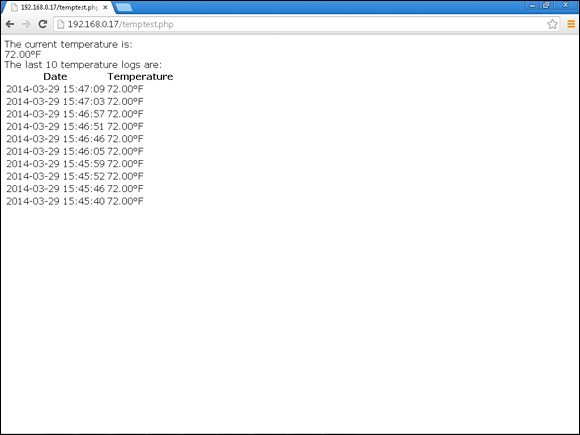
Figure 10-27: The raw data from the database log is displayed on a web page.
The data displayed in Figure 10-27 is accurate, but it doesn’t look very nice. Next, we use more sophisticated HTML in index.php to make look and feel more professional. index.php is the default file that the web server will look for when it receives a request from a web browser. For example, you only have to type http://ipaddress into your browser, and it will display this page.
Edit index.php and observe its contents. Look carefully for <?php and ?>, which demarcate the start end of the PHP code that the PHP interpreter will execute before sending the HTML back to the browser. At the beginning of the file, you can see that we’re including dbreader.php, which contains the two functions that are called later in the file in sections starting with <?php. To make the web page look better, we’ve included a background picture that is referred to on the line with the following code:
<img id="Ggeo18" src="RPIPFDTLBanner.png" alt="">
Unless you know how to code HTML, the content of the file isn’t easy to read and won’t make much sense to you. Other than knowing the HTML basics, you don’t need to know how to code HTML. Few people code HTML like you would code PHP or Python. This is because there are graphical tools that are much better suited to creating HTML than coding it in a code editor. The tool that we used to create index.php is called SiteSpinner Pro, but a number of other very good tools on the market will do the job.
Exit the file by pressing Ctrl+X, and pressing N to quit without saving. Copy index.php and the picture file to the web server as follows:
$ cd /home/rpipfd
$ rm /var/www/index.html
$ cp index.php /var/www
$ cp RPIPFDTLBanner.png /var/www
Now return to your browser and navigate to the IP address of your Raspberry Pi (http://ipaddress). You should see the final product, as shown in Figure 10-28.

Figure 10-28: The final temperature log web page.