
Automatic control of batch thermal processing of canned foods
R.J. Simpson, S.F. Almonacid and A.A. Teixeira, Universidad Técnica Federico Santa María, Chile and Centro Regional de Estudios en Alimentos Saludables (CREAS), Chile; University of Florida, USA
Abstract:
This chapter describes theoretical, practical and efficient strategies for on-line correction of thermal process deviations during retort sterilization of canned foods. It presents a review of recent developments over the past 10 years that have further advanced the state of the art in improving food safety, quality and manufacturing efficiency in the canned food industry worldwide. The focus is on retort control systems, and the various approaches that have been taken to help canned food processors accomplish on-line correction of unexpected process deviations, the major cause of lost productivity. Important features of each approach are discussed, along with suggested industry applications that would be appropriate for each method. The chapter concludes with a discussion of future trends to be expected in the industry.
18.1 Introduction1
Thermal processing is an important method of food preservation in the manufacture of shelf stable canned food. The basic function of a thermal process is to inactivate food spoilage microorganisms in sealed containers of food by using heat treatments at temperatures well above the ambient boiling point of water in pressurized steam retorts (autoclaves). Excessive heat treatment should be avoided because it is detrimental to food quality and underutilizes plant capacity. Food processing, and thermal processing in particular, is a strongly competitive global industry, driving continuous innovation and improvement of processing procedures and facilities.
Control of thermal process operations in food canning factories has consisted of maintaining specified operating conditions that have been predetermined from product and process heat penetration tests, such as the process calculations for the time and temperature of a batch cook. Sometimes unexpected changes can occur during the course of the process operation such that the pre-specified processing conditions are no longer valid or appropriate, and off-specification product is produced that must be either reprocessed or destroyed at appreciable economic loss. These types of situations are known as process deviations. Because of the strong emphasis placed on the public safety of canned foods, processors must operate in strict compliance with the US Food and Drug Administration’s Low-Acid Canned Food (FDA/LACF) regulations (Teixeira and Manson, 1982). Among other things, these regulations require strict documentation and record-keeping of all critical control points in the processing of each retort load or batch of canned product. Particular emphasis is placed on product batches that experience an unscheduled process deviation, such as when a drop in retort temperature occurs during the course of the process, which may result from unexpected loss of steam pressure. In such a case, the product will not have received the established scheduled process, and must be either fully reprocessed, destroyed, or set aside for evaluation by a competent processing authority. If the product is judged to be safe then batch records must contain documentation showing how that judgment was reached. If judged unsafe, then the product must be fully reprocessed or destroyed. Such practices are costly.
Commercial systems currently in use for on-line retort control accomplish on-line correction of process deviations by extending process time to that which would be needed had the entire process been carried out at the retort temperature reached at the lowest point in the deviation. In addition to the versatility and relative simplicity of this control strategy, it is also clear that it will always result in a safe correction, but is by no means optimal or efficient (Alonso et al., 1993; Simpson et al., 2007a).
18.2 On-line control strategies
On-line control strategies can be used for the correction of thermal process deviations during retort sterilization of canned foods based on mathematical models.
18.2.1 Mathematically modelled foods
Most mathematical models for the prediction of time-temperature histories in food products at a given point normally need to assume one of the basic modes of heat transfer. Two extreme cases have their own analytical solutions: (i) perfect mixing of a liquid (forced convection), and (ii) homogeneous solids (pure conduction). Most foods are an intermediate case, but these extreme cases have analytical solutions, then on-line control strategies can be designed for mathematically modeled foods.
A control strategy for on-line correction without a change in process time
The objective of this control strategy is to accomplish an on-line correction of an unexpected retort temperature deviation without changing the originally scheduled retort process time (see Fig. 18.1). Fundamental to the strategies presented in Sections 18.2.1 and 18.2.2 is the understanding that the retort control system would include a computer that is running the software containing the appropriate mathematical heat transfer model (most mathematical models for the prediction of timetemperatures histories in food products at a given point normally need to assume one of the basic modes of heat transfer) and that the computer continually reads the actual retort temperature from a temperature-sensing probe through an analogue/digital (A/D) data acquisition system. This continual reading of retort temperature would be used as real-time input of dynamic boundary conditions for the mathematical heat transfer model. The model, in turn, would be accurately predicting the internal product cold spot temperature profile as it develops in response to the actual dynamic boundary condition (retort temperature), just as described by Datta et al. (1986). As the predicted cold spot temperature profile develops over time, the accumulating lethality (Fo) would be calculated by the General Method and known at any time during the process. Should a deviation occur during the process a simulated search routine would be carried out on the computer to find the combination of process conditions for the remainder of the process that would result in meeting the final target lethality without overextending processing time.
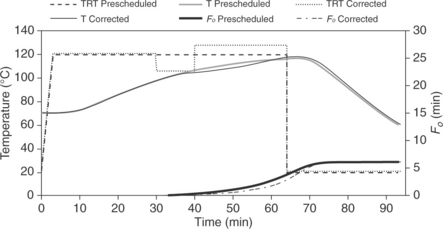
Fig. 18.1 Pure conduction simulation for on-line correction of an unexpected retort temperature deviation occurring approximately midway into the scheduled process for a cylindrical can of conduction-heated food Fo, accumulating lethality.
The key in this strategy is to identify the retort temperature as the control variable to be manipulated during the remainder of the process (rather than process time). Therefore, upon recovery of the deviation, the search routine would find the new higher retort temperature to be used for the remainder of the process, and send the appropriate signals through the data acquisition system to readjust the retort temperature accordingly. This entire procedure would be triggered whenever retort temperature falls below that specified in the FDA process registration file.
Increasing retort temperature cannot be accomplished without increasing steam pressure correspondingly, which dictates a practical upper limit to choice of higher retort temperature. An upper limit of 135 °C was chosen for the simulations carried out in this work. This upper limit comes into play when the deviation occurs near the end of the process, when the little time remaining forces the simulation search routine to choose the upper limit for retort temperature. In these cases, the safety requirement for reaching the final target lethality (Fo) must take priority overcompromising process time. This will inevitably require some extension in process time, but it will be an absolute minimum, that would not be likely to upset scheduling routines. Examples of this control strategy being applied for correcting deviations in the process (both early and late), were simulated for the case of thermal processes typical of still-cook conduction heating in a cylindrical can or retort pouch, and forced convection heating in a cylindrical can under mechanical agitation (Simpson et al., 2006).
A control strategy for on-line correction of variable retort temperature process without compromising quality
The objective of this control strategy was to accomplish an on-line correction of an unexpected retort temperature deviation while maximizing the final quality retention in the product, and to demonstrate the application of this strategy to dynamic (time-varying) retort temperature processes (see Figs 18.2 and 18.3). This strategy is meant to apply to those retort processes that were designed specifically for retaining maximum quality, such as nutrient retention, in the product. Canned foods in this category are usually slow conduction-heating products in relatively large containers in which significant non-uniform temperature distributions exist throughout the thermal retort process. These non-uniform temperature distributions provide opportunity to improve levels of quality retention by use of dynamic or time-variable retort temperature processes over traditional constant retort temperature processes. Results from process optimization studies have shown that most optimum retort temperature profiles for this purpose involve a ramp increase to a maximum retort temperature followed by a ramp decrease to a minimum prior to cooling (Teixeira et al., 1975; Saguy and Karel, 1979). For these types of products the heat transfer model must also be able to accurately calculate the quality degradation caused by the thermal process. The thermal degradation kinetics of most quality factors are such that these calculations are very sensitive to the non-uniform temperature distribution in such conduction-heated foods. Therefore, the conduction heat transfer models to be used for this purpose must be shape-specific for the shape of product container to be simulated. This is not necessarily the case when only lethality at the cold spot is of concern.
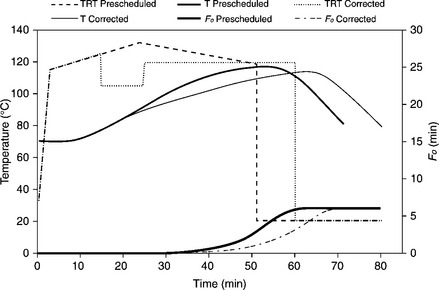
Fig. 18.2 Dynamic process simulation for on-line correction of an unexpected retort temperature deviation occurring during the ramp-up portion of the scheduled dynamic retort process, for a cylindrical can of conduction-heated food.

Fig. 18.3 Dynamic process simulation for on-line correction of an unexpected retort temperature deviation occurring during the ramp-down portion of the scheduled dynamic retort process, for a cylindrical can of conduction-heated food.
The focus at this point is on use of the model’s ability to calculate volumeintegrated mass-average nutrient retention (as described by Teixeira et al., 1969) in response to time-varying boundary conditions (variable retort temperature). In the case of an unexpected retort temperature deviation occurring during the preprogrammed ramp-up or ramp-down of a variable retort temperature process the strategy would call for completing the process after recovery of the deviation at the optimum constant retort temperature-process time combination that would maximize final nutrient retention. Just as in the previous case in Section 18.2.1 the deviation would trigger a simulation search routine of finding a family of remaining retort temperature–time combinations that would deliver the same final target lethality, and choosing the one that yielded maximum nutrient retention. Examples of this control strategy being applied for correcting deviations in the process (during rampup and ramp-down), have been simulated for the case of a thermal process typical of a still-cook conduction-heating product in a cylindrical can (Simpson et al., 2006).
18.2.2 A control strategy for on-line correction of retort temperature with minimum extended process time at the recovered retort temperature
The objective here is to develop a strategy to correct the process deviation by an alternative ‘proportional-corrected’ process that delivers no less than final target lethality, but with near minimum extended process time at the recovered retort temperature. In addition, the strategy performance is demonstrated by comparing ‘proportional-corrected’ with ‘commercial-corrected’ and ‘exact-corrected’ process times. Finally, the aim is to demonstrate consistent safety of the strategy by exhaustive searches over an extensive domain of product and process conditions to find a case in which safety is compromised (Simpson et al., 2007b).
Proportional correction strategy development
The objective of this strategy is to accomplish on-line correction of an unexpected retort temperature deviation by an alternative process that delivers final target lethality, but with minimum extended process time (Fig. 18.4) at the recovered retort temperature. This would be accomplished with use of the same alternative process ‘look-up tables’ that would normally be used with currently accepted methods of online correction of process deviations, but with a ‘proportional correction’ applied to the alternative process time that would reduce it to a minimum without compromising safety. In order to fully understand this strategy, it will be helpful to first review the currently accepted method that is in common practice throughout the industry. Commercial systems currently in use for on-line correction of process deviations do so by extending the process time to that which would be needed to deliver the same final lethality had the entire process been carried out with an alternative lower constant retort temperature equal to that reached at the lowest point in the deviation. These alternative retort temperature–time combinations that deliver the same final process lethality (Fo) are called equivalent lethality processes. When these equivalent time–temperature combinations are plotted on a graph of process time versus retort temperature, they fall along a smooth curve called an equivalent lethality curve. These curves are predetermined for each product from heat penetration tests and thermal process calculations carried out for different retort temperatures.
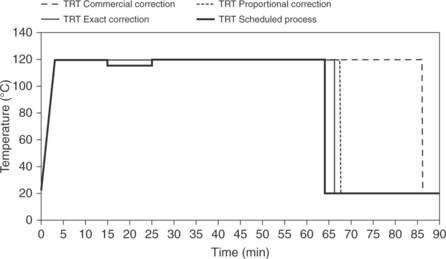
Fig. 18.4 Pure conduction simulation for on-line correction of an unexpected retort temperature deviation occurring early in the scheduled process for a cylindrical can of solid food under still-cook.
In practice, the new process times obtained from these curves at such low alternative temperatures can be as much as two or three times longer than the originally scheduled process time required to reach the same final target lethality, resulting in considerable quality deterioration and costly disruption to scheduled retort operations. Nonetheless, these systems are versatile because they are applicable to any kind of food under any size, type or container shape, as well as mode of heat transfer (Larkin, 2002). These consequences are particularly painful when, as in most cases the deviation recovers quickly, and the alternative extended process time is carried out at the recovered original retort temperature. Canned food products subjected to such ‘corrected’ processes become severely overprocessed, with final lethalities far in excess of that required and quality deterioration often reaching levels below consumer acceptance (a safe correction, but by no means optimal or efficient – Alonso et al., 1993; Simpson et al., 2007a). To avoid these corrections, processors normally operate at retort temperatures 3–4 °C over the registered retort temperature.
The ‘proportional correction’ strategy presented in this section significantly avoids such excessive overprocessing by taking advantage of the short duration of most recovered retort temperature deviations, and the lethality delivered by carrying out the corrected process at the recovered retort temperature. The strategy will calculate the corrected process time (tD) as a function of the temperature drop experienced during the deviation, but also takes into account the time duration of the deviation. The following expression illustrates mathematically how this ‘proportional corrected’ process time would be calculated for any number (n) of deviations occurring throughout the course of a single process:
where n, number of deviations occurring during the process; tD, corrected process time; tTRT, pre-established process time at retort temperature TRT; Δti, duration of deviation i; tDi, process time at the deviation temperature TRTi; TRTi, lowest temperature during the deviation i; TRT, retort temperature.
For example, in the case of a single deviation, the corrected process time would be calculated by first finding the alternative process time that would be required to deliver the same final lethality had the entire process been carried out with an alternative lower constant retort temperature equal to that reached at the lowest point in the deviation (tD). This would be done by use of the equivalent lethality process curve or look-up table described earlier. The difference between this longer alternative process time and the originally scheduled process time (tD − tTRT) is the extra time that would normally be added to the original process time to correct the process according to current industry practice. However, in the new strategy proposed here, this extra process time differential (tD − tTRT) is multiplied by a proportionality factor consisting of the ratio of the time duration of the deviation to the originally scheduled process time (Δt/tTRT). This proportionality factor is always less than or equal to 1, and always results in a corrected process that delivers no less than the final target lethality specified for the original process, but with near minimum extended process time.
The logic behind this ‘proportional correction’ strategy stems from the following rationale:
• The current industry practice is necessary only when the deviation fails to recover, and retort temperature remains at the lowest point for the duration of the process.
• This practice is unnecessary when the deviation recovers, and processing resumes at the original scheduled retort temperature over the ‘corrected’ extended time.
• If the extended process time is chosen to be in proportion to the duration of the deviation as a fraction of original scheduled process time, we are making the assumption that the amount of lethality lost during the deviation duration time is the amount that would have accumulated at retort temperature.
• In reality, this amount of lost lethality is much less, since the actual retort temperature had fallen during the deviation to some lower level where lethality would still continue to accumulate, only at a slower rate.
• Therefore, the ‘proportional correction’ should always deliver total final lethality greater than that originally specified for the scheduled process.
• With the implementation of this novel and efficient on-line strategy it will be unnecessary for processors to operate at higher retort temperatures.
18.2.3 On-line correction of process deviations without extending process time and without computer simulation software
This section describes a method derived from the ‘proportional corrected process’ method of Simpson et al. (2007a) for accomplishing the same objective without the need of any computer simulation software (Simpson et al., 2007c). What is needed instead is a look-up table or curve on a graph showing alternative retort temperature–time combinations that were predetermined to deliver the same target lethality (iso-lethality curves) for each product. Normally, these are generated from heat penetration test data, and stored in a file for immediate access when needed. In this application the strategy involves finding the new retort temperature to which the retort must be elevated for the process time remaining or at a minimum for a time period equal to the duration of the deviation. This temperature will be obtained from the iso-lethality process curve or look-up table of equivalent processes, once the equivalent process time associated with this temperature is determined. Mathematically, this equivalent process time can be calculated from the anatomy of the recovered process deviation and original process conditions as follows:
where tH is the equivalent process time at required higher temperature, tTRT is the original scheduled process time, tD is the equivalent process time at the lower deviation temperature.
Derivation of Equation [18.2] stems from the ‘proportional corrected process’ method of Simpson et al. (2007a) by considering the fact that the lethality lost during an unexpected time period of lower than normal retort temperature (process deviation) can be recovered later in the process by an equal time period at a higher than normal retort temperature. Consider a process in which two deviations occur in sequence. The normal retort temperature is TRT, the first deviation occurs over a time interval Δt at lower than normal retort temperature TRTD and the second occurs later over an equal time interval Δt at a higher than normal retort temperature TRTH. If a ‘proportional corrected process’ is applied to each one of the deviations as described in Simpson et al. (2007a), the mathematical expressions for each correction will be as follows:
where Δt is the duration time of the process deviation, tTRT is the originally scheduled process time at the original scheduled retort temperature, TRT, tH is the equivalent process time for same lethality at the higher retort temperature, TRTH, tD is the equivalent process time for same lethality at the lower deviation temperature, TRTD.
If we assumed now that TRTH is selected so both corrections are equivalent, we can equate both terms:
Experimental validation: case study
The utility of this approach to on-line correction of process deviations was demonstrated experimentally as a means of preliminary validation (Simpson et al., 2007c) (see Fig. 18.5). Cylindrical cans (0.075 m diameter, 0.113 m height) containing a commercially prepared food product (Centauri Ravioli, 350 g) were thermally processed in a vertical still-cook retort under saturated steam with maximum working pressure of 40 psig (377.1 kPa) at 140 °C (Loveless, Model 177). Both retort temperature and internal product cold spot temperature were monitored with K-type thermocouples, and recorded with an Omega 220 data logger and modem with COM1 connection port. Cans were processed under different combinations of retort temperature and process time, with the temperatures recorded every 2 s. Each normal process was defined with come-up-time (CUT) of 7 min, during which the retort temperature increased linearly, followed by a period of constant retort temperature and a cooling cycle. Deviations during the process were deliberately created by manually shutting off the steam supply to the retort control system. Experiments were carried out in the Food Laboratory pilot plant of the Universidad Técnica Federico Santa Maria in Valparaiso, Chile.
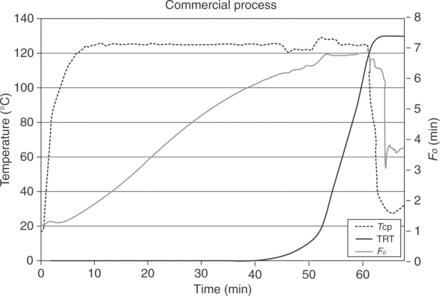
Fig. 18.5 Profiles of retort (TRT) and internal product cold spot temperatures (Tcp) over time (scale on left), along with profile of accumulated lethality over time (scale on right) from a heat penetration test with ravioli in cans (0.075 m diameter, 0.113 m height) experiencing perpetrated process deviation immediately followed by temporary high retort temperature correction (calculated on-line).
In order to construct a iso-lethality curve it is necessary to use the data obtained from heat penetration tests conducted at well-controlled constant retort temperature, from which the process time needed to achieve a specified target lethality at any given retort temperature can be calculated. Therefore, using data from the constant-temperature heat penetration tests carried out in this study, an equivalent process lethality curve (for a target lethality of Fo = 6 min) was constructed for the commercial ravioli product and can size used in this study, and is shown in Fig. 18.6.

Fig. 18.6 Iso-lethality curve showing equivalent combinations of process time and retort temperature that achieve the same process lethality (Fo = 6 min) for ravioli packed in cylindrical cans (0.075 m diameter, 0.113 m height).
In order to validate the safety assurance of this on-line control strategy, a number of heat penetration experiments were carried out in which process deviations were deliberately perpetrated by manual shut-off of the steam supply to the retort, causing the retort temperature and pressure to fall to a lower level for several minutes, after which the steam supply valve was reopened and the deviation quickly recovered. As soon as the complete anatomy of the deviation was known upon recovery, Equation [18.2] was used to calculate the high temperature equivalent process time (tHi), from which to obtain the higher retort temperature (TRTH) needed to accomplish the correction, using the iso-lethality curve in Fig. 18.6 The retort controller set point was immediately adjusted upward to the correction temperature (TRTH), and brought back down to the originally scheduled retort temperature after an elapsed time equal to the duration of the initial perpetrated deviation. The process was then allowed to proceed normally for the duration of the remaining originally scheduled process time. During each test, retort and internal product cold spot temperatures were continually measured and recorded, and accumulated lethality (Fo) was calculated as a function of cold spot temperature over time using the General Method (assuming a z-value of 10 °C). Results from a typical test run are presented in Fig. 18.5, with the process conditions and parameters used for the test listed in Table 18.1.
Table 18.1
Process conditions and parameters used for heat penetration test with ravioli packed in cylindrical cans (0.075 m diameter, 0.113 m height) producing results shown in Fig. 18.2
| Process parameters (units) | Value chosen for heat penetration test |
| Reference temperature (°C) | 121.1 |
| Scheduled process time (min) | 61 |
| Low temperature at deviation (°C) | 122 |
| Initial internal product temperature (°C) | 19 |
| Time duration of deviation, Δ (min) | 5.5 |
| Target process lethality, Fo (min) | 8 |
| Microbial temperature factor, z (°C) | 10 |
| Scheduled retort temperature (°C) | 125 |
Both temperature and lethality are shown as functions of time on Fig. 18.5, with the temperature scale shown along the left side vertical axis, and the lethality (Fo) scale shown along the right side vertical axis. In the case of this test, the target value for process lethality (Fo) was 8 min and the normal scheduled retort temperature was intended to be 125 °C for a scheduled process time of 61 min. The deviation was deliberately initiated after approximately 45 min into the process, and held for 5.5 min, during which time the retort temperature fell to 122 °C. Upon recovery from the deviation, the retort temperature was elevated to approximately 128 °C (determined from the calculation procedure described above) for five more minutes, and returned to the originally scheduled 125 °C for the remainder of the scheduled 61 min process time.
The measured retort temperature profile (TRT) can be seen in Fig. 18.5, clearly revealing the profile of the deviation immediately followed by the high temperature correction process and return to normal, with the cooling cycle beginning right on schedule at the originally appointed process time of 61 min. The measured internal product cold spot temperature curve (Tcp) in Fig. 18.5 reflects the expected erratic response to the combined deviation and correction perturbations experienced by the dynamic retort temperature. Most importantly, in spite of the erratic profile of the internal product cold spot temperature, the final accumulated lethality (Fo), calculated as a function of this profile by the General Method, still reached the target value of 8 min specified for the process.
18.3 Validation of computer-based control systems
In a review by Teixeira and Tucker, (1997), the state of the art in retort control strategies at that time was aimed primarily at new and better ways to achieve and maintain constant the retort temperatures specified for a scheduled process time, in the hopes of minimizing the chance occurrence of unexpected process deviations. Focus was placed on replacing traditional hard-wired relay-logic systems with new electronic programmable controllers capable of communicating directly with new computer-based control systems. Since then, the food processing industry has begun to rely increasingly on computer-based process control systems that rely heavily upon sophisticated software containing intricate programming codes developed by software engineers. The complexity and sophistication of these systems bring with them the potential for hidden errors and pitfalls ‘bugs,’ which could lead to serious problems if commissioned for use prior to proper validation.
Government regulatory agencies responsible for assuring food safety for the consuming public have quickly come to recognize to need for such validation, and have been addressing this issue aggressively by working closely with industry in developing and proposing methods and procedures for carrying out documented validation of new computer-based control systems. Leading scientists from the US Food and Drug Administration (FDA) have often been invited to speak on this topic at major conferences, and are an excellent source for information on the approach to validation (Larkin, 2004). Another useful source of information is the work of McGrath et al. (1998), who described appropriate software and hardware tools that provide a powerful yet flexible platform from which to implement a process control strategy for the food processing industry.
At the heart of validating any process control system is the need to know precisely what needs to be controlled. This extends far beyond the simplistic view of controlling equipment operating parameters. For example, it does little good to assure the retort temperature was held constant at the level specified for the scheduled process, if something went wrong during product preparation that caused the product to heat differently from how it was expected to heat. Identifying all the factors that must be controlled in order for a scheduled process to be assured effective is an important part of the approach to Hazard Analysis and Critical Control Points (HACCP) studies.
These, in turn, are an important component of process and control system validation. Approaches to validation of thermal process control involving verification by the HACCP system were described well by Leaper and Richardson (1999). In that work they placed due emphasis on new approaches aimed at assuring safety without undue overprocessing, which would have a negative impact in the marketplace because of compromised product quality and manufacturing efficiency. Chen and Ramaswamy (2003) conducted an extensive analysis of critical control points affecting deviations in thermal processing using artificial neural networks. They conducted an analysis of different critical process and product variables with respect to their importance on accumulated lethality, process time, cooling time, and total cycle time under various process conditions; along with the combined effects of deviations happening to multiple variables at the same time.
These are only examples of the growing attention being paid to the need for process validation and its documentation in connection with the adoption of new computer-based control systems in the food process industry, and the food canning industry in particular. The importance of process validation cannot be overemphasized, and for this reason, it was chosen as a topic to be addressed in this chapter.
18.4 Industrial automation of batch retorts
Many of the most recent advances made in the design of industrial batch retorts has come about in response to the increasing popularity of flexible retort pouches and retortable semi-rigid microwavable plastic dinner trays and lunch bowls. These flexible and semi-rigid containers lack the strength of traditional metal cans and glass jars to withstand the large pressure differences experienced across the container during normal retort operations. To safely process these types of flexible packages, careful control of overriding air pressure is needed during retort processing, and pure saturated steam, alone, cannot be used as the heat exchange medium. Instead, new retorts designed to be used with pressure-controlled steamair mixtures, water spray, or water cascade have been recently developed for this purpose (Blattner, 2004). Examples of some of these new retort designs are given in Fig. 18.7. A close-up view of some of the specially designed racking configurations used to hold flexible retortable packages in place during retorting is shown in Fig. 18.8.

Fig. 18.7 New retort systems (rotating and still-cook) with specially designed racking configurations for processing flexible and semi-rigid packages. (Source: Courtesy of ALLPAX, Covington, LA.)
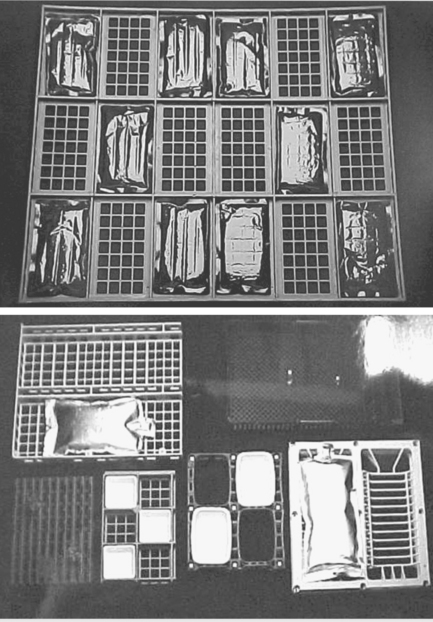
Fig. 18.8 Rack designs for flexible and semi-rigid retortable packaging systems. (Source: Courtesy, ALLPAX, Covington, LA.)
Perhaps the most significant advances made in the food canning industry to date have been in the area of automated materials handling systems for loading and unloading batch retorts. Traditionally, the loading and unloading of batch retorts has been the most labor-intensive component in food canning factories. Unprocessed sealed containers would be manually stacked into baskets, crates or carts. Then, the baskets or crates would be loaded into empty vertical retorts with the aid of a chain hoist, or wheeled carts would be loaded into horizontal retorts with the aid of track rails. In recent years leading manufacturers of retort systems have been hard at work designing and offering a host of new automated materials handling systems to automate this retort loading and unloading operation.
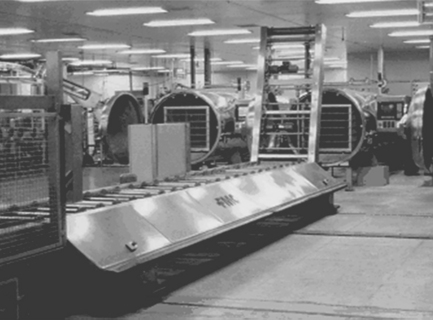
Most of the new automated systems available to date are based on the use of either automated guided vehicles (Heyliger, 2004), or orthogonal direction shuttle systems (Blattner, 2004; Heyliger, 2004). Both types of systems are designed for use with horizontal retorts. The automated guided vehicles (AGV) work like robots. They carry the loaded crates of unprocessed product from the loading station to any designated retort on the cook room floor that is ready to be loaded. They also carry the loaded crates of finished processed product from the unloaded retort to the unloading station for discharge as out-going product exiting the cook room to the case packing operations. These robotic AGV’s are designed to integrate with the loading station in such a way that sealed product containers arriving on a conveyor automatically stack into the crate carried by the AGV, which later inserts the entire crate into the designated retort. Unloading at the unloading station for finished product discharge is likewise accomplished in a similar automated way, but in reverse. The AGVs are guided by an underground wire tracking system buried beneath the cook room floor. This leaves the cook room floor space open and free of any rail tracks or guide rails that would otherwise impede the safe movement of factory workers in their normal work flow operations. A panoramic view of a large cook room operation using an automated batch retort system with AGV is shown in Fig. 18.9 (Heyliger, 2004), and a close-up view of an automated guided vehicle in the process of loading or unloading a horizontal retort is shown in Fig. 18.10.

Fig. 18.9 Automated batch retort system with use of AGVs in large cook room operation. (Source: Courtesy, FMC Food Tech., Madera, CA.)

Fig. 18.10 Automated guided vehicle for batch retort loading/unloading. (Source: Courtesy, FMC Food Tech., Madera, CA.)
An alternative to the AGV system is the shuttle system offered by several retort manufacturers. Unlike the AGV system, the shuttle system relies upon a set of tracks or rails that are fixed in place on the cook room floor. These rails span the length of the cook room along the row of horizontal retorts, allowing a shuttle carrying loaded crates to slide along these rails until it has aligned itself in front of the designated retort waiting to be loaded. In a similar fashion, when a retort is ready for unloading, an empty shuttle slides along these rails until it has aligned itself with that retort to receive the loaded crates of processed product. Then the shuttle slides along the rails to the far end of the cook room where unloading of processed product takes place for discharge out of the cook room. Normally, the unprocessed product loading station and the processed product unloading stations are located at opposite ends of the cook room (Fig. 18.11). Figures 18.12 and 18.13 illustrate the shuttle systems offered by ALLPAX and FMC, respectively.


18.5 Advances in research and future trends
If the food canning industry is to continue to remain competitive in an ever-expanding global market, technological advances will be needed to increase productivity, achieve better product quality with enhanced safety assurance, and all at lower and lower cost; this means that advances in automation and intelligent on-line control will inevitably continue at a rapid pace. New developments that are likely to occur soonest will be the application of computer-based retort control systems for on-line correction of process deviations. These developments are likely to occur first in relatively small canneries with labor-intensive batch retort operations located in developing countries. These are the companies with the greatest need and that are most receptive to adopting new technology appropriate to their level of processing operations.
Very simple systems are now under development intended for this market. These systems will consist only of a microcontroller equipped with software containing the mathematical heat transfer models described in this chapter. These lap top computers will communicate with commercially available data acquisition modules (data loggers), and serve as traditional data acquisition systems, but with a twist. The data logger will be continuously reading the retort temperature, and sending this information to the lap top computer. From these data and with the mathematical heat transfer model, the computer will be continuously calculating the increasing internal cold spot temperature and associated accomplished lethality, and comparing this accomplished lethality with the specified target value for the process. When calculated accomplished lethality reaches the specified target value, the lap top computer will signal the operator to take the necessary action to end heating, and commence cooling. These systems will involve no computer-controlled actuators to automatically shut off or turn on valves. Instead the operator will be expected to be watching the monitor as the process is under way, and operate the retort as always (‘opto-digital’ control). The operator will simply wait until the computer indicates when to turn off the steam, rather than doing so when indicated by a stop watch.
In the area of materials handling automation, the industry may witness a move to more and more sophisticated robotics that may ultimately replace the shuttle systems and AGVs that have become the state of the art today.
18.6 References
Alonso, A., Banga, J., Perez-Martin, R. A new strategy for the control of pressure during the cooling stage of the sterilization process in steam retorts. Part I A preliminary study. Food and Bioproducts Processing, Trans IchemE. 71, 1993.
Blattner, M.F., Advances in automated retort control, and today’s new packaging, 2004. [Presentation at IFT Symposium, 2004 IFT Meeting, Las Vegas, NV.].
Chen, C.R., Ramaswamy, H.S. Analysis of critical control points in deviant thermal processes using artificial neural networks. Journal of Food Engineering. 2003; 57:225–235.
Datta, A.K., Teixeira, A.A., Manson, J.E. Computer-based retort control logic for on-line correction of process deviations. Journal of Food Science. 1986; 51:507.
Heyliger, T.L., Advances in retort control for batch and continuous systems, 2004. [Presentation at IFT Symposium, 2004 IFT Meeting, Las Vegas, NV.].
Leaper, S., Richardson, P. Validation of thermal process control for the assurance of food safety. Food Control. 1999; 10:281–283.
Larkin, Personal Communication. Branch Chief, National Center for Food Safety and Technology, Food and Drug Administration (FDA/NCFST), Chicago, IL, USA., 2002.
Larkin, J.W., Validation of software-driven control systems, 2004. [Symposium presentation at 2004 Annual IFT Meeting, July 17–21 2004, Las Vegas, NV.].
McGrath, M.J., O’Connor, J.F., Cummins, S. Implementing a process control strategy for the food processing industry. Journal of Food Engineering. 1998; 35:313–321.
Saguy, I., Karel, M. Optimal retort temperature profile for optimizing thiamine retention in conduction-type heating canned foods. Journal of Food Science. 1979; 44:1485–1490.
Simpson, R., Figueroa, I., Teixeira, A. Simple, practical, and efficient on-line correction of process deviations: Batch retorts operations. Food Control. 2007; 18(5):458–465.
Simpson, R., Teixeira, A., Almonacid, S. Advances with intelligent on-line retort control and automation in thermal processing of canned foods. Food Control. 2007; 18(7):821–833.
Simpson, R., Figueroa, I., Teixeira, A. Preliminary validation of on line correction of process deviations without extending process time in batch retorting: Any canned foods. Food Control. 2007; 18(8):983–987.
Simpson, R., Figueroa, I., Teixeira, A. Optimum on-line correction of process deviations in batch retorts through simulation. Food Control. 2006; 17(8):665–675.
Teixeira, A.A., Manson, J.E. Computer control of batch retort operations with on-line correction of process deviations. Food Technology. 1982; 36(4):85–90.
Teixeira, A.A., Tucker, G.S. On-line retorts control in thermal sterilization of canned foods. Food Control. 1997; 8(1):13–20.
Teixeira, A., Dixon, J., Zahradnik, J., Zinsmeiter, G. Computer optimization of nutrient retention in the thermal processing of conduction-heated foods. Food Technology. 1969; 23(6):845–850.
Teixeira, A.A., Zinsmeister, G.E., Zahradnik, J.W. Computer simulation of variable retort control and container geometry as a possible means of improving thiamine retention in thermally-processed foods. Journal of Food Science. 1975; 40(3):656–659.
1.Section 18.2.1 is reprinted from Simpson et al. (2007b); Section 18.2.2 is reprinted from Simpson et al. (2007a); Section 18.2.3 is reprinted from Simpson et al. (2007c); Section 18.3 is reprinted from Simpson et al. (2006). All material is reprinted with permission from Elsevier.