
Chapter 6. Web Stats Monitoring
Analyzing your website stats is at the core of your SEO work. Although Google Analytics, which we will cover in Chapter 7, may be an appealing choice for online marketers, it is based on JavaScript, which means that only web pages are tracked when using the out-of-the-box configuration. Any clients with disabled JavaScript will also be missed, as will any pages with the missing Google Analytics code.
As such, more often than not marketing departments will need to ask their IT folks to produce web stats reports based on web server logs because they cannot get the information they need from Google Analytics.
This chapter opens with a discussion of web server logs, with a focus on the NCSA log formats. Next, we’ll turn our attention to three popular web stats tools: the relatively inexpensive WebLog Expert, as well as two free tools, AWStats and Webalizer.
Web Server Logs and Formats
Each time visitors come to your website, the web server hosting your files records this activity. A web hit is a single file request from your website. Typically, when you browse to a web page, chances are you will see text, graphics, animations, and/or videos as part of the page.
It is likely that most of the nontext elements are stored in separate files. Although all you did was type a single URL, the web browser has placed multiple requests to create or render the page. In doing so, it has effectively created multiple web hits on your behalf.
Each website hit is recorded on its own line within a logfile. So, if you have 1 million hits for a particular day, your logfile will be 1 million lines long. Along with your regular visitors, you will also have visits by search engine spiders, including those operated by Google, Microsoft, and Yahoo!. The more popular your website is, the bigger your web server logfiles will be.
If you are hosting your website on a shared hosting provider, some sort of web stats or analytics tool is usually included in your hosting package. If you are hosting your website on a dedicated server, chances are you are in a managed or comanaged hosting contract. Usually these sorts of arrangements provide for some sort of website monitoring service.
In any case, you have plenty of options in terms of available software. This chapter discusses two of the most popular web stats packages commonly available through most of the current shared hosting providers. We will also look at one commercial offering.
Granted, web server logfiles are not meant to be read by people, and they are quite “ugly” to look at. Logfiles provide raw data, specifically formatted to be processed by various web stats programs. They are all helpful in spotting web user and web spider usage patterns.
Generally speaking, web server log formats can be configured on each web server platform to record more or less information in relation to each web hit. NCSA is one of the most popular formats, as it is used by the Apache web server and most of the shared hosting providers. It comes in several formats, including NCSA Common and NCSA Combined.
NCSA Common Format
The NCSA Common logfile format is a text-based format that is ASCII standards compliant. It is employed in web servers as well as in FTP, SMTP, and NNTP servers. The NCSA Common log format is the simplest and is defined as follows:
[hostip] [rfc931] [username] [date:time] [request] [code] [bytesize]
Table 6-1 shows a parameter summary of the NCSA Common logfile format.
Parameter | Details |
| Numerical IP address of the requesting host/computer |
| ID used to identify the
client initiating the request; |
| Username used by the
client to communicate; |
| Date string [dd/Mmm/yyyy:hh:mm:ss +-hhmm] in GMT |
| Request string containing HTTP method, request, and protocol version |
| HTTP status code indicating various scenarios including success, failure, redirect, moved permanently, etc. |
| Total size of the HTTP transfer in bytes |
The following code fragment shows example logfile entries:
99.23.161.18 - johndoe [10/Oct/2008:21:15:05 +0600]
"GET /index.cgi HTTP/1.0" 200 588
99.23.161.18 - johndoe [10/Oct/2008:21:15:05 +0600]
"GET /style.css HTTP/1.0" 200 5382
99.23.161.18 - johndoe [10/Oct/2008:21:15:06 +0600]
"GET /mainscript.js HTTP/1.0" 200 7245
99.23.161.18 - johndoe [10/Oct/2008:21:15:06 +0600]
"GET / HTTP/1.0" 200 5382
99.23.161.18 - johndoe [10/Oct/2008:21:15:07 +0600]
"GET /games.jpg HTTP/1.0" 200 15022
Obviously, none of this is memorable, and to the average eye it is nonsensical. Not to worry; you will almost always want to process this with a web stats program.
NCSA Combined Format
The NCSA Combined format is a more useful format, as it records more information. It is defined as follows:
[hostip] [remote] [username] [date:time] [request] [code] [bytesize]
[referrer] [useragent] [cookies]
There are three extra fields in the NCSA Combined format, as shown in Table 6-2.
Parameter | Detail |
| URL that pointed to this web page (element) |
| A string representing the name of the client (Firefox, Internet Explorer, Chrome, Googlebot, etc.) used to request this page (element) |
| A string representation of name/value pairs of clients’ cookies |
Although the referrer and
useragent fields are optional,
there is no reason not to use these fields in your website’s server
logfiles. Example logfile entries would look similar to the following
web log fragment:
99.23.161.18  - johndoe [10/Oct/2008:21:15:07 +0600]  "GET /index.html
HTTP/1.0" 200 2225 "http://www.somesite.com" "Mozilla/4.0 (compatible;
MSIE 7.0; Windows NT 5.1; .NET CLR 1.0.3705; .NET CLR 1.1.4322; Media
Center PC 4.0; .NET CLR 2.0.50727; .NET CLR 3.0.04506.30)"
"prefcolor=blue;prefsong=28"
Without going into great detail, it is worth mentioning that there is a third NCSA format: NCSA Separate. The basic idea is that the NCSA Separate log format uses three separate logfiles, comprising access logfiles, referral logfiles, and agent logfiles.
In addition to these NCSA log formats, the IIS web server and others use additional log formats. These include W3C, WAS, and custom log formats. For more information on these formats, consult your specific platform documentation.
NCSA Combined Format in Apache
The default Apache installs may generate three logfiles, namely the Access Log, Agent Log, and Referrer Log. The most popular of the formats is NCSA Combined. Setting up NCSA Combined logging is relatively straightforward in the Apache web server. In your Apache http.conf file, make sure to enable or add these two lines:
LogFormat "%h %l %u %t "%r" %>s %b "%{Referer}i" "%{User-Agent}i"
 "%{cookie}i"" combined
CustomLog /logs/access_log combined
If there are other definitions of LogFormat, you may want to disable
them.
Converting IIS W3C to NCSA Combined
If you are running your site on IIS and you need to convert your log format to NCSA Combined, it is best to use W3C logging in IIS and then use a converter tool to get the NCSA Combined equivalent. One such tool is the Rebex Internet Log Converter (rconvlog), which you can find at http://www.rebex.net/rconvlog/default.aspx.
You may also achieve the same thing by writing a custom converter script. One such approach is discussed in detail at http://bit.ly/vrPZk. This may not be necessary, as most of the newer web stats tools support the W3C log format and many others.
Spotting a Web Spider in Web Logs
How do you know when a web spider has crawled your website? All web spiders, including Google’s Googlebot, leave plenty of information behind so that you know they were there and, more importantly, what they crawled. Here are some typical web spider trails in web server logs:
74.6.22.170 - - [31/Oct/2008:03:23:36 −0600] "GET
/robots.txt HTTP/1.0" 200 680 "-" "Mozilla/5.0 (compatible; Yahoo!
Slurp; http://help.yahoo.com/help/us/ysearch/slurp)"

66.249.73.47 - - [31/Oct/2008:04:46:15 −0600] "GET /robots.txt
HTTP/1.1" 200 718 "-" "Googlebot-Image/1.0"

66.249.73.47 - - [31/Oct/2008:08:48:49 −0600] "GET
/modules/myalbum/photo.php?lid=28&cid=3 HTTP/1.1" 200 6562 "-"
"Mozilla/5.0 (compatible; Googlebot/2.1;
+http://www.google.com/bot.html)"
In the preceding log fragment, you can see three frequent web spider signatures. The first one is that of the Yahoo! web spider, Slurp. The second and third signatures are those of the Google image spider (Googlebot-Image) and the main Google crawler (Googlebot).
There are many different spiders, not just those from Google and Yahoo!. Web spiders, just like regular web users, do leave trails in web server logs. OK, you’ve had enough of cryptic logfiles; it is time to examine the tools that process these logfiles.
Popular Web Stats Tools
Many different free and paid web stats tools are available. Table 6-3 shows some of the best known web stats tools, along with their pros and cons.
Tool | Pros | Cons |
Webtrends Price: $10,000+ |
| |
Analog Price: Free |
| |
WebLog Expert Price: $74.95–$124.95 |
| |
AWStats (http://awstats.sourceforge.net) Price: Free |
| |
Webalizer Price: Free |
|
Webalizer and AWStats are readily available on a plethora of shared hosting providers, whereas WebLog Expert is the notable inexpensive alternative to Webtrends and other commercial offerings.
You can use any web stats package as long as it can give you the information you need to do your SEO. At a minimum, you need to be able to get the following types of metrics to have a good picture of how your website is doing:
Number of visitors
Unique visitors
Number of hits
Number of page views
Referrers
Search engine hits
Searches/keywords
Spider hits
It should be easy to apply the information I’ll provide in this chapter to any web stats package you use. The principles are much the same.
Using WebLog Expert
The following subsections discuss some of the most important web stats metrics, with example screenshots taken from the WebLog Export application. I use the terms metric and statistic interchangeably, as I am referring to the same thing. Note that I will present equivalent information and graphs in AWStats and Webalizer later in this chapter.
Number of Visitors
This statistic shows the total number of visitors you have for a given day. Figure 6-1 shows a sample graph.
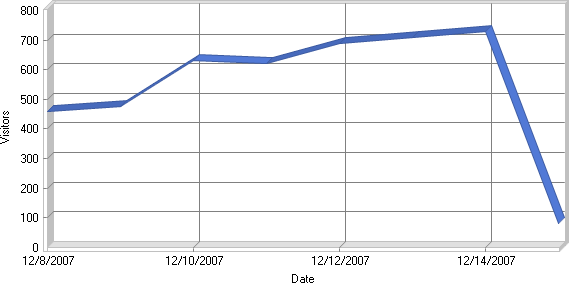
These visitor numbers are the sum total of all visitors, including web spiders.
Unique Versus Total Visitors
There is a big difference between the total number of visitors and the unique visitors to a site. The “total visitors” metric does not discriminate against multiple visits by the same visitor. The “unique visitors” metric, on the other hand, tries to calculate exactly what it implies: unique visitors. Most web stats packages calculate this by calculating the total number of unique IPs. If you are not familiar with IP addresses, you can think of them as the unique address of every computer on the Internet.
Although the “unique visitors” metric is useful, it is not entirely accurate. Large organizations or even home and small office networks share the same IP address most of the time. In other words, if an organization has 1,000 people all hitting the same website, the web stats will show this as only a single unique visitor.
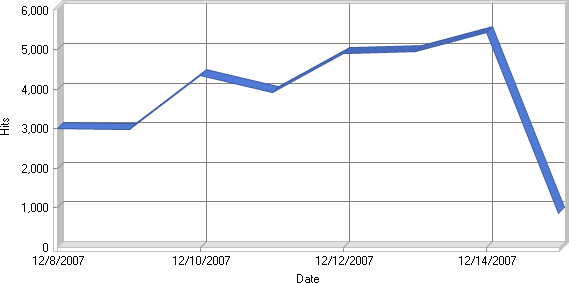
Number of Hits
This statistic shows the total number of hits you received in a given day. Figure 6-2 shows a sample graph. Depending on the design of your website, this number could be quite misleading. If your web pages contain a lot of images and other nontext elements, this number would not mean much.
If your website is mostly textual, however, the number would have a better meaning. Try not to take your web stats at face value. Think of what these metrics could mean in relation to your website.
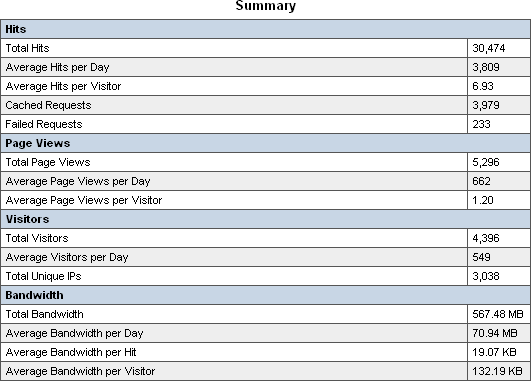
Number of Page Views
The number of page views represents the number of times a particular HTML file was viewed. A single page can consist of multiple externally loaded parts, including images, JavaScript code, stylesheets, and so forth. This metric ignores all of these parts, as it counts only the actual HTML page hits. Figure 6-3 shows a Summary table that WebLog Expert generates to give you an idea of the total number of page views per day.
Note
When I talk about HTML pages, I also mean ASP, PHP, CGI, ColdFusion, JSP, and other formats.
If your website is using Ajax or a similar technology to load multiple HTML fragments seemingly into a single page, the daily page views number will be skewed. Understanding your Ajax-based website will allow you to make some approximations if necessary.
Referrers
This statistic shows which websites are “referring” to yours, via a link to one of your pages. A link from a popular website can generate tons of traffic. Figure 6-4 shows a sample graph taken from WebLog Expert.
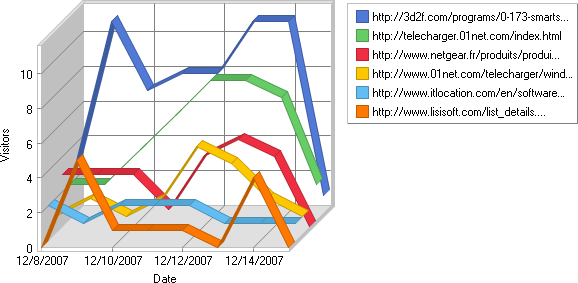
An increased number of unique referrers usually means your website is gaining in popularity. This is desirable, as now you are getting not only search engine referrals, but also referrals from different websites. This can also happen when you open a new search engine marketing channel (such as Google content ads), and does not necessarily mean increased organic link exposure.
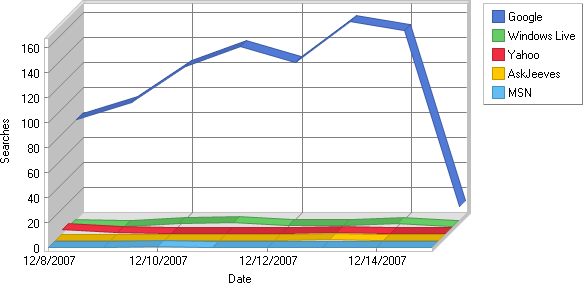
Search Engine (Referral) Hits
The website shown in Figure 6-5 is getting hits from Google, but hardly any from other search engines. This could be an indication that your site is optimized only for Google. This is not necessarily a bad thing, but you are likely missing out on some additional search engines.
Searches/Keywords
Each time search engines send you referrals, keywords are part of the HTTP headers that are stored in your web server logfiles. Figure 6-6 shows a graph of daily search phrases. This is one of the most important statistics in SEO.
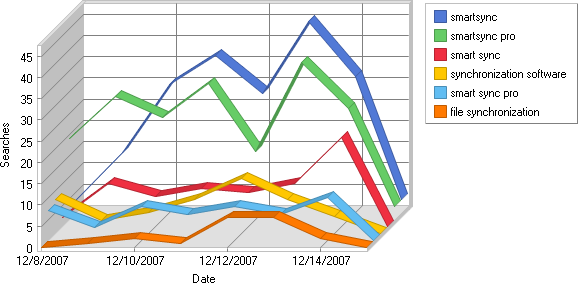
Viewing these stats will give you a good idea of how well optimized your website is for your targeted or desired keywords.
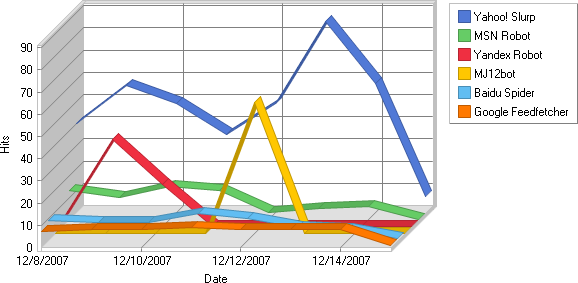
Web Spider Hits
These are the hits that automated search engine programs generate. The Internet has many web spiders serving their respective search engines in their ultimate goal of crawling countless websites. Being able to track their activities is important.
For the most part, you will only care about the most important web spiders of the bunch: Googlebot, Slurp (Yahoo!), and MSNBot. The chart in Figure 6-7 illustrates web spider hits.
For more information on WebLog Expert, you can download a trial version at http://www.weblogexpert.com/.
Using AWStats
Some people prefer using AWStats due to its fancy report format. I like AWStats since it shows some additional graphs when compared to Webalizer (which I cover later in this chapter). Figure 6-8 shows a sample AWStats summary page. You are presented with a lot of information.
Notice that the current or selected month summary is presented at the top of the screen, whereas the 12-month summary is presented immediately below. If you see a lot of zeros across the whole month, this could mean a number of things, including:
The website moved from another provider.
The website is new.
Web stats reporting functionality was just enabled.
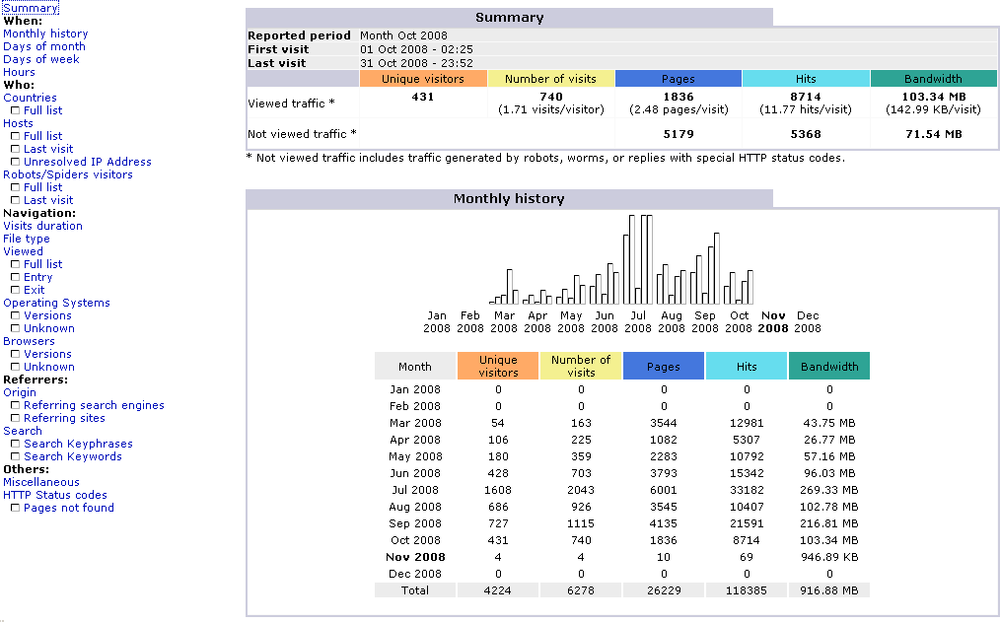
Also notice the key metrics, including unique visitors, number of visits, pages, hits, and bandwidth. Figure 6-9 shows the Robots section.
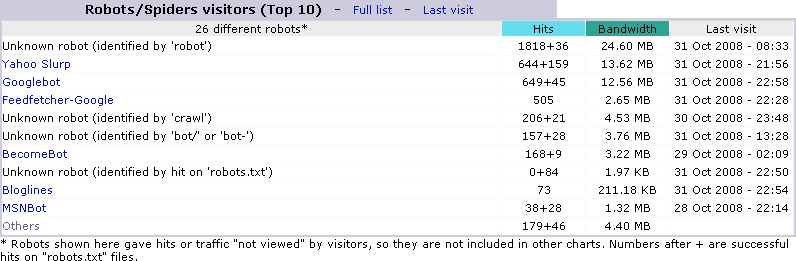
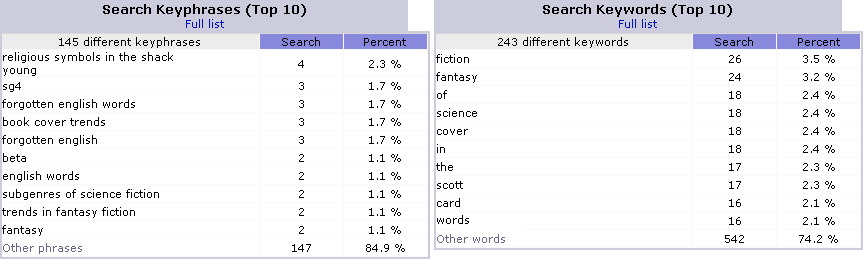
Figure 6-10 shows the top search keyword phrases and keywords.
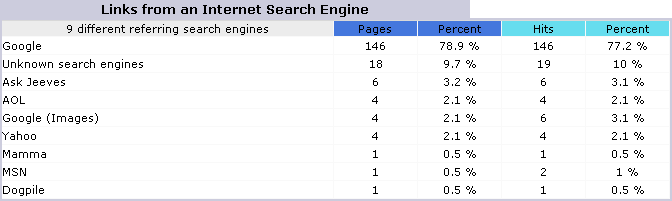
To see a breakdown of search queries for each search engine, click on the “Referring search engines” link on the left navigation pane. Your screen should look similar to Figure 6-11.
Using Webalizer
Some shared hosting providers allow for web log downloading (typically via FTP). This is to allow people to process their logs on their PCs. This is probably a good idea, as most providers tend to keep only the last month of web server logs.
If you are on a shared host, you can usually find Webalizer through a web page interface called CPANEL. Depending on your hosting provider, you may see slightly different screens. At first, CPANEL can look a bit daunting, with so many different icons to choose from.
To make it even more confusing, you may need to enable your web stats packages to start getting the reports. If this is the case, you will not be able to see the reports for some time, usually a day or so. Come back in a couple of days to see some early graphs. Your screen (summary page) will look similar to Figure 6-12.
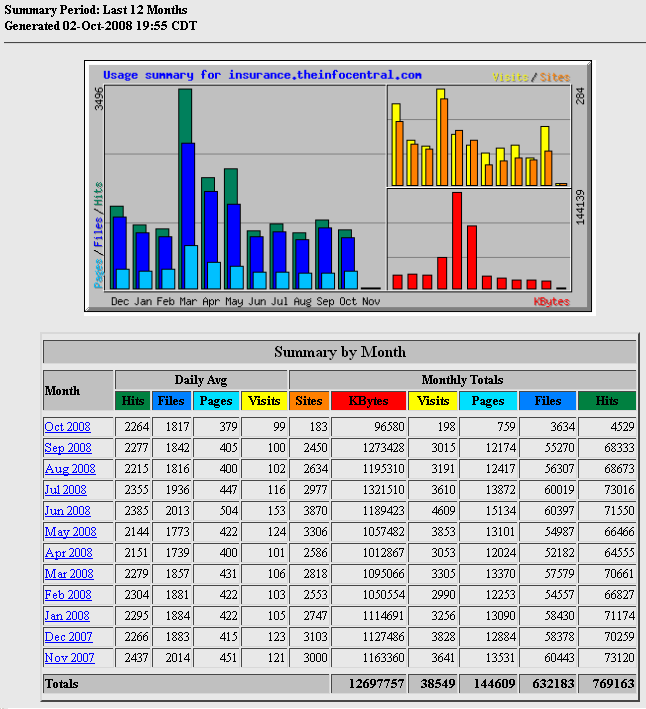
On the summary page you can see important metrics such as daily average hits, daily average visits, monthly average hits, and monthly average visits. Note that page views are represented in the “Pages” column.
Also note that unique IPs or unique visitor numbers are displayed in the “Sites” column. This should make sense to you since the number of total visits, as shown in the “Visits” column, is almost always greater than the number of unique visitors, as shown in the “Sites” column.
There are three more metrics we need to go over:
Referrers
Searches/keywords
Spider hits
The initial (or index) summary page provides a summary view for the past 12 months of your website’s activity. To see more details of a particular month, you would simply click on that month.
Once you are in the monthly summary page, click on the “Referrers” top menu link to see your website’s referrers. Some of the referrer links may be from your own website. Ignore them, as they do not provide much value. Figure 6-13 shows an example referrers section.
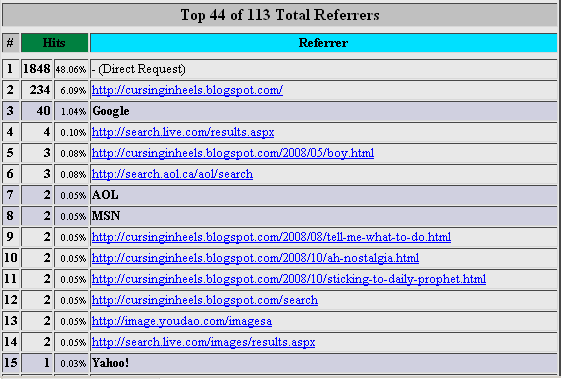
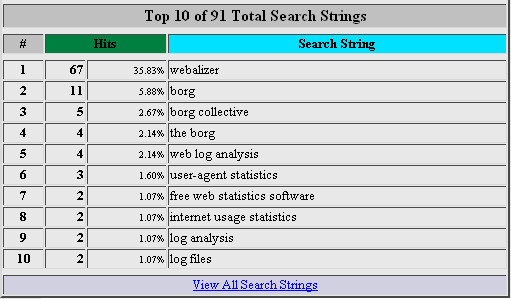
Referrers can be websites that have direct links to your website (or other minor search engines), or they can be part of a search engine marketing content network. Click on the “Search” top menu link to see all the keywords. These keywords are the sum aggregation of all keywords for your entire website. Figure 6-14 shows the search section.
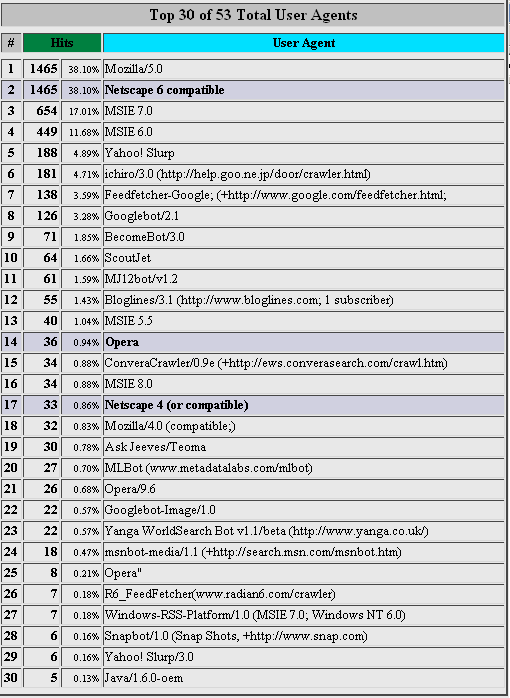
Finally, to see the spider hits, click on the “Agent” top menu link to examine stats on web spider activity. User agent (or just agent) represents a type of web user. There are basically two types: human users and automated web spiders. This summary table shows all kinds of agent signatures.
You will get to see not just web spider signatures, but also web browser signatures in addition to any other signatures possibly generated by some custom automated scripts. See Figure 6-15 for more details.
Some people like using Webalizer because it’s a great tool for viewing web stats quickly. Others prefer using AWStats due to its fancy report format. Although the type of information AWStats displays is similar to the type of information Webalizer displays, for some statistics the reporting values might vary between Webalizer and AWStats due to the way they process logs. To choose the one that’s right for you, review both types of reports. One report may be clearer or easier to understand for a specific web metric. You may also have an aesthetic preference. The key is to find something that works for you and meets your needs and comfort level.
Tying Searches to Individual Web Pages
Knowing what search phrases visitors typed to drive traffic to your website is essential. It’s even more important to tie the search phrases back to the actual web pages. Some of the available web stats tools on shared hosting providers do not show this sort of relationship.
You can tie searches to individual web pages with a simple Perl script: searchPhraseReportGoogle.pl, which appears in full in Appendix A. This script can handle multiple logfiles. To run the script, type in the following:
perl searchPhraseReportGoogle.pl logfile1.log logfile2.log
The assumption is that the logfiles are stored in the NCSA Combined format. After you run the command, a file called keywordsummary.html is generated. If you open the file in a web browser, it should render similarly to Figure 6-16.
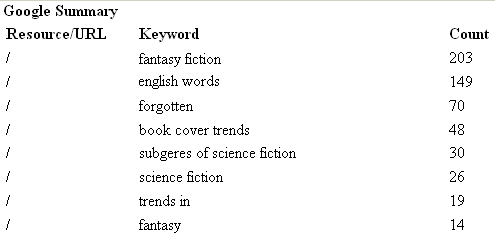
As you can see in Figure 6-16, you can clearly see which page or file got the most hits for a particular keyword. The forward slash (/) indicates the default page for this domain. You should have no doubts about where the hits are going and for what keywords.
You can modify the preceding Perl script to do the same thing for Bing searches. The modified version, searchPhraseReportBing.pl, is also available in Appendix A. To run it, execute the following command:
perl searchPhraseReportBing.pl logfile1.log logfile2.log
Simply list filenames separated by a space.
Web Spider Patterns
Web spiders evolve and change just as your websites evolve and change. The more you give the more you get. The “give” comes in the form of content. The “get” comes in the form of search engine referrals for your keyword-optimized web pages.
Web spiders start with a “feeling out” process. They come once in a while to say “hello” until they get a better idea about your site. Once they get a good sense of your website, they come back with a fury if your website offers them food in the way of good content.
Depending on the type of website you are running, spider visits can be less or more frequent. If you are constantly providing new content, spiders will follow you every step of the way. If your website’s content does not change much, spiders will still visit your site, albeit less frequently.
User Patterns
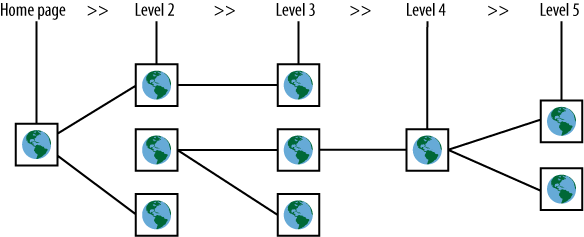
There are several key user pattern concepts to take note of, including user entry pages, user exit pages, and user click paths. User patterns say a lot about many things regarding your website. They say a lot about SEO, but also about your website’s usability, psychology, and impressions. Take a look at the sample website structure shown in Figure 6-17. You could have visitors landing on just about any page within your website.
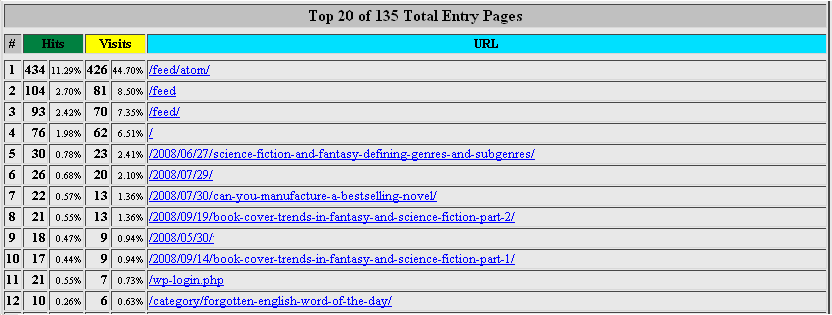
If you’re using Webalizer, you can see where your web visitors are entering your website by clicking on the “Entry” link. Your screen will look similar to Figure 6-18.
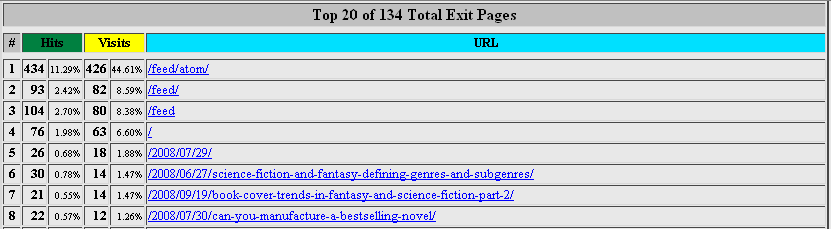
Now, what if you want to know where your web visitors exited? Figure 6-19 shows the exit pages.
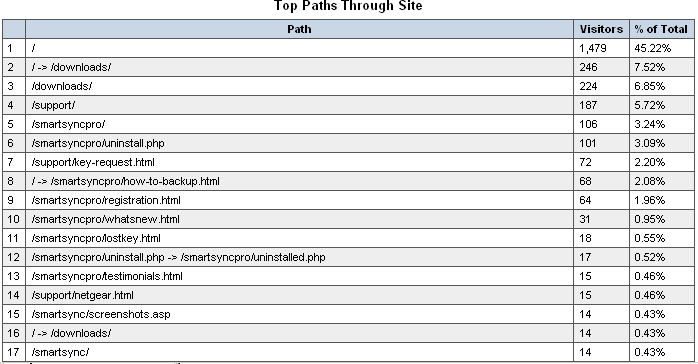
Knowing how web users use your site is important. This is where the metric called click path (or top path) comes in. This feature is not available in Webalizer or AWStats (as of this writing). Figure 6-20 shows how this feature looks in WebLog Expert.
Lots of paths may be single web pages or web documents, as shown in Figure 6-20. In such cases, think of it as web users coming to a particular web page and then exiting your website without clicking on anything else.
Web stats tools, just like any other software, are prone to bugs. My advice is to use multiple web stats tools before drawing any conclusions. Don’t accept anything at face value, but rather, question what you see if you think something does not make sense.
Filtering Specific Data
Before we finish this chapter, it is important to put things in the right perspective. Web stats are a great tool for SEO. Although web stats can provide an abundance of information, not all of this information is useful. For most websites, knowing the number of web page views is much more useful than knowing or reporting on the number of website hits.
Types of Web Page Elements
The vast majority of web pages on the Internet comprise much more than just plain text. Table 6-4 lists some of the most common web page elements.
Element | Details |
JavaScript | JavaScript files are stored in external .js files |
Stylesheet | Stylesheet files are stored in external .css files |
Images | Graphics files are stored in external files (e.g., .gif, .png, .jpg) |
Flash | Flash files are stored in external .swf files |
Java applet | Java applets are stored in external .class or .jar files |
Sound/music | Music files are stored in external files including .mp3 and .mid |
Videos | Video files are stored in external files including .asf and .avi |
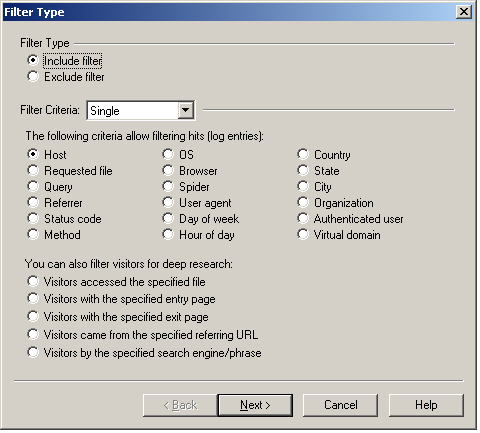
Some web stats tools provide ways of focusing on only the information you are interested in, by way of filters. You can filter on many different things. For example, WebLog Expert has extensive filtering options, as shown in Figure 6-21.
Conversion tracking with web server logs
You can easily track conversions by using web server logs. A conversion is successful when a web user reaches his goal page. For example, suppose you are selling a product. At the end of every purchase the user is brought to a thank-you page (e.g., thankyou.php). You can use the filter shown in Figure 6-21 to track the number of times this file is accessed. Similarly, you can track the number of times a particular landing page is accessed to measure the relative conversion rate.
Summary
By now, you should have a better understanding of web stats as a tool for basic SEO monitoring. Many web stats tools are available, and although we covered only some of the most popular ones, do not be afraid to experiment with others until you find the one that meets your requirements. Fully understanding your web stats often requires use of multiple tools.
The free tools we covered are the standard tools in shared hosting environments. In the next chapter, we will examine Google Analytics and Webmaster Tools, and discuss more advanced features in SEO monitoring and troubleshooting.