
Chapter 7. Google Webmaster Tools and Google Analytics
This chapter is divided into two parts. First we’ll cover Google Webmaster Tools. The Google Webmaster Tools platform gives webmasters an easy way to track their web page traffic, analyze their robots.txt file, add their Sitemap files, and so forth. It would be foolish not to utilize Webmaster Tools, as it is an indispensable resource for conducting SEO.
The second part of the chapter covers the Google Analytics platform. Google Analytics is the preferred marketing tool for viewing general web stats and, more importantly, conversions. Both of these are great tools, and best of all, they are free. Both of these tools should become part of your SEO toolkit.
Google Webmaster Tools
Google Webmaster Tools is a good resource for webmasters. With it you can easily spot all kinds of problems. The following subsections explore Google Webmaster Tools in detail.
Webmaster Tools Setup
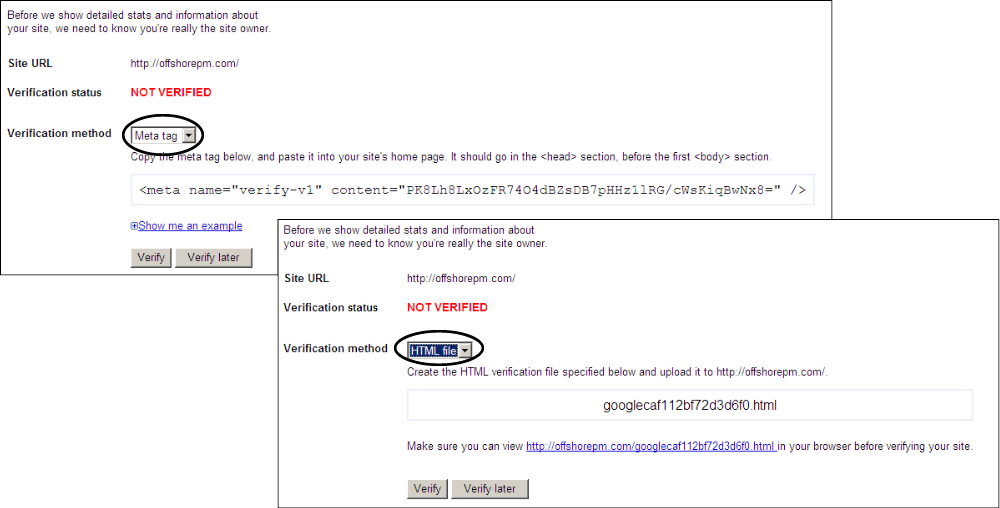
Just as you do when using any other Google tool, you need to register for a Google account before you can use Google Webmaster Tools. If you already have a Google account, sign in at http://google.com/webmasters/tools/. Once you are signed in, you will want to add your site to Google Webmaster Tools. Before you can add your site, Google will ask you to prove that the site in question is truly yours. Figure 7-1 shows the two methods you can use to validate your site.
The default method is to use the HTML meta tag. The second way is to upload a text file with the exact (random) name as generated by Google.
Once you validate your site, you will be ready to use Webmaster Tools. Note that it will take some time for you to see any data. Just come back later.
Dashboard
Upon every logon to Webmaster Tools, you will see a list of your sites. Clicking on any of your sites brings you to the (summary) Dashboard page, as shown in Figure 7-2.
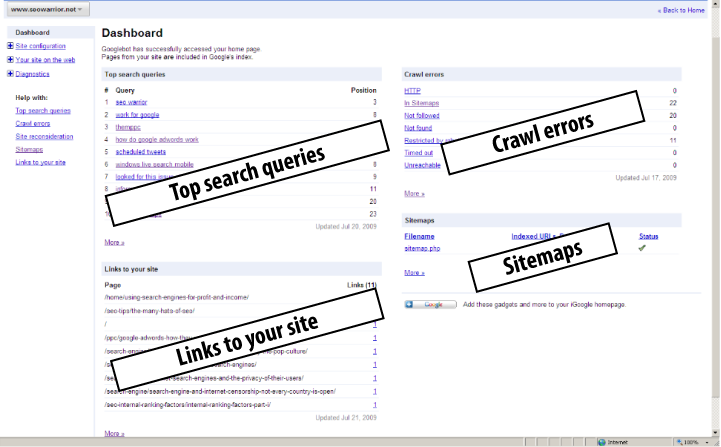
The Dashboard screen lists your top search queries, crawl errors, links to your site, and Sitemaps. You can use the navigation panel on the left side of the screen to view more details, as well as to use additional tools. We’ll examine those in the following sections.
The “Site configuration” Section
Selecting the “Site configuration” menu option opens additional options, including Sitemaps, “Crawler access,” Sitelinks, “Change of address,” and Settings. We explore each in the following subsections.
Sitemaps
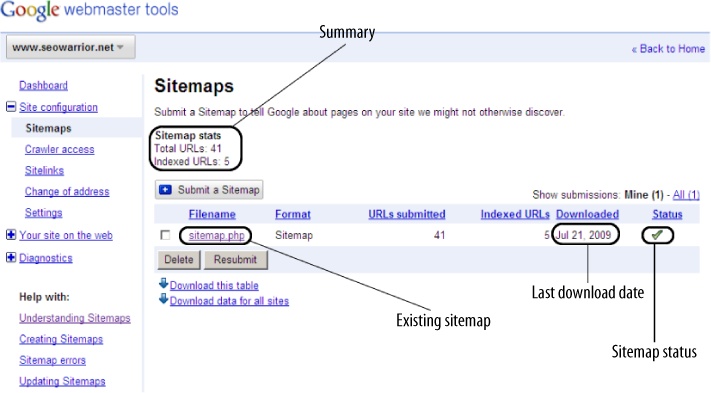
You use the Sitemaps option to submit new Sitemaps, see the status of existing Sitemaps, delete and resubmit Sitemaps, and export Sitemap-related data to an Excel spreadsheet. If your Sitemaps have any errors, you will see an indication of such under the Status field of your Sitemap listing. Figure 7-3 highlights the key parts of the Sitemaps interface.
Crawler access
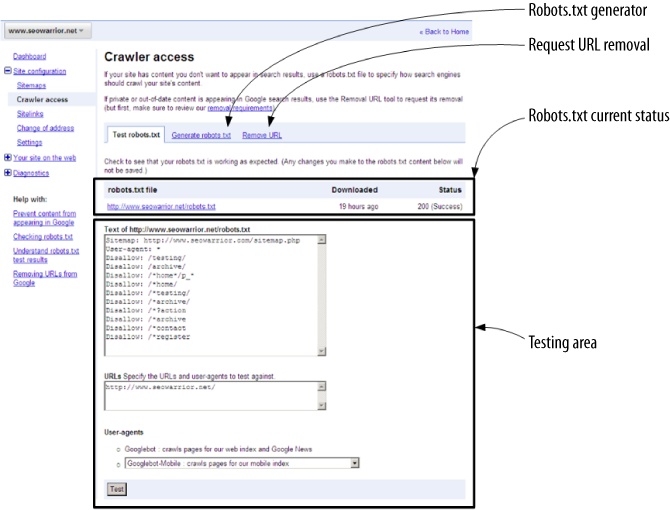
You use the “Crawler access” option to manage your robots.txt file. You can do many things while on the “Crawler access” page. Figure 7-4 shows the default “Crawler access” screen. At the top you are presented with three tabs. The “Test robots.txt” tab is the default tab and is used for testing the robots.txt file. Clicking on the “Generate robots.txt” tab presents you with another screen where you can interactively assemble your new robots.txt file, which you can upload to your server. The “Remove URL” tab brings you to a page where you can tell Google to remove specific URL(s).
You will spend most of your time in the default (robots.txt testing) tab. Just below the three tabs, you should see the current status of your existing (or missing) robots.txt file. Immediately below that you will find what you can think of as your robots.txt testing area. There are three major fields you can play with here. The first text area field downloads your existing website robots.txt file by default. You can change this to anything you want, as the field is fully editable.
The next text area field is where you can list your URLs. Your domain name in the URL must match your actual domain name for the domain session you are currently viewing within Webmaster Tools. Each URL should be listed on a separate line.
Google also allows you to test your URL and robots.txt combinations with several different spiders, including Googlebot-Mobile, Googlebot-Image, Mediapartners-Google, and AdsBot-Google.
Sitelinks
Google Sitelinks is a feature for enhancing relevant site listings with additional hotspot links found on a particular site. Sitelinks typically appear as the top result on the Google SERPs. If you own a new site, don’t expect to get your Google site links right away. Figure 7-5 shows an example as taken from Webmaster Tools.
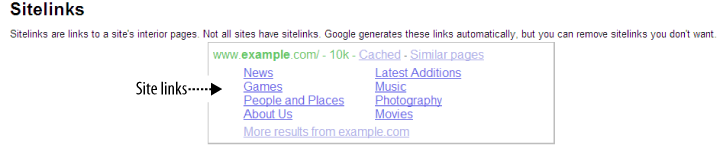
Every site should strive to get sitelinks, as they imply authority as well as web presence. Sitelinks also occupy additional search results screen real estate, the space that pushes your competitors farther down the results page—something to be desired.
Once you earn your sitelinks, you can remove any unwanted links that appear in the Google SERPs using the Sitelinks section of Webmaster Tools. According to Google, sitelinks are completely auto-generated. Visit http://bit.ly/4EORUm to read more about sitelinks.
Change of address
Google makes it easy when you have to move your site to another domain. Google states that doing this will help the company update its index faster and “smooth the transition for your users.” Figure 7-6 shows a screenshot of the “Change of address” subsection.
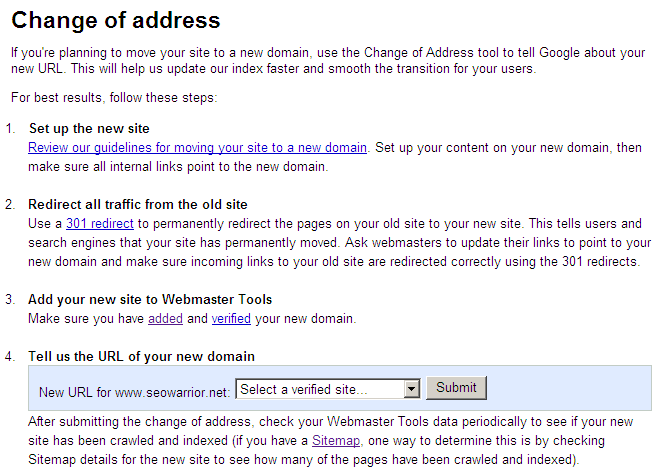
As you can see in Figure 7-6, Google provides you with step-by-step instructions for moving your site.
Settings
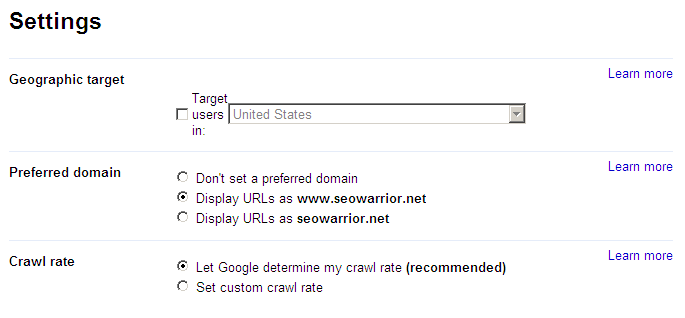
With the Settings option you can customize your geographic target, preferred domain, and desired crawl rate. Figure 7-7 shows a portion of this subsection.
If you wish, you can target users in a specific country by enabling the “Geographic target” checkbox. The default setting is Off. If you are worried about link canonicalization, you can tell Google about your preferred domain. Note that this is only one level of potential content duplication.
You can also set your own custom crawl rate. Google provides no guarantees when it will crawl your site. You are better off letting Google determine your site’s crawl rate.
The “Your site on the web” Section
The “Your site on the web” menu option contains several subsections, including “Top search queries,” “Links to your site,” Keywords, “Internal links,” and “Subscriber stats.”
Top search queries
By selecting the “Top search queries” option, you can see keyword queries where your site appeared on Google search results. Figure 7-8 illustrates the key parts of this page.
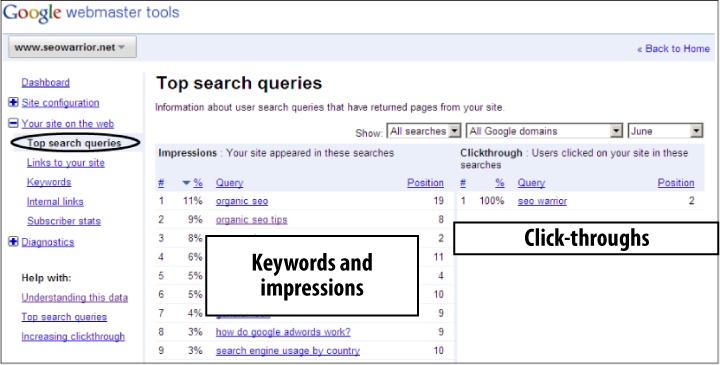
The “%” column indicates the percentage of impressions of a particular keyword compared to all of your keywords. You also can see the actual rank or position of each keyword in the last column to the right.
On the righthand side of the screen is a section regarding your site’s click-throughs. It shows all searchers’ queries that made it to your site in a similar breakdown.
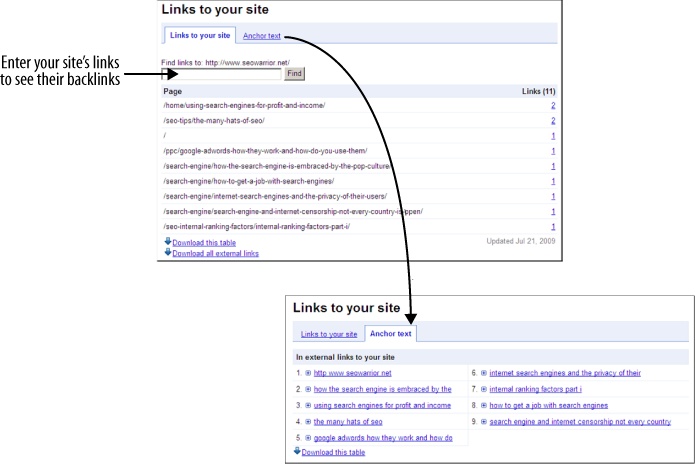
Links to your site
The “Links to your site” option is useful for current state backlink analysis. You can see who is linking to your internal pages, and enter your internal URLs to see whether they have earned any backlinks. You can also view the anchor text of your backlinks. Figure 7-9 shows parts of these screens to illustrate the concepts.
Keywords
The Keywords page shows the most important keywords found on your site. You can see what keywords are working. You may also be surprised by some keywords. If you see irrelevant keywords, your site may have been hacked. If you do not see your targeted keywords, you may wish to check for any crawl errors in addition to checking whether your particular page was crawled.
Internal links
The “Internal links” page is similar to the “Links to your site” page. Here, you can search for internal links linking to other internal links. This is important, as it pertains to the flow of your link juice.
Subscriber stats
The “Subscriber stats” page shows your existing feed(s) and their Google subscribers; see Figure 7-10. You also have the option to add your feed as your Sitemap; as we will discuss in Chapter 10, it is best not to use this option.

The Diagnostics Section
The Diagnostics section consists of three parts: “Crawl errors,” “Crawl stats,” and “HTML suggestions.” The following subsections discuss the details.
Crawl errors
The “Crawl errors” page shows you your site’s crawling problems. There are three main tabs on this page: Web (which is the default), Mobile CHTML, and Mobile WML/XHTML. Figure 7-11 shows a portion of this page.
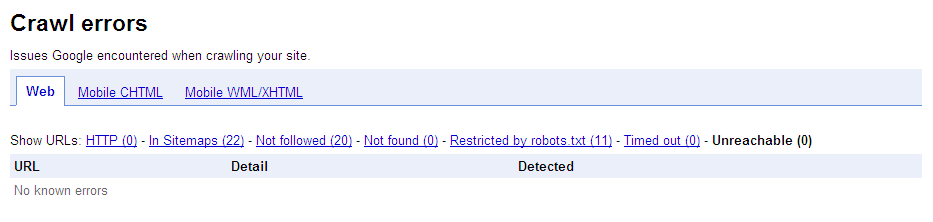
Crawl errors come in all sorts of flavors. This option is particularly useful when tracking any broken links that Google bots are finding. The tool will also report pages that are restricted by your robots.txt file. In addition, you will see pages that time out or are unreachable.
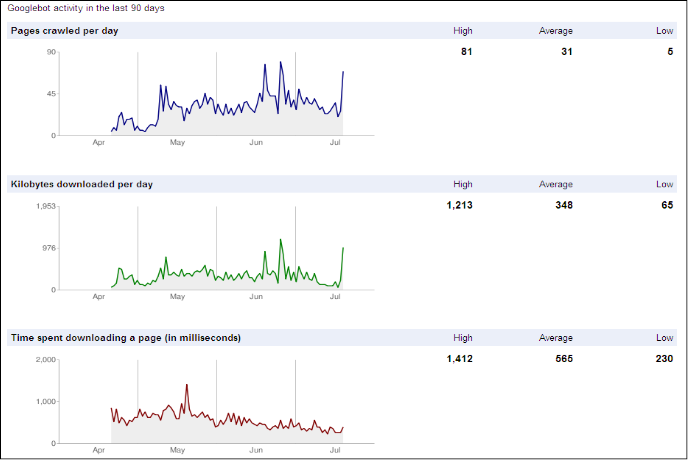
Crawl stats
The “Crawl stats” page shows a breakdown of Googlebot activities. Figure 7-12 shows a portion of this page. The first graph shows the number of pages crawled per day over a period of time. The second graph shows the number of kilobytes downloaded per day, and the last graph shows the download speed during that period. Each graph is augmented with statistical data, including data highs, lows, and averages.
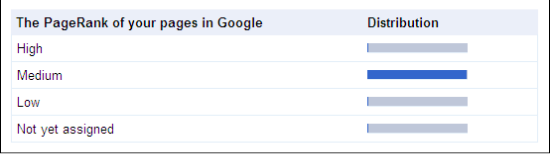
At the bottom of the “Crawl stats” page is a graph of your site’s PageRank distribution (see Figure 7-13).
HTML suggestions
Another gem of the Google Webmaster Tools platform is in the “HTML suggestions” page (see Figure 7-14).
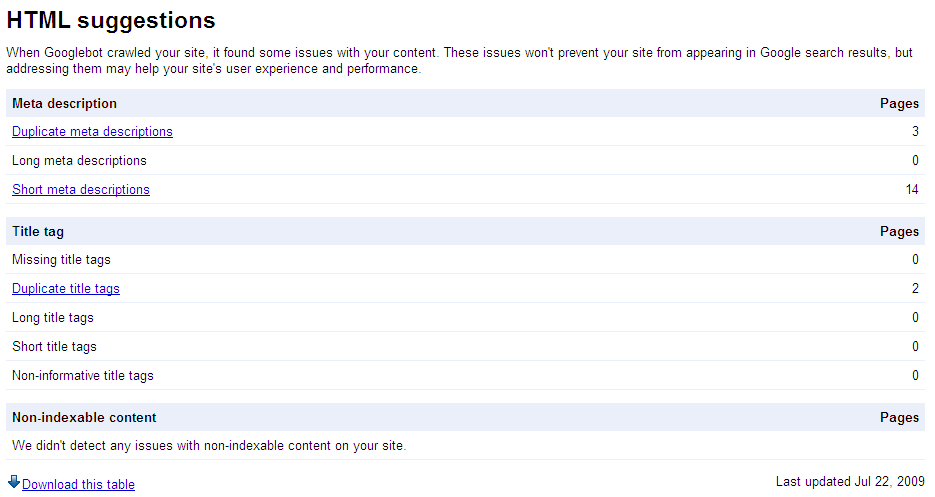
On this page, Google will tell you what it thinks of your site’s pages in terms of your meta descriptions, title tags, and nonindexable content. In each subsection, you will find tips regarding duplicate, short, and long meta descriptions; missing, duplicate, long, short, and uninformative title tags; and similar information.
Google Analytics
If you prefer a simple, online web analytics tool, Google Analytics may be just what you are looking for. If Google Webmaster Tools is for webmasters, Google Analytics is for marketers. For many marketers, Google Analytics seems to be the tool of choice for all web analytics needs.
Google Analytics has seen several upgrades and face-lifts over the past few years. Google didn’t start with Google Analytics from scratch. In fact, it bought the idea from another company. According to Wikipedia:
Google’s service was developed from Urchin Software Corporation’s analytics system, Urchin on Demand (Google acquired Urchin Software Corp. in April 2005). The system also brings ideas from Adaptive Path, whose product, Measure Map, was acquired and used in the redesign of Google Analytics in 2006. Google still sells the standalone installable Urchin software through a network of value-added resellers; In April 2008, Urchin 6 was released.
Google touts its Analytics platform as “enterprise-class features delivered on Google’s world-class platform.” One of the major benefits of Google Analytics is integration with Google’s other landmark platforms, such as AdWords and AdSense.
Additional benefits include cross-channel and multimedia tracking, customized reporting, and data visualization. Perhaps its most enticing feature is that it is completely free. Without a doubt, Google Analytics is a solid offering that you should not overlook if you are OK with the fact that Google will (for the most part) know everything about your site. The following sections present a brief overview of the Google Analytics platform.
Installation and Setup
Google Analytics feeds off a small piece of JavaScript code that you need to place in every page that requires tracking. Before you can use Google Analytics, you must register for a Google account. You can sign up for an account by visiting http://www.google.com/analytics/.
The account signup process is relatively painless and takes about two minutes to complete. There are four screens in total. On the last screen, Google provides you with the JavaScript code you can place in your web pages. The code looks similar to the following fragment:
<script type="text/javascript">
var gaJsHost = (("https:" == document.location.protocol) ?
"https://ssl." : "http://www.");
document.write(unescape("%3Cscript src='" + gaJsHost +
"google-analytics.com/ga.js' type='text/javascript'%3E%3C/script%3E"));
</script>
<script type="text/javascript">
try {
var pageTracker = _gat._getTracker("UA-9899851-1");
pageTracker._trackPageview();
} catch(err) {}</script>
You are also given the option of using Google’s legacy code, which lacks some of the features in the latest version. Google supports the old code, as many sites are still using it. Do not use both pieces of code, as this may produce inaccurate reported data.
With the Google tracking code in hand, the next thing to do is to place it within your HTML. Instead of placing this code into every single HTML file, factor it out into an external file that is called by your site template file (if you are using templates).
Should Google ever decide to change the code, you will need to
modify only the single external file carrying the Google code. Google
suggests that you place its code just before the closing </BODY> tag of your modified code. It
will take some time before Google validates your code. You can check
the status by logging in to your Google Analytics account. You will
see a green checkmark once your account is validated.
Navigating Google Analytics
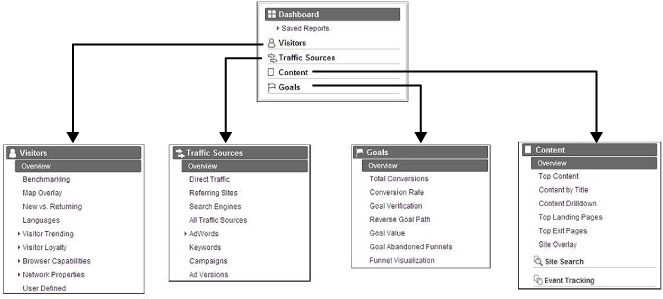
Google Analytics contains numerous features. To a novice user, it may be a bit daunting at first. Figure 7-15 shows the main navigation sections of the Google Analytics platform.
We will start our discussion of Google Analytics by looking at its Dashboard (home) page.
Dashboard
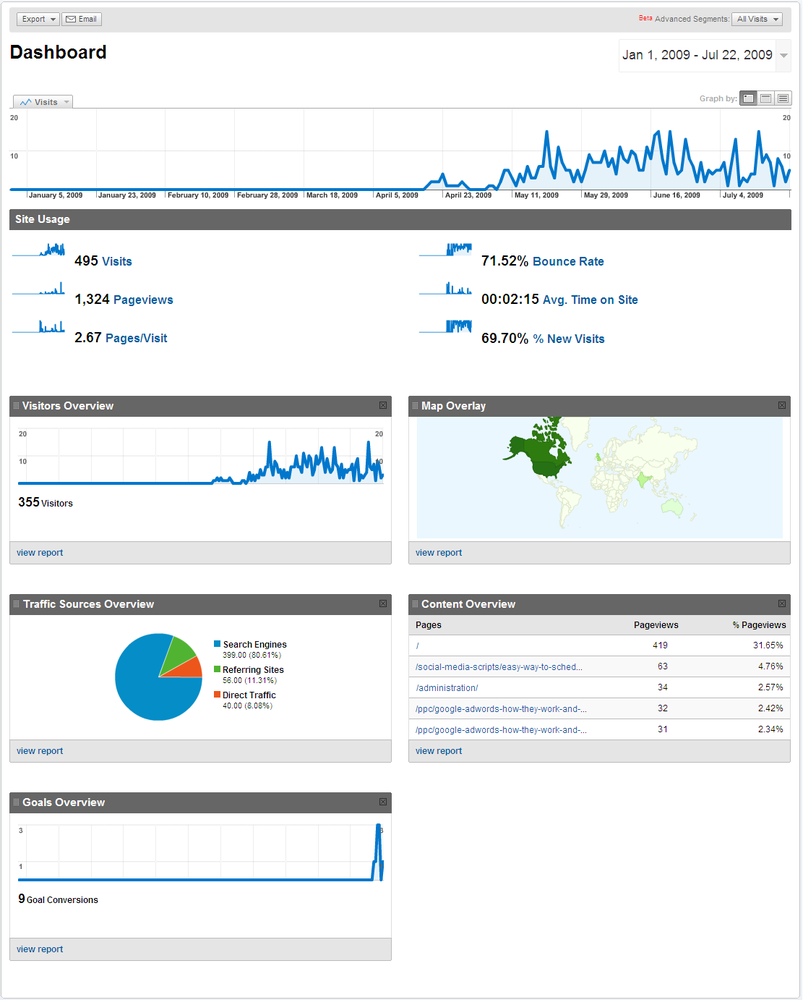
Assuming your account is up and running, the first thing you see when you log in to Google Analytics is the Dashboard page. Figure 7-16 shows a sample Google Analytics Dashboard page. The first part of the screen shows a visitor graph over time. The next section gives you a breakdown of your site’s usage. This includes the number of unique visits, number of page views, average number of viewed pages per visit, average page bounce rate, average time visitors spent on the site, and percentage of new visitors.
Other sections included in the Dashboard page are labeled Visitors Overview, Map Overlay, Traffic Sources Overview, Content Overview, and Goals Overview. Note that you can customize your Dashboard page view as well.
By default, the Dashboard page shows data in relation to all visits; no other segmentation is applied. As the time of this writing, Google was introducing an Advanced Segment (beta) feature, which allows you to generate additional graphs and data segregated to each segment. You can use this option by clicking on the button next to the Advanced Segments label in the top-righthand corner of the Dashboard page.
You should be able to select among several different segments, including New Visitors, Returning Visitors, Paid Traffic, Non-paid Traffic, Search Traffic, Direct Traffic, Referral Traffic, Visits with Conversions, Visits from iPhones, and Non-bounce Visits. Figure 7-17 illustrates some of the options as well as the graph that results when you select an additional segment.
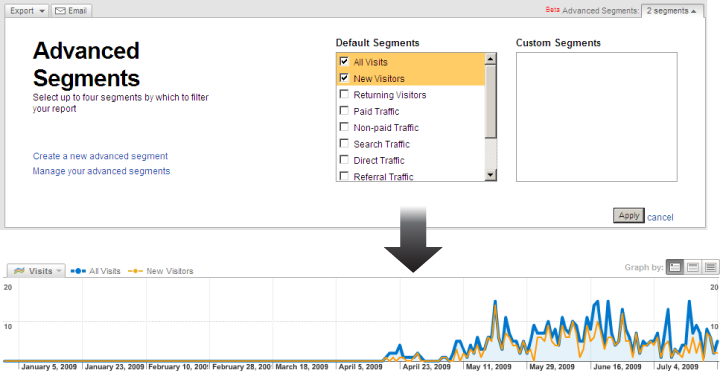
As you can see in Figure 7-17, once you introduce additional segments, the graph is redrawn in such a way that each segment is superimposed over the other segments. Also note that you can create custom segments by clicking on the “Create a new advanced segment” link shown on the lefthand side of the screen. Finally, when you add segments, all graphical and textual data is augmented with segment-specific details.
Visitors Overview page
When you click on the Visitors menu item, you will see a summary page that looks similar to Figure 7-18.
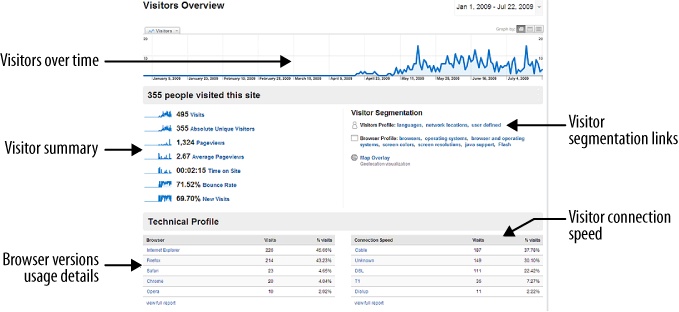
As shown in Figure 7-18, you can view a visitor time graph, visitor (metrics) summary, browser versions matrix, visitor connection speed summary, and visitor segmentation links.
Benchmarking
The Benchmarking page is particularly interesting. When you open it, you will see comparative graphical analyses of your site compared to other sites of similar size. Figure 7-19 shows one sample.
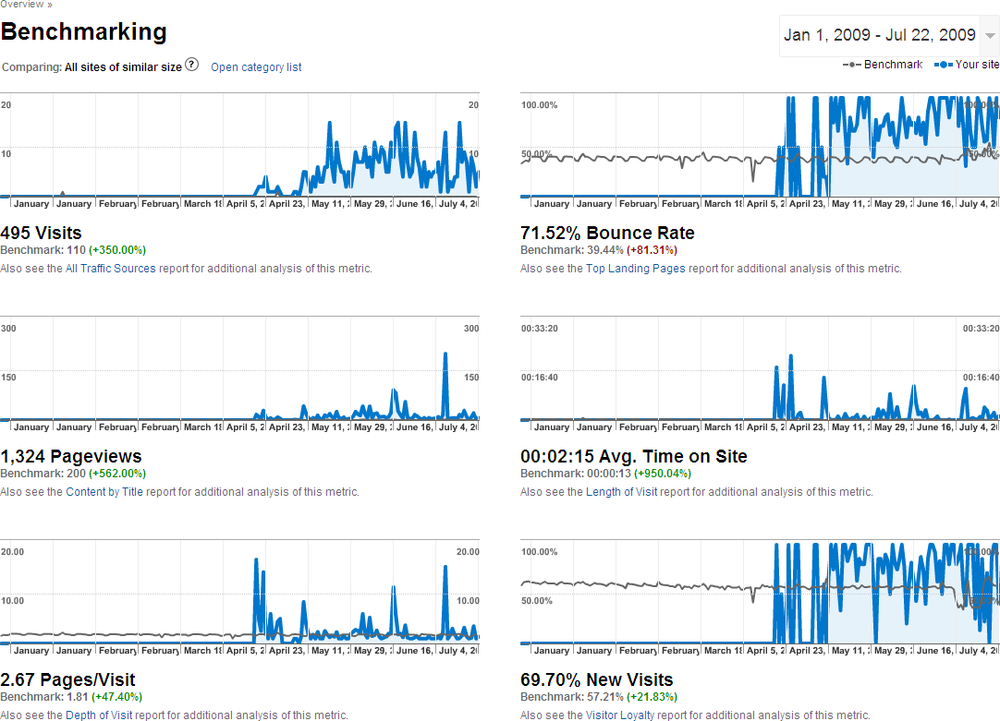
As you can see from Figure 7-19, the metrics used when benchmarking include the number of visits, site bounce rate, number of page views, average time visitors spent on the site, number of pages viewed per visit, and percentage of new visitors. Benchmarking is available only if you agree to share your data with Google and make your data available to others as part of Google’s combined vertical market data for your market. It typically takes two weeks for benchmarking data to appear after it has been enabled.
Map Overlay page
On the Map Overlay page, you can see a world map mashed up with your visitor stats. Just below the map you will see a list of countries and the corresponding number of visitors originating from a particular source country.
New versus returning visitors
The “New vs. returning” page shows a breakdown of new and old visitors. You can compare the two metrics by viewing the generated pie graph. We will discuss the topic of goals and conversions later. For now, know that if you have defined any goals, they will show up on this page, broken down by old and new visitors, under the “Goal conversion” tab.
Languages
The Languages page is similar in style to the preceding two pages. You get a table listing of languages sorted by popularity. As before, you can also see this sort of breakdown under the “Goal conversion” tab.
Visitor trending
The “Visitor trending” menu option opens another set of submenu options, including those for absolute unique visitors, page views, average page views, time visitors spent on the site, and bounce rate. All of these submenu items produce pages with historical (per-day) listings.
Visitor pages
The “Visitor loyalty” menu item opens with a secondary menu offering different options including visitor loyalty, visitor recency, length of visit, and depth of visit. The “Visitor loyalty” screen shows the number of repeat visits.
The “Visitor recency” page is concerned with previous visits and will tell you when the last visit occurred. The “Length of visit” page shows a breakdown of all visits based on length of time, and the “Depth of visit” page shows a similar breakdown per page view.
Traffic Sources
The Traffic Sources section shows the various views pertinent to your website traffic. Figure 7-20 is a portion of the Traffic Sources Overview page.
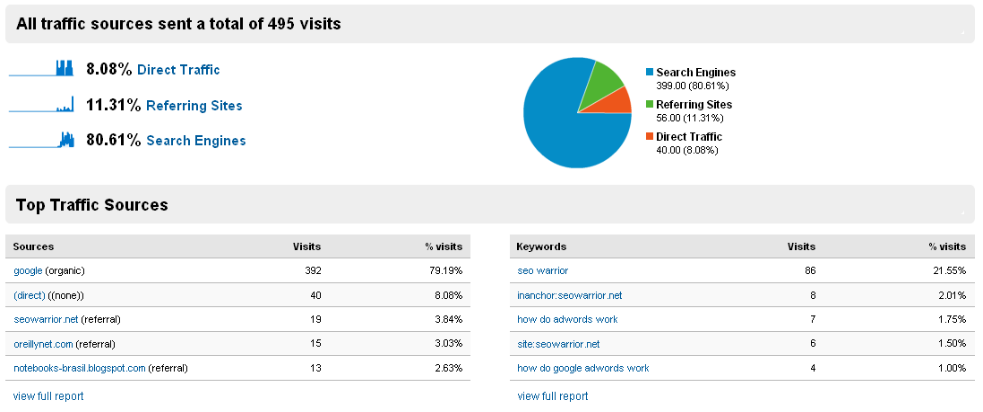
On this page, you can see a summary of your inbound traffic. This includes direct traffic, search engine traffic, and referring sites traffic. The top part of the page shows this type of information.
The bottom part of the page is divided into two tables. The table on the lower left shows a summary of your main sources of traffic. The table on the lower right shows the pertinent keywords bringing the traffic.
The submenu options under the Traffic Sources main menu item include pages that show segregated views of traffic. If you are using Google AdWords, you will see the options relevant to AdWords paid ad traffic. Other SEM networks can have tagging included in the destination URLs so that they also show up as paid ads in Google Analytics.
Content
In the Content section, page views are one of the important metrics. In the Overview page, you can see a summary similar to the one in Figure 7-21.
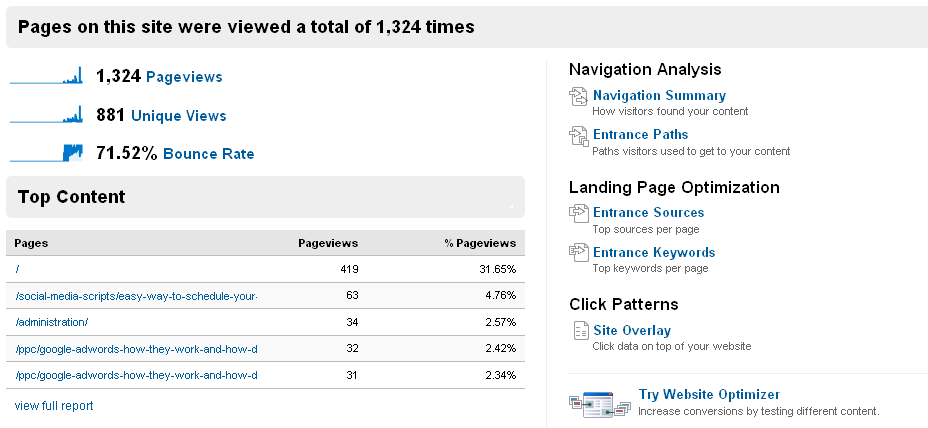
At the top-left corner, you can see several different summary metrics, including the number of page views, number of unique visitors, and percentage bounce rate. On the righthand side you can see several links in relation to navigation analysis, landing page optimization, and click patterns.
At the bottom-left corner you can see your top performing pages. You can see the relative URL path along with the number of page views and corresponding percentage page views.
The submenu options under the Content menu item include pages that show segregated views of your content. One of the most interesting options is the site overlay, which displays another browser window with your site shown as a mashup augmented by Google’s statistical data. If you hover your mouse pointer over any of your internal links, you will see a tool tip showing statistical data regarding your visitors’ clicks and goals.
Goals
Perhaps one of the most important features of Google Analytics, goal reports can help you keep track of your visitor conversions. Before you can view the goal reports (using the Goal submenu items), you will need to have some goals defined. The following subsection explains how you can create your goals.
Defining goals
To define your conversion goals, click on the Analytics Settings link on the top-left corner of the Google Analytics screen, and then click on the Edit button for the desired profile (site). You should see a screen similar to the portion shown in Figure 7-22.
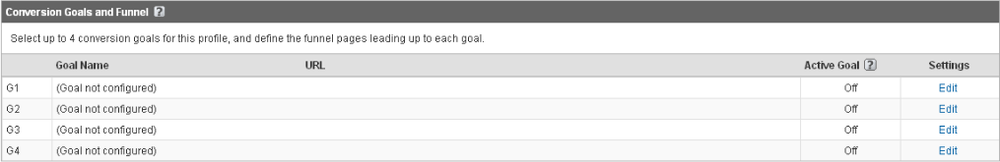
You can define four different goals for each profile. In this case, you should click on the Edit link as shown in Figure 7-23. You should then see the screen in Figure 7-24, shown later in this chapter.
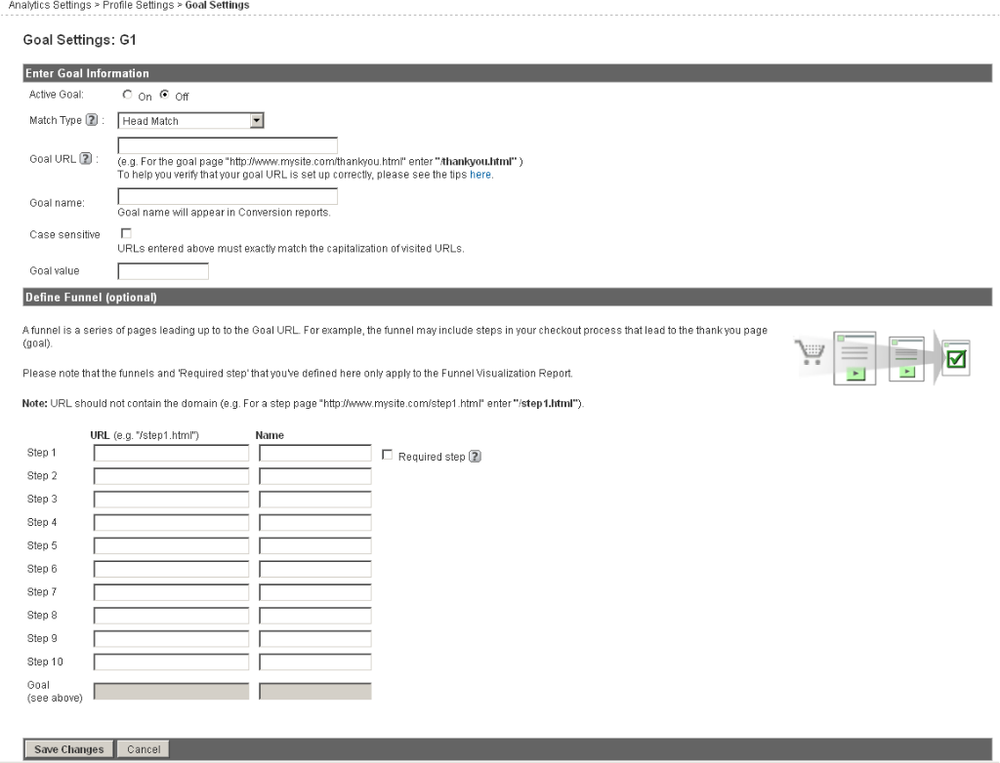
Filling out the top portion of the form is mandatory. Let’s examine those details first. There are several key fields. The first field allows you to make the goal active or inactive. Since this is a new goal, select the On radio button.
The next field, Match Type, has three options: Exact Match, Head Match, and Regular Expression Match. Exact Match implies identical URLs of the target goal page and the one you specify in this form. Head Match implies a partial match (useful for dynamic URLs).
If the URL you specify in this form matches any part of a user’s URL, the goal condition will have been met. The situation is similar with a regular expression match. If the expression matches the user’s URL, you have your goal condition (conversion).
Regular Expression Match is the most powerful of the three match types. For more information, review the Google guide at http://bit.ly/1QUZyZ.
Moving down the form we get to the “Goal URL” field. In this field you enter the destination (conversion) URL based on the previous field (match type). For the simplest case, just add your goal (relative or absolute) link. Make sure your match type is set to Exact Match.
The next field is “Goal name.” You can enter any name that makes sense for your particular goal. For example, if your goal is for people to sign up for your email newsletter, you can enter “Email Newsletter.”
Moving farther down we get to the “Case sensitive” field. By default, the URL characters are case-insensitive. If you wish to change that, check this option to enable case sensitivity.
The last field, “Goal value,” allows you to add a particular (e.g., monetary) value to the goal. If you are not sure what to add, you can just leave it at zero. How you define your conversion value depends entirely on your site. If you are selling an e-book product, for instance, you could put the e-book’s price as your goal value.
Defining funnels
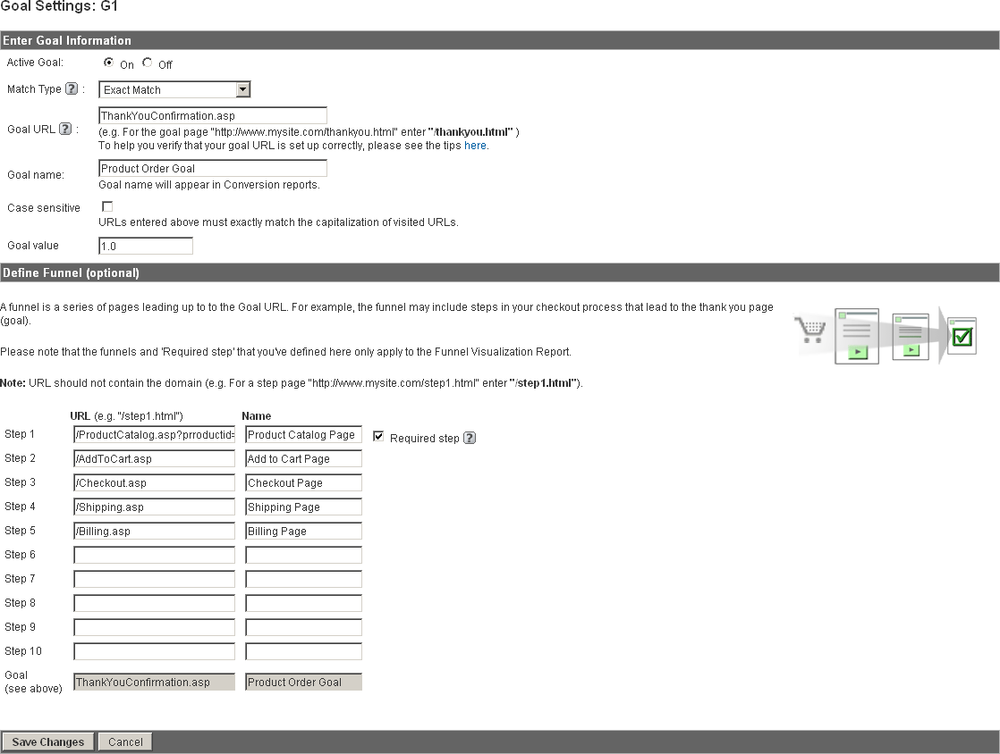
What is a funnel? A funnel is an ordered set of pages leading to a goal page. Let’s suppose you are an online retailer and are selling different products. The following code fragment illustrates the typical order of operations on your site, starting from browsing for products:
/ProductCatalog.asp?prroductid=1234& (Product Catalog Page)
/AddToCart.asp                       (Add to Cart Page)
/Checkout.asp                        (Checkout Page)
/Shipping.asp                        (Shipping Page)
/Billing.asp                         (Billing Page)
/ThankYouConfirmation.asp            (Purchase Order Goal)
You could use this exact sequence when creating your funnel. Once you set it up, you can view reports to see whether all people went from the first step to the last or whether some people changed their minds in the middle of your funnel sequence.
If some people changed their minds, you can then research why this could be the case. For example, some people may not like your shipping rates, whereas others may not like your billing options. Figure 7-24 illustrates how this would look in a complete form.
Viewing goal stats
You can see all the things we discussed in the preceding subsections related to goals and funnels by using the submenu options under the Goal main menu item: namely, Total Conversion, Conversion Rate, Goal Abandoned Funnels, Goal Value, and Funnel Visualization. Note that the Goal Abandoned Funnels feature is being phased out.
Google Analytics Shortcomings
Although the Google Analytics platform continues to improve, it is still not perfect. Many times you need to use different workarounds to get what you want. The following subsections illustrate some of these shortcomings.
Based on JavaScript
Because it is based on JavaScript, Google Analytics is not 100% accurate. JavaScript resides in HTML pages. All of your other files, including image, video, and audio files, are not supported out of the box. You typically need to create some sort of workaround. For more information on tracking your file downloads with Google Analytics, visit http://www.google.com/support/googleanalytics/bin/answer.py?answer=55529.
Furthermore, Google Analytics will not record any data on devices that do not support, or that disable, JavaScript. Many mobile devices fall into this category. Including Google Analytics code in every HTML file creates a bit of overhead. To speed up screen rendering, many mobile devices will ignore the JavaScript by intent or by user selection.
Metrics accuracy
No tool is perfect. Although Google Analytics provides lots of cool metrics, its accuracy is questionable at best. For example, how does Google calculate the average time a visitor spent on a site? Let’s suppose there are only two pages on a website. The user arrives on the first page, reads the page, and then moves off to the second page. How does Google know whether the user read the second page? What if the user moved away from the computer, came back 30 minutes later, and then returned to the first page? You can see how this metric could be skewed, and this is only one scenario.
Now let’s consider the bounce rate. Again, it sounds like a great metric, telling you the number of users who come to the first page of the website and then leave. But what if a user comes to a single-page site? The user goes to this site, reads the page copy, and leaves 10 minutes later. Does this indicate a user who did not find what he was looking for?
Although Google Analytics is great at many things it does, it is far from perfect. You can accomplish everything Google Analytics does and more with old-fashioned web server logs and a solid third-party analytics tool. Web server logs do not lie or report inaccurate data.
Google Analytics does have its benefits, as it is (almost) live and can be accessed from anywhere. With Google’s integration of Analytics with its other flagship platforms, the reasons for joining Google Analytics are plentiful.
Summary
In this chapter, we covered two of the most important Google tools: Google Webmaster Tools and Google Analytics. You can leverage both when auditing sites. Marketers like using Google Analytics due to its conversion tracking and comprehensive reporting features. As a rule of thumb, it would be best to use at least two different tools of this type to make intelligent SEO decisions.