
One picture is worth 1,000 words. | ||
| --Unknown | ||
Ever since the early days of the Web, HTML has supported images on web pages. However, we’ve had to limit ourselves to primitive, static bitmap files. As you may or may not know, bitmap files are somewhat inefficient because they describe images using thousands of little rectangles called pixels. Although bitmaps are necessary for photo-realistic images, a type of graphic approach known as vector graphics is actually much more efficient for many kinds of web graphics. If you’ve ever watched a Macromedia Flash animation or visited a web site built in Flash, you already have some idea of what vector graphics can do. There are a few vector graphics file formats supported on the web, including Flash, but XML makes it possible to construct vector graphic images directly on web pages using straight XML code. Using a plug-in such as Adobe’s SVG Viewer, web browsers are able to process SVG (Scalable Vector Graphics) images just as they do bitmap images such as GIF, JPEG, and PNG images.
As with any promising new web medium, SVG defines new spaces for development and creativity. Unlike other static image formats, an SVG-format image is scriptable; it can be referenced and manipulated with JavaScript and other scripting languages. You could, for example, customize the text in an SVG graphic so that it is displayed in whatever language the browser specifies. You could also process a database of map information from a web page and construct a graphical map as an SVG image. And talk about graphics capabilities! Photoshop and Illustrator enthusiasts will be impressed at the range of features SVG offers. Besides the basic shapes, colors, and strokes, you can take advantage of animation, clipping, masking, and gradient capabilities—all in a text file!
Needless to say, I could fill a book with everything you can do with SVG. But for the next hour, you’ll explore the rudiments and just a couple of the more advanced features. This includes the following:
Why to use SVG
How to configure your browser to handle the SVG format
The basics of shapes, lines, and colors
Placing text on a path
Rotating a shape
Those who have worked with drawing programs will have a good frame of reference for the material that follows, but readers new to computer graphics will also find this an easy entry point.
SVG is an XML application designed for the creation of vector graphics. It was created by the World Wide Web Consortium with the collaboration of industry players like Adobe. For a thorough treatment of SVG, its specifications, supporting documents, and related products, please see the W3C and Adobe Web sites:
The current SVG specification is version 1.1, although version 1.2 is in the works. The current version of Adobe’s browser plug-in is 3.0. The SVG Viewer browser plug-in is a free download that you can get from Adobe’s web site (mentioned above).
Before getting into the details of SVG, it’s worth asking the question “what are vector graphics?” First of all, keep in mind that the idea behind all graphics technologies is to describe the appearance of a graphical object using some kind of inherently non-graphical scheme. The specifics of each scheme used to represent a graphical object are ultimately what determine the differences between graphics formats. Though not necessarily superior to bitmap, or raster, graphics, vector graphics have several characteristics that make them just the right tool for the job in many circumstances.
A bitmap image file is a list of instructions on how the monitor or printer should render each rectangular dot, or pixel, that comprises an image. If an image measures 64 × 64 pixels, that means a total of 4,096 separate instructions, each with its own recipe of red, green, and blue components. And this is a tiny icon-sized graphic! Although it is very accurate at representing complex images, such as photographs, bitmap technology results in very large image files—slow to transmit, tedious to edit, and very difficult to interact with dynamically. On the other hand, they remain the tool of choice for photographs and other images where subtle gradations of tone are critical.
Vector graphics are the result of mathematical equations instead of thousands of pixels. SVG stands for Scalable Vector Graphics—a somewhat redundant term because vector graphics are scalable by definition. They are composed of a series of mathematical equations that describe graphics objects. So, for instance, if you wanted to draw a red circle, you would simply specify the center point, the radius, and the color, and SVG takes care of the details of rendering the red circle on the screen. The actual pixels that go into drawing the circle are irrelevant to SVG. To modify your drawing, you’d simply go in and change the parameters of the graphical objects being drawn. To modify the same picture with bitmap technology, by contrast, you would have to change the instructions for every pixel affected, up to thousands or millions. Because vector graphics are represented by mathematical equations, as opposed to pixels, they can be easily transformed and scaled while retaining a high level of quality. If you zoom in or blow up a vector graphic image, it will look much, much better than a zoomed or blown up bitmap equivalent.
In the desktop and print world, Adobe Photoshop, which produces mainly bitmap graphics, and Adobe Illustrator, which handles vector formats, typify the two different graphics approaches. They are also referred to as painting and drawing applications, respectively. It is worthwhile to note that, although you can create SVG files in any text editor (like any other XML file), many current graphics programs offer the capability of exporting an image to SVG without the need to get involved with the code. Please see the section “Creating an SVG Drawing” later in this hour for further discussion.
Revolutionary as SVG is, it is not alone in its class of web-based vector graphics applications. Microsoft’s short-lived VML (Vector Markup Language) is another XML-based solution, and Flash is a very successful proprietary format with capabilities comparable to SVG. Although Flash has enormous support across the Web, SVG is the vector graphics format being touted by the W3C, which means that it stands a good chance of eventually becoming the web standard for vector graphics. Two other developments that assist SVG in becoming a more widely supported standard are SVG Tiny (SVGT) and SVG Basic (SVGB), which are aimed at bringing SVG support to devices with more limited processing, memory, and display capabilities, such as handheld computers and mobile phones.
Ever loyal to its longstanding tradition of “my way or the highway,” Microsoft developed its own XML application for creating graphics: VML, or Vector Markup Language. Its main advantage—at least, for existing Microsoft customers—was that it is well-integrated with Microsoft Office 2000 products. Hence, you could use the drawing tools in Word, Excel, or PowerPoint without having to leave your current workspace. Unfortunately for VML, it was never latched onto by users and ultimately gave way to SVG as the desire to have a standardized, open vector graphics format proved to be more appealing than a solution tied to Microsoft.
Macromedia Flash provides a WYSIWYG environment for the creation and editing of vector graphics in the proprietary SWF format, with a sophisticated specialty in motion graphics. Web sites featuring Flash graphics—stunning but at times bandwidth hungry—have become quite popular and in many ways put the Web on par with television as a venue for complex and compelling animations. If nothing else, Flash has served as an excellent vehicle for delivering slick, interactive banner ads; like them or not, banner ads owe a great deal to Flash for their pizzazz. Although Flash covers the full range of SVG capabilities, its main focus is animation, and it might be considered overkill for simpler purposes. The other big distinction between Flash and SVG is that Flash relies on a proprietary binary file format, which means you can’t just open up a Flash movie as a text file and view or modify it. It also means you can’t generate Flash movies dynamically with script code as you can with SVG. Of course, SVG doesn’t ship as a sophisticated development tool that allows you to put together complex animations with relative ease, which is Flash’s forte.
By the Way
It is technically possible, albeit not entirely straightforward, to convert a Flash animation in the SWF format to an SVG document. Check out Steve Probets’ Flash to SVG Converter at the following web site to learn more about how this is done: http://www.eprg.org/~sgp/swf2svg.html.
Seeing as how mobile devices are increasingly becoming the focus of online development efforts, it really should come as no surprise that SVG has been repurposed for such devices. In fact, there are two different flavors of SVG available for mobile devices: SVGT and SVGB. SVGT (SVG Tiny) is a dramatically scaled down version of SVG that targets extremely constrained mobile devices such as mobile phones. SVGB (SVG Basic) isn’t as limited as SVGT, and is designed to support more powerful mobile devices such as handheld computers and PDA (Personal Digital Assistants).
As is the case with most XML-based languages, there are some housekeeping issues associated with SVG that you must know about before diving into the creation of SVG documents. Following are some key pieces of information related to SVG that are helpful to know as you begin learning more about the SVG language:
SVG has four different DTDs (Document Type Definition), which are declared as follows:
<!DOCTYPE svg PUBLIC "-//W3C//DTD SVG 1.0//EN"
  "http://www.w3.org/TR/2001/REC-SVG-20010904/DTD/svg10.dtd">
<!DOCTYPE svg PUBLIC "-//W3C//DTD SVG 1.1//EN"
  "http://www.w3.org/Graphics/SVG/1.1/DTD/svg11.dtd">
<!DOCTYPE svg PUBLIC "-//W3C//DTD SVG 1.1 Basic//EN"
  "http://www.w3.org/Graphics/SVG/1.1/DTD/svg11-basic.dtd">
<!DOCTYPE svg PUBLIC "-//W3C//DTD SVG 1.1 Tiny//EN"
  "http://www.w3.org/Graphics/SVG/1.1/DTD/svg11-tiny.dtd">
The SVG namespace is http://www.w3.org/2000/svg.
For server considerations, the MIME type for SVG is
image/svg+xml.
The SVG DTDs are important for SVG document validation. The first DTD is for the original version of SVG, 1.0, while the latter three DTDs refer to different variations of SVG 1.1. More specifically, the latter three DTDs refer to the full version of SVG 1.1, the basic version of SVG 1.1 (SVGB), and the tiny version of SVG 1.1 (SVGT), respectively. Although the DTDs are all important for SVG document validation, the SVG namespace is necessary for using elements and attributes within the SVG language. The SVG MIME type isn’t quite as critical and really enters the picture only from a web-server perspective when SVG documents are being served to web browsers.
As with all XML documents, SVG documents are required to have a root element, which in the case of SVG is the svg element. Beneath the SVG element is where you place specific SVG content consisting of additional SVG elements and attributes. There are three fundamental types of graphical objects that can be used within SVG drawings:
Primitive vector shapes (squares, circles, and so on)
Vector text
External bitmap images
Vector shapes are what you might typically think of as traditional vector graphics objects, with examples including lines, squares, circles, and so on. Additionally, you can include vector text, which is basically any text rendered in a mathematical font, such as a TrueType font. To style vector text, SVG makes use of CSS (Cascading Style Sheet) attributes. Please see Hour 9, “XML Formatting Strategies,” and Hour 10, “Styling XML Content with CSS,” for more information about using CSS to create style sheets and the section in this hour, “Drawing Shapes with SVG Child Elements,” for specifics of style rule names and functions that have been adapted for use in SVG.
To render graphics on a page or monitor, a graphics application must refer to a system of coordinates that determines the size and units of measurement associated with the drawing surface. SVG supports a few different systems, depending on your specific needs. By default, SVG measures its drawing surface in arbitrary “non-dimensional local units.” Whereas some shapes can be defined by pixels (px), points (pt), inches (in), or centimeters (cm), other elements can be described only in abstract units, which the browser maps to pixels on the screen. When you don’t specify real-world units of measurement—for instance, when you say r="50" to indicate the radius of a circle—SVG uses these non-dimensional local units to determine how an object is drawn to the screen. Additionally, some graphical elements, like path and polygon, support only such units. If you need to work with real-world measurements, you must redefine the coordinate system, as discussed in the following section.
By default, the opening “canvas” of an SVG drawing is infinite, which means it has no width or height. It’s generally a good idea to set the size of the canvas using the width and height attributes of the root svg element. You learn how this is accomplished in the next section when you start assembling your first SVG drawing. In fact, let’s get started now.
As you now know, SVG is an XML-based markup language, which means that you create SVG documents in a text editor (or XML editor) using markup tags. The astute observer may well ask, “Isn’t it much easier for a user to create an image in a graphics application than in a text editor?” The answer, of course, is “yes.” The latest versions of all of the major drawing programs do allow you to create SVG files, and even SVGZ, the compressed variety of the format. Moreover, Adobe Illustrator offers an SVG Interactivity Palette that enables you to wire various JavaScript actions to selected parts of your image. What more could you want?
Before you put away this book and go the graphical route, let me clarify that there are reasons it might be worth your while to learn the SVG language:
You may not want to invest in an expensive drawing application, or may not have one handy.
WYSIWYG tools are great, but there’s nothing like getting down and dirty with the code for ultimate control. You can always create a graphic in a drawing application and edit as needed in the raw SVG file.
For collaborative projects, an image’s SVG file will be more readily accessible from the web site than the original, say, Illustrator file.
You may need to generate SVG code on the fly or import SVG code into an application, which means you need to understand how the SVG language works.
By the Way
Another popular drawing application that supports SVG is CorelDraw from Corel, which is available in a Windows version. Batik, from the makers of Apache, is a dedicated Java-based SVG editor and viewer, available at http://xml.apache.org/batik. Microsoft has even jumped on the SVG bandwagon by supporting SVG in Visio, which allows you to import and export flowcharts using SVG. And finally, OpenOffice, the open source office application suite, supports SVG in its vector-based Draw application. To learn more about OpenOffice, visit it online at http://www.openoffice.org/
Before getting started creating SVG documents, it’s a good idea to have a browser or viewer set up to check your work as you go. There are essentially three ways to view an SVG document:
Web browser with native support
Web browser with a plug-in
Dedicated SVG viewer
Opera was the first major browser to offer built-in support for SVG, as it added support for SVGT in version 8 (http://www.opera.com/). Support for SVG is also slated for inclusion in the next major Firefox web browser, version 1.1. There is still no word on which direction Microsoft will go in supporting SVG in future releases of Internet Explorer. Fortunately, you can use Adobe’s SVG Viewer plug-in if your browser of choice doesn’t yet support SVG natively. There is one other SVG-compatible browser that I haven’t mentioned. I’m referring to the Amaya browser and editor, which is a “reference” browser offered by the W3C that provides native support for viewing SVG documents. You can download Amaya from http://www.w3c.org/amaya.
Adobe’s SVG Viewer plug-in is available for free download at http://www.adobe.com/svg/. Until SVG is more widely accepted natively in popular browsers, I encourage you to download and use the latest version of Adobe’s SVG viewer.
Every SVG document begins with the root element, which is svg. The svg element has many attributes and children, the most fundamental of which are described throughout this section.
The width and height elements describe the size of the drawing canvas. If no width and height elements are specified, the canvas is assumed to stretch infinitely in both dimensions. You can define these dimensions in a number of real-world units, including inches (in), centimeters (cm), points (pt), or pixels (px). Or, you can specify a percentage of the display window. If you don’t indicate a unit of measurement, SVG defaults to non-dimensional local units, an arbitrary designation that it maps as it sees fit to your monitor’s pixels, and displays the image at 100% of the available window space.
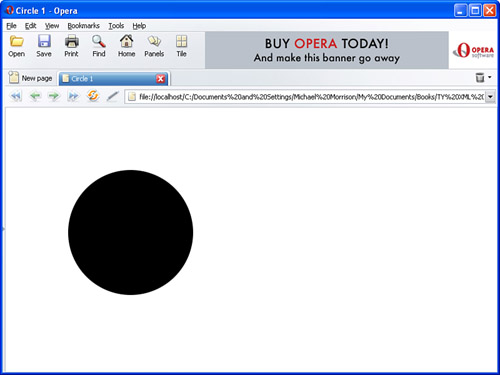
SVG borrows the title element from HTML to provide a means of assigning a title to SVG documents. Listing 6.1 shows a basic SVG document with a circle element that uses the attributes r, cx, and cy to define the circle, which you learn about shortly.
Example 6.1. A Basic SVG Document That Creates a Circle
1: <?xml version="1.0" encoding="UTF-8"?>
2: <!DOCTYPE svg PUBLIC "-//W3C//DTD SVG 1.1//EN"
3:   "http://www.w3.org/Graphics/SVG/1.1/DTD/svg11.dtd">
4:
5: <svg xmlns="http://www.w3.org/2000/svg">
6:   <title>Circle 1</title>
7:   <circle r="100px" cx="200px" cy="200px"/>
8: </svg>
Figure 6.1 shows this document as viewed in the Opera web browser. Because no width or height is specified for the canvas, the canvas is assumed to extend infinitely, and therefore no bounds are placed on the drawing surface.
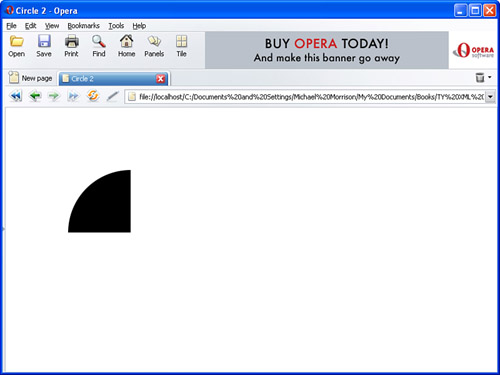
The width and height attributes define the space available to place your graphic. By setting the width and height attributes, you control the available drawing surface (see Listing 6.2).
Example 6.2. An SVG Document with the Width and Height Set
1: <?xml version="1.0" encoding="UTF-8"?>
2: <!DOCTYPE svg PUBLIC "-//W3C//DTD SVG 1.1//EN"
3:   "http://www.w3.org/Graphics/SVG/1.1/DTD/svg11.dtd">
4:
5: <svg xmlns="http://www.w3.org/2000/svg" width="200" height="200">
6:   <title>Circle 2</title>
7:   <circle r="100px" cx="200px" cy="200px"/>
8: </svg>
Figure 6.2 shows how the width and height of the canvas in this document aren’t sufficient to allow the entire circle to fit. On the other hand, if you wanted to draw only a quarter circle, this is one way to do it.
As you just learned, the circle element is used to create circles in SVG, which are one of many graphical shapes supported in SVG. These primitive graphical shapes are associated with elements in the SVG language that appear as child elements within the root svg element. Examples of such shapes include circles and rectangles, user-defined shapes like polygons, and text. The next few sections introduce you to the elements and attributes that make it possible to create graphical shapes in SVG.
The rect element is used to create rectangles, and is described with four attributes:
x— The horizontal coordinate, measured from an origin point of the upper-left corner of the display spacey— The vertical coordinate, measured from an origin point of the upper-left corner of the display spacewidth— The horizontal dimension of the rectangle, parallel to the x axisheight— The vertical dimension of the rectangle, parallel to the y axis
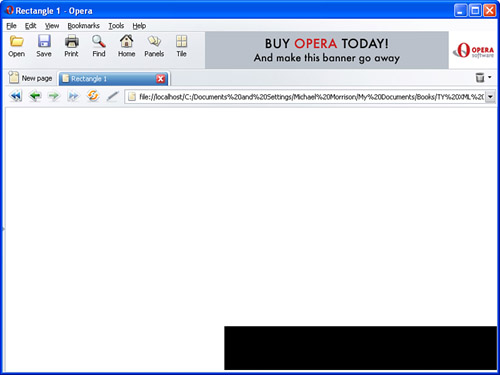
Listing 6.3 contains an example of a rect element, which illustrates the usage of the x, y, width, and height attributes.
Example 6.3. A Simple SVG Rectangle
1: <?xml version="1.0" encoding="UTF-8"?>
2: <!DOCTYPE svg PUBLIC "-//W3C//DTD SVG 1.1//EN"
3:   "http://www.w3.org/Graphics/SVG/1.1/DTD/svg11.dtd">
4:
5: <svg xmlns="http://www.w3.org/2000/svg">
6:   <title>Rectangle 1</title>
7:   <rect x="350" y="350" width="450" height="70"/>
8: </svg>
This code results in the shape shown in Figure 6.3.
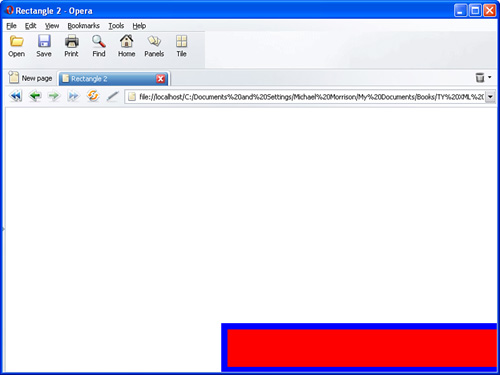
Keep in mind that you can use CSS styles in conjunction with the style attribute to jazz up shapes in SVG. Listing 6.4 shows the same rectangle with a different fill color and outline stroke.
By the Way
You’ll learn more about fills, strokes, and stroke-widths in “Styling Shapes with CSS Style Properties” later in the hour.
Example 6.4. A Rectangle That Uses CSS for a Little More Style
1: <?xml version="1.0" encoding="UTF-8"?>
2: <!DOCTYPE svg PUBLIC "-//W3C//DTD SVG 1.1//EN"
3:   "http://www.w3.org/Graphics/SVG/1.1/DTD/svg11.dtd">
4:
5: <svg xmlns="http://www.w3.org/2000/svg">
6:   <title>Rectangle 2</title>
7:   <rect x="350" y="350" width="450" height="70"
8:     style="fill:red; stroke:blue; stroke-width:10"/>
9: </svg>
Figure 6.4 shows the new and improved colored rectangle.
Should you need a rectangle oriented at an oblique angle, you have a choice of creating one with the polygon element, described in a moment, or of performing a transformation on the basic rect element.
You’ve already learned about the circle element, which has three required attributes:
cx— The x coordinate of the centerpoint of the circlecy— The y coordinate of the centerpoint of the circler— The radius of the circle in real-world units of measurement or in non-dimensional local units
Remember that the x and y coordinates are measured from the upper-left corner of the display space. Thus, for circles and ellipses, it’s important to place the center point far enough into the display space to avoid truncating it, as shown earlier in Figure 6.2.
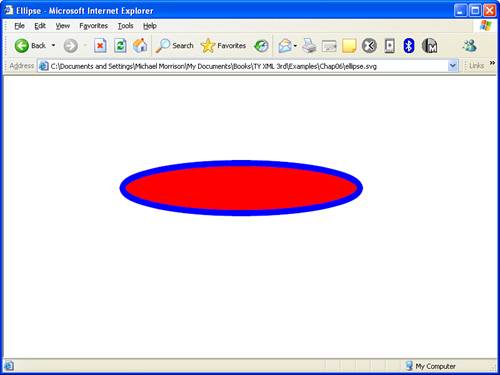
An ellipse is a circular shape whose width and height aren’t equal, which gives it the appearance of a stretched circle. The ellipse element has four required attributes:
cx— Horizontal coordinate of the centerpoint of the ellipsecy— Vertical coordinate of the centerpoint of the ellipserx— The radius of the x-axisry— The radius of the y-axis
The two radii (rx and ry) for the ellipse element should give you a clue as to how an ellipse differs from a circle. Listing 6.5 shows an example of how to create an ellipse using the ellipse element.
By the Way
You can create a circle using the ellipse element by setting the rx and ry attributes to the same value. Of course, you could also use the circle element because that’s what it’s there for!
Example 6.5. A Simple SVG Ellipse
1: <?xml version="1.0" encoding="UTF-8"?>
2: <!DOCTYPE svg PUBLIC "-//W3C//DTD SVG 1.1//EN"
3:   "http://www.w3.org/Graphics/SVG/1.1/DTD/svg11.dtd">
4:
5: <svg xmlns="http://www.w3.org/2000/svg">
6:   <title>Ellipse</title>
7:   <ellipse cx="380" cy="180" rx="190" ry="40"
8:     style="fill:red; stroke:blue; stroke-width:10"/>
9: </svg>
Figure 6.5 shows the ellipse as viewed in Internet Explorer with the help of the SVG Viewer plug-in.
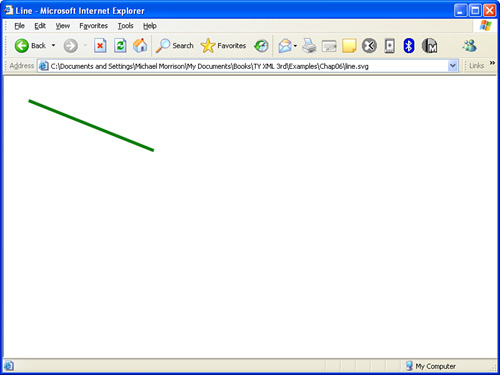
The line element speaks for itself in that it allows you to create lines; a line is defined by two connected endpoints. To define a line using the line element, you simply specify the coordinates of the two endpoints: (x1, y1) and (x2, y2). Listing 6.6 shows an example of how to create a line.
Example 6.6. A Simple SVG Line
1: <?xml version="1.0" encoding="UTF-8"?>
2: <!DOCTYPE svg PUBLIC "-//W3C//DTD SVG 1.1//EN"
3:   "http://www.w3.org/Graphics/SVG/1.1/DTD/svg11.dtd">
4:
5: <svg xmlns="http://www.w3.org/2000/svg">
6:   <title>Line</title>
7:   <line x1="40" y1="40" x2="240" y2="120"
8:     style="stroke:green; stroke-width:5"/>
9: </svg>
Figure 6.6 shows the results of this code as viewed in Internet Explorer.
It’s worth pointing out that you can use the line element to describe a polygon (a shape with multiple straight sides), but it is usually more economical to use the polygon element discussed in the next section or the path element, which is discussed a little later in the hour. The path element is interesting because it offers the capability of combining straight lines with arcs and Bezier curves in a single statement.
In addition to the simple graphical objects, such as circles, rectangles, and lines, there are also some additional shapes you can draw in SVG that are more flexible. I’m referring to shapes known as compound shapes, two of which are supported in SVG:
polygon— A closed figure consisting of an unlimited number of sidespolyline— An open figure consisting of an unlimited number of sides
A polygon is considered a compound shape because it combines an unlimited number of straight lines to create a closed figure. A polygon may be convex or concave, typified by the star and pentagon in Figure 6.7. If you’re creating shapes by hand as complex as those in the figure, it’s a good idea to block them out on graph paper before hacking out the SVG code.
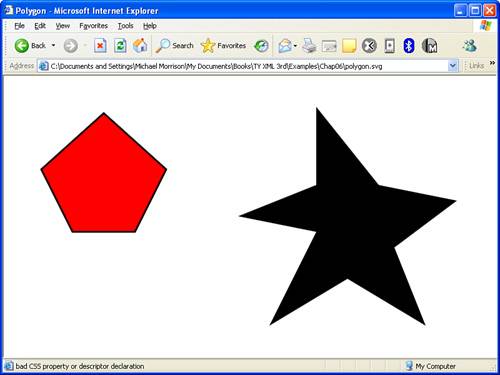
The polygon, no matter how elaborate, is described by sequential sets of x,y coordinates in its required points attribute. Listing 6.7 shows the code required to draw the star and pentagon shown in Figure 6.7.
Example 6.7. A Star and Pentagon Drawn Using polygon Elements
 1: <?xml version="1.0" encoding="UTF-8"?>
 2: <!DOCTYPE svg PUBLIC "-//W3C//DTD SVG 1.1//EN"
 3:   "http://www.w3.org/Graphics/SVG/1.1/DTD/svg11.dtd">
 4:
 5: <svg xmlns="http://www.w3.org/2000/svg">
 6:   <title>Polygon</title>
 7:   <polygon points="60,150 160,60 260,150 210,250 110,250"
 8:     style="fill:red; stroke:black; stroke-width:3"/>
 9:   <polygon points="500,50 600,175 725,200 625,275 675,400
10:     550,325 425,400 500,250 375,225 500,175"
11:     style="fill:red stroke:black; stroke-width:3"/>
12: </svg>
Notice in the code that a series of points are used to describe each polygon. For example, the pentagon is described by a series of 5 points (line 7), whereas the star is described by a series of 10 points (lines 9 and 10).
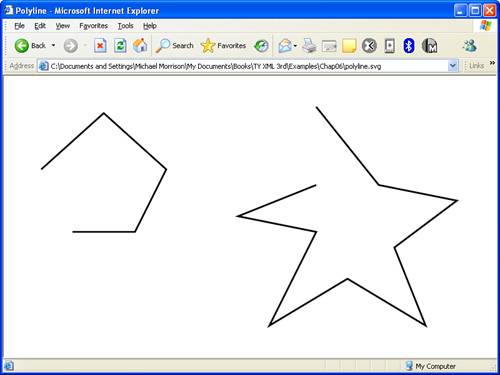
The polyline element is very similar to polygon, except there is no line drawn to close the shape. The reason for this is because polyline is used to create unclosed regions, which are shapes that don’t automatically close with a final line connecting the first and last points. The best way to understand how the polyline element works is to look at how the same coordinates from the polygon example appear when used in polyline elements (see Listing 6.8).
Example 6.8. The polyline Element Results in the Star and Pentagon Shapes Not Quite Materializing
 1: <?xml version="1.0" encoding="UTF-8"?>
 2: <!DOCTYPE svg PUBLIC "-//W3C//DTD SVG 1.1//EN"
 3:   "http://www.w3.org/Graphics/SVG/1.1/DTD/svg11.dtd">
 4:
 5: <svg xmlns="http://www.w3.org/2000/svg">
 6:   <title>Polyline</title>
 7:   <polyline points="60,150 160,60 260,150 210,250 110,250"
 8:     style="fill:none; stroke:black; stroke-width:3"/>
 9:   <polyline points="500,50 600,175 725,200 625,275 675,400
10:     550,325 425,400 500,250 375,225 500,175"
11:     style="fill:none; stroke:black; stroke-width:3"/>
12: </svg>
Figure 6.8 shows how the polyline element results in the star and pentagon shapes not being closed. It’s important to note that the fill color is set to none in this example (lines 8 and 11), which makes it easier to see the lines and the unclosed shapes. If the fill style was removed entirely, the shape would be filled with black by default, and you wouldn’t be able to make out the missing line.
As you’ve seen throughout the hour thus far, each child shape has its own unique attributes, which are required to describe its dimensions and other parameters. Additionally, they share CSS formatting properties, such as stroke, fill, and stroke-width, which are specified in the familiar CSS style attribute. These formatting properties make it possible to inject color into SVG drawings, as well as control the width of the lines used to draw different shapes. The common CSS properties used with SVG include the following:
stroke— The color of the outline of the shape, or in the case of a line, the substance of the line itself.fill— The interior color of the shape. Even thepolylineelement can take afillproperty; the viewer or browser draws an imaginary (invisible) line between the start and end points.stroke-width— The thickness of the stroke, often given in points.
By the Way
There are many, many more CSS formatting properties you can use with SVG. Please consult the CSS specification at http://www.w3.org/TR/REC-CSS2 for a full treatment.
The value of the stroke and fill properties is a color, either its text string name, as listed in the SVG specification, or the standard six-digit hexadecimal code following the # sign from what we know from HTML. These properties may actually be expressed as presentation attributes directly within the element definition, which means you use the property names directly as attributes of SVG elements, like this:
<circle...
  stroke="black" fill="white" stroke-width="2"/>
In this example, ... denotes content and other optional tags. This is a little different approach than what you’ve seen throughout the hour where the style attribute is used to group the CSS style properties together. Following is an example of how this latter approach works, which should be familiar to you from the examples you’ve already seen in this hour:
<circle...
  style="stroke: black; fill: white; stroke-width: 2pt"/>
There is one other approach you can use if you want to associate a set of common formatting properties with multiple SVG elements. I’m referring to the class attribute, which is used to associate a CSS style rule with an element. Assuming there is a style rule named goldenorb in a style sheet accessible by the SVG document, the following code shows how to apply the goldenorb style rule to a circle:
<circle...
  class="goldenorb"/>
Lest you think SVG isn’t capable of fancy graphical effects, let me share with you how to create radial and linear gradients, which is where a range of colors are used to fill graphical objects. Radial and linear gradients constitute a special case of a fill. radialGradient and linearGradient are two separate elements, but they function similarly. These elements define patterns rather than specific objects, and the patterns may be referenced to fill any shape anywhere in the document, or indeed, anywhere on the Web, as the reference is a URI. The SVG server refers to them—and other painting-type capabilities—as “paint servers,” or you can think of them as being like color swatches in a paint application.
The stop child element defines the transition point between one color and the next. For a linear gradient, the color changes proceed from left to right; with a radial gradient, it emanates from the center to the periphery of an imaginary circle. There is no limit to how many stops you can have. The following attributes are used to further describe a gradient stop:
offset— Property measures the distance—typically as a percentage of the available space—from the origin of the gradient to its outer limit.stop-color— Defines the color that begins at the transition point.fxandfy— Coordinates of the focal point of a radial gradient, identical tocxandcyby default.
The following code shows how to create a radial gradient that makes use of two stops to define the manner in which colors emanate from the center of an object:
<radialGradient id="gradient01" cx="300" cy="150" r="200" fx="250" fy="125">
  <stop offset="0%" stop-color="red"/>
  <stop offset="75%" stop-color="black"/>
</radialGradient>
One problem with this code is that it must be housed within another special element in order to be used by graphical objects in an SVG drawing. I’m referring to the defs element, which is the means by which you define “building blocks” to be used throughout a drawing. Following is how you place the gradient code within the defs element to make it accessible to elements in an SVG drawing:
<defs>
  <radialGradient id="gradient01" cx="300" cy="150" r="200" fx="250" fy="125">
    <stop offset="0%" stop-color="red"/>
    <stop offset="75%" stop-color="black"/>
  </radialGradient>
</defs>
Having defined this gradient within the defs element, you can reference it from other graphical objects to apply gradient fills by specifying the ID of the gradient in the CSS fill property, like this:
<ellipse cx="380" cy="180" rx="190" ry="40"
  style="fill:url(#gradient01); stroke:black; stroke-width:10"/>
Those who are familiar with path technology in Adobe Photoshop and Illustrator will be well ahead of the game when learning paths in SVG. A path is nothing but a connected set of points, straight or curved, that can be stroked, filled, transformed (see next section), edited point-by-point, transformed wholesale, or used as the baseline for a string of text.
The one required attribute of the path element is the d (data) attribute, which in turn contains values specifying the type of equation needed to establish the desired component of the path. This really does require the higher math it sounds like it needs, which is beyond the scope of this lesson. In real life, you would probably not attempt such a task with a mere text-editing tool but would rely on a graphics application. The concepts and their mapping, however, are quite simple, and worth becoming familiar with.
The following letters are mnemonics for the tasks they perform. The uppercase letter indicates an absolute positioning of coordinates on the grid, whereas its lowercase counterpart designates coordinates relative to the insertion point. Every path statement starts with an M/m to position the insertion point and a Z/z to announce the end of the task.
M/m: Establish these x, y coordinates as the starting point of the pathL/l: Draw a line from the current position to a specified pointH/h: Draw a horizontal line to the specified x coordinate, keeping the y coordinate the sameV/v: Draw a vertical line to the specified y coordinate, keeping the x coordinate the sameA/a: Draw an elliptical or circular arc from the current position to the specified pointC/c: Draw a cubic Bezier curve from the current position to the specified pointS/s: Draw a smooth cubic Bezier curve from the current position to the specified pointQ/q: Draw a quadratic Bezier curve from the current position to the specified pointT/t: Draw a smooth quadratic Bezier curve from the current position to the specified pointZ/z: Close the path—draw a straight line back to the first point
If you are not already a mathematician, you will probably not find it worth your while to learn (or re-learn, for those of us who learned and forgot it in high school) trigonometry and other forms of higher math just to create vector graphics. However, you may at some point find it useful to do a quick edit and tweak a value here or there, in which case it’s helpful to have some understanding of what’s before you.
Figure 6.9 shows a path created in Adobe Illustrator, and Listing 6.9 contains the SVG code underlying it. The arcane-looking notations for the d values are the fruits of differential calculus—very, very far beyond the scope of this lesson.
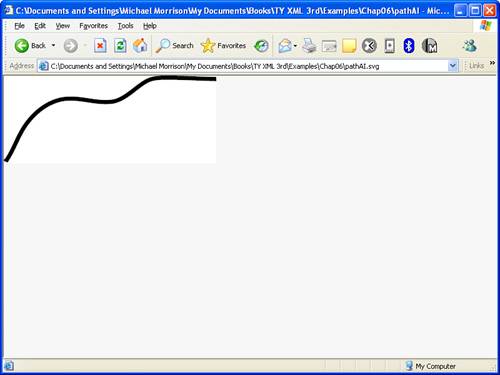
Example 6.9. Code for an SVG Path That Was Exported from Adobe Illustrator
 1: <?xml version="1.0" encoding="iso-8859-1"?>
 2:
 3: <!-- Generator: Adobe Illustrator 9.0.1, SVG Export Plug-In -->
 4: <!DOCTYPE svg PUBLIC "-//W3C//DTD SVG 20000303 Stylable//EN"
 5:   "http://www.w3.org/TR/2000/03/WD-SVG-20000303/DTD/svg-20000303-
 6:   stylable.dtd" [
 7: <!ENTITY st0 "fill:none;stroke-width:5.04;">
 8: <!ENTITY st1 "fill-rule:nonzero;clip-rule:nonzero;stroke:#000000;
 9:   stroke-miterlimit:4;">]>
10:
11: <svg width="254.989pt" height="104.255pt" viewBox="0 0 254.989 104.255"
12:   xml:space="preserve">
13:   <g id="Layer_x0020_1" style="&st1;">
14:     <path style="&st0;" d="M2.815,100.415c-0.147,0.822-0.159,1.598-0.354,
15:       2.401c9.705-13.879,14.356-30.552,24.381-44.408c9.544-13.191,
16:       22.468-24.158,38.313-28.809c21.493-6.308,43.011,4.355,64.516,
17:       1.717c15.429-1.893,28.255-17.305,41.55-24.599c8.506-4.667,
18:       17.982-4.18,27.42-4.185c18.782-0.011,37.527,1.272,56.301,1.606"/>
19:   </g>
20: </svg>
Text in SVG enjoys the benefits of both vector graphics and word-processed text. As a graphic, it can be filled, stroked, transformed, and more. As text, it can be modified by CSS’s standard text-formatting properties such as font-family, font-weight, as well as traditional properties such as bolding or underlining.
When I say “free-standing text” I mean text that is not connected to a path; I don’t mean free-floating. It’s worth making this distinction because it is possible to flow text along a path, which you learn about in the next section. As with most attributes, you specify the position of a text element with respect to the x and y axes. The text displays in the browser’s default font unless you apply other formatting.
By the Way
A wealth of formatting is available for text in SVG, all derived from the CSS Level 2 specification. For a thorough listing, please see http://www.w3.org/TR/REC-CSS2. Not all browsers fully support CSS Level 2, but you’ll find that most of the popular formatting properties are inherited from CSS Level 1, which are generally supported by all browsers.
Following is an example of how to use the text element to display a sentence as a graphical object:
<?xml version="1.0" encoding="UTF-8"?>
<!DOCTYPE svg PUBLIC "-//W3C//DTD SVG 1.1//EN"
  "http://www.w3.org/Graphics/SVG/1.1/DTD/svg11.dtd">

<svg xmlns="http://www.w3.org/2000/svg">
  <title>Just Text</title>

  <text x="40" y="100" font-family="palatino" font-size="36pt">
    The quick brown fox jumped over the lazy dog.
  </text>
</svg>
Figure 6.10 shows this code as viewed in Internet Explorer.
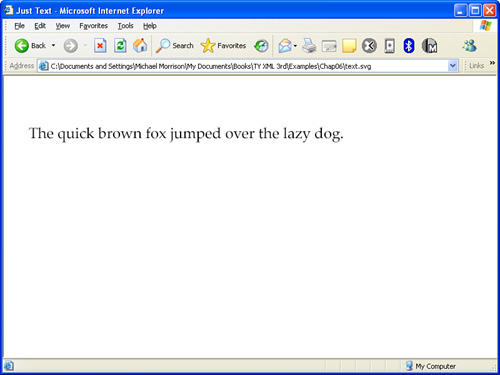
Although the SVG coordinate system starts at the top left, the starting point of the text string is the bottom left. This means if you start at 0, 0—or n, 0, for that matter—most of the text will be above the top boundary of the window, except for the descenders.
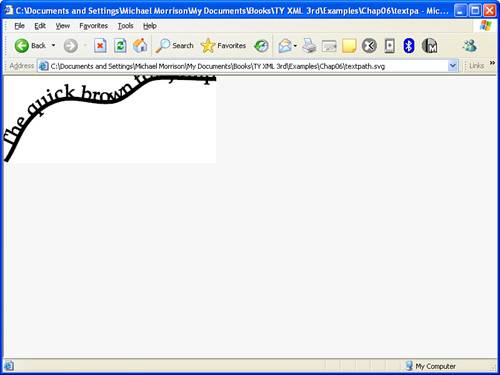
SVG also provides for text associated with a path, in which case the text is drawn along the path. The text and the path are created separately—that is, each in its own element statement—and joined together by an xlink:href attribute. To accomplish this, you give the path an id attribute, and reference it from the textPath element, which is a child of the text element.
Also, the xlink prefix needs to be mapped to the w3.org namespace. This can be done either on a containing element or on the textPath element itself. Listing 6.10 declares the xmlns attribute directly on the textPath element and references the path id as "path-demo" to associate the text with it. The stroke of the path disappears when you add text to the path in Illustrator, but we’re going to leave that issue alone for the moment. We give the path element the id “newPath,” and reference it from the textPath element that encloses the content.
Example 6.10. Text That Is Associated with a Path
 1: <?xml version="1.0" encoding="iso-8859-1"?>
 2:
 3: <!-- Generator: Adobe Illustrator 9.0.1, SVG Export Plug-In -->
 4: <!DOCTYPE svg PUBLIC "-//W3C//DTD SVG 20000303 Stylable//EN"
 5: "http://www.w3.org/TR/2000/03/WD-SVG-20000303/DTD/svg-20000303-
 6:   stylable.dtd" [
 7: <!ENTITY st0 "fill:none;stroke-width:5.04;">
 8: <!ENTITY st1 "fill-rule:nonzero;clip-rule:nonzero;stroke:#000000;
 9:   stroke-miterlimit:4;">]>
10:
11: <svg width="254.989pt" height="104.255pt" viewBox="0 0 254.989 104.255"
12:   xml:space="preserve">
13:   <g id="Layer_x0020_1" style="&st1;">
14:     <path id="newPath" style="&st0;" d="M2.815,100.415c-0.147,0.822-0.159,
15:       1.598-0.354,2.401c9.705-13.879,14.356-30.552,
16:       24.381-44.408c9.544-13.191,22.468-24.158,38.313-28.809c21.493-6.308,
17:       43.011,4.355,64.516,1.717c15.429-1.893,28.255-17.305,
18:       41.55-24.599c8.506-4.667,17.982-4.18,27.42-4.185c18.782-0.011,37.527,
19:       1.272,56.301,1.606"/>
20:     <text x="40" y="100" font-family="palatino" font-size="18pt">
21:       <textPath xlink:href="#newPath"
22:         xmlns:xlink="http://www.w3.org/1999/xlink">
23:         The quick brown fox jumped over the lazy dog.
24:       </textPath>
25:     </text>
26:   </g>
27: </svg>
In this example, the path exported from Illustrator that you saw earlier is first assigned an ID of newPath (line 14). The sentence of text is then associated with the path by using the xlink:href attribute within the textPath element (line 22), where the path ID is referenced. Once this is done, the text is drawn along the path, as shown in Figure 6.11.
Although you can view SVG documents directly in browsers that have the appropriate plug-in installed, you might prefer referencing an SVG drawing as part of a larger web page. To do so, you must embed a reference to the SVG document in an HTML document, where it is displayed in the context of the web page (see Listing 6.11).
Example 6.11. An SVG Document Embedded in an HTML Web Page
 1: <html>
 2: <head>
 3:   <title>A Great Shape</title>
 4: </head>
 5:
 6: <body>
 7:   <h1>A Great Shape</h1>
 8:     <embed width="600" height="600" src="Ellipse.svg" align="left"
 9:       pluginspage="http://www.adobe.com/svg/viewer/install/">
10: </body>
11: </html>
This code describes a web page that includes an SVG graphic much as you might include a bitmap image using the HTML <img> tag. Don’t forget that it will work only if the browser includes built-in support for SVG or if a suitable SVG viewer plug-in is installed in the browser. Let’s hope that this issue diminishes in significance as the major browsers begin adopting native support for SVG. Until then, you may want to encourage end users to download an SVG plug-in if you plan on serving web pages with SVG graphics.
By the Way
If this example seems a bit novel, allow me to point out that in Hour 17, “SAX: The Simple API for XML,” you learn how to translate raw XML data from any document into meaningful SVG graphics.
In this hour, you developed a good foundation in the basic shapes and components that constitute the SVG markup language. Although you explored only the most basic of SVG’s abilities, you’ve been introduced to the rudiments that will enable you to expand into advanced capabilities, such as transformations, links (like image mapping), clipping, and masking. This can serve two audiences: those with modest aspirations, who will be happy for the ability to create simple graphics with a text file, and those who want a glimpse at SVG’s underpinnings before embarking on outputting SVG files from a commercial drawing application. Regardless of which camp you fall into, you’re hopefully leaving this hour with a newfound appreciation for how XML is impacting the look and feel of the Web, not to mention your own web pages.
Can I use SVG to create an image on a Web page instead of using a GIF or PNG image file? | |
Yes, but keep in mind that the benefit to using SVG in this case is the ability to generate an image dynamically. If you are just displaying a static image on a Web page, then a GIF or PNG image will probably work better. However, if you do need to dynamically generate a vector image, then SVG is certainly your answer. | |
Is it possible to validate SVG documents? | |
Absolutely. Just make sure you’ve referenced the appropriate SVG DTD in your document, and then feed it to the W3C Markup Validation Service at http://validator.w3.org/. The online validator will use the DTD as the basis for validating the document against the requirements of the SVG language. |
The Workshop is designed to help you anticipate possible questions, review what you’ve learned, and begin learning how to put your knowledge into practice.