
8.1. Problem Articulation – Puzzling Dynamics of Oil Price
The long-term behaviour of oil price reveals striking contrasts between periods of price stability, mild price fluctuations, dramatic price surges and equally dramatic collapses. Figure 8.1 shows wellhead oil price in the USA spanning 135 years, from 1869 to 2004, a remarkably long time series. The vertical axis is on a scale from zero to 80 dollars per barrel in 2004 dollars. Lying behind this price trajectory is the turbulent history of the oil industry as vividly told in The Prize: The Epic Quest for Oil Money and Power (Yergin, 1991).
Between 1869 and 1880 there was extreme price volatility. This period corresponds to the early pioneering days of the oil industry in the Pennsylvania Oil Regions of the United States. The chaotic mix of speculators, fortune-seeking prospectors and their greedy exploitation of newly discovered reserves led to extraordinary periods of overproduction – too many wells and too much oil. The price trajectory in Figure 8.1 gyrates wildly, starting at $70 per barrel in 1869 and falling to only $15 per barrel in 1874. Over the next two years to 1876, the price rose dramatically to $40 per barrel before falling again to $15 in 1879. Then followed an interval of relatively low and stable oil price in the decade to 1889.
Figure 8.1. Historical oil price
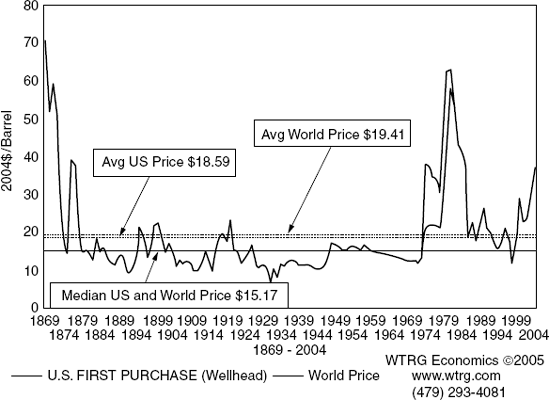
Source: WTRG Economics Copyright 2007. Reproduced by permission.
This shift to stability was imposed on the industry through the vision and will of John D. Rockefeller, founder of Standard Oil. His objective was to end what he described as a cut-throat policy of making no profits and instead make the oil business safe and profitable – by controlling supply and especially refining and distribution. The long-term results of Rockefeller's efforts are evident in the relative calm between 1889 and 1939, when the price moved in a range between $10 and $20 per barrel. There is some evidence of a short-term price cycle with an interval of about four years from peak to peak. Nevertheless, there is much greater price stability than in the pioneering early days. Rockefeller's era of supply discipline, ruthlessly imposed on a naturally chaotic industry and its fledgling markets, led to the rise of the integrated oil company and the enduring legacy of the 'Seven Sisters'. (The Seven Sisters is a term credited to Italian Enrico Mattei to describe the close association of the major oil companies: the four Aramco partners – Jersey (Exxon), Socony-Vacuum (Mobil), Standard of California and Texaco, together with Gulf, Royal Dutch/Shell and British Petroleum.)
In the post-war era from 1945 to 1970, this legacy and stable industry structure remained in place – almost unchallenged – even as the Seven Sisters expanded their operations internationally on the back of colossal oil reserves in the Arabian Peninsula. Despite these huge reserves, and the rapid expansion of oil output in the post-war era, prices were remarkably stable as Figure 8.1 shows. The price tranquillity was a far cry from the chaos of the Pennsylvania Oil Regions at the birth of the industry. Throughout this era, which spanned two and a half decades, supply and demand were in almost perfect balance – an astonishing achievement when one considers the complexity of the industry, its global reach, the diversity of stakeholders (encompassing producers, consumers and nations), and the array of objectives sought by these stakeholders from their share in the oil bonanza.
Already, however, new forces were at work, stronger even than the Seven Sisters, ushering in a new era of oil supply politics. As the locus of production moved to the Middle East, so the global political power of the region was awakened, feeding on western industrial countries' appetite for Arabian oil to sustain energy-intensive economies and lifestyles. Control over Middle Eastern oil was seized by the newly-formed OPEC – the Organisation of Petroleum Exporting Countries. In 1974, and again in 1978, OPEC exercised its power by withholding production and forcing up the price of oil. As Figure 8.1 shows, the price doubled and continued to rise to a peak of almost 70 dollars per barrel by 1979 – a peak not seen since the early days of the Pennsylvania Oil Regions. Hence, in the 1970s, after two decades of managed calm and predictability, chaos returned to global oil markets.
After 1978, price fell sharply to a value of only $20 per barrel in the mid 1980s. Since then, there has been instability reminiscent of the 1920s and early 1930s, attributed to regional wars, power struggles within OPEC, fears of shortage and extremes of weather. For more than 20 years there were no further upheavals to match the dramatic variations of the 1970s. As the turn of the century approached, oil price was stable and low. In fact, many industry observers at the time believed it would stay low for the foreseeable future. However, the industry proved them wrong. Price began to rise again in 2001, reaching more than $30 per barrel by 2004 and continuing upwards since then to more than $60 per barrel in 2006.
8.1.1. Towards a Dynamic Hypothesis
An explanation of price behaviour lies in the feedback processes that balance supply and demand in the global oil markets. Periods of price stability correspond to times in which supply and demand are more or less in balance. Price spikes in the 1860s and 1970s correspond to times in which demand greatly exceeded supply. The gentle price roller-coaster of the early 1900s corresponds to a period in which supply sometimes exceeds and sometimes falls short of demand, but never by much. The remarkable price stability of the 1960s corresponds to a golden age of perfect supply management.
Figure 8.2. Simple balancing loop with delay in the oil industry
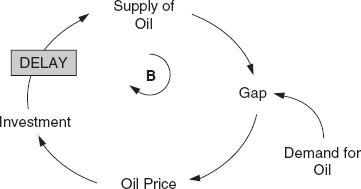
A useful template to begin conceptualisation of the oil industry is a balancing loop with delay as shown in Figure 8.2, the same as in Chapter 5's production and employment model, but this time conceived at the industry level and applying to upstream investment in oil rigs and platforms. Broadly speaking, if demand for oil exceeds supply then the gap (excess demand) leads to an increase in oil price that stimulates additional investment. After a delay of several years to open new oil fields, the supply of oil increases to eliminate the supply gap. Due to the long time delay in capacity expansion, it is difficult for the industry to achieve a balance of supply and demand and so oil price can be volatile. This explanation provides a preliminary dynamic hypothesis.
However, such a simple feedback loop by itself cannot explain the sustained price stability of the 1960s and 1970s. The corrective mechanism of capital investment, with its construction delay of at least five years, is simply not responsive enough to guarantee the near perfect balance of supply and demand that price stability requires. Equally, the invisible hand of balancing feedback alone cannot explain the wild price gyrations of the 1860s and 1870s, or the memorable price hikes of the 1970s. Reasoned commercial investment decisions should not result in oil famines and feasts with such extreme price movements. Obviously there are other feedback processes at work in the global oil system. Some must be fast-acting to prevent temporary imbalances and to short-circuit the inevitable time lags of commercial investment. Others must work to sustain imbalances, yet be powerful enough to override the natural balancing tendency of market forces and the invisible hand.