
10.7. Tests of Learning from Simulation
Simulations can achieve more than mimicking history. Like Papert's gears of childhood, a simulator is a transitional object to improve understanding through testing and reflection. With a simulator it is possible to conduct a wide range of experiments to better interpret past behaviour (as in the base case above), to explain surprise behaviour, to learn about future behaviour, to test pet theories and hypotheses and to correct faulty expectations. Whenever a model provides useful new insight (to the client or to the modeller) then it passes the test of learning from simulation. Some of the most common learning tests are described below.
10.7.1. Comparing Simulations with Expectations and Interpreting Surprise Behaviour
How will the future unfold if no changes are made to the conduct of the business? Managers have their own views and opinions on this question against which to compare simulations and invite discussion. The soap industry model was run five years into the future with the same parameters as in the base case to reflect the assumption that the firm's decision-making processes continue unchanged. This business-as-usual projection led to several insights deemed worthy of discussion. It showed that the retail price of bar soap will rise in the future. At first glance, this result is surprising because the bar soap business is price sensitive and highly competitive. On reflection there is a good explanation. The price rise is a response to increased manufacturing cost caused by falling sales volume and reduced scale economies in traditional bar soap production. The simulation also showed that growth in sales volume of liquid soap will be limited by three factors. First, the diminishing pool of bar soap users means that, as the new market becomes saturated, it will be more difficult to sustain the same conversion rate to liquid soap as in the previous five years. Second, the reaction of competitors, especially supermarkets, starts to attract price-sensitive consumers to liquid soap. Third, stabilising the new product's price in the aftermath of initial successful growth establishes a price difference in favour of supermarkets' products that, in the medium-to-long-term, will erode the client company's market volume.
10.7.2. Partial Model Tests to Examine Pet Theories and Misconceptions
Pet theories and overly optimistic expectations often stem from idealised mental models that overlook real world constraints. One way to illustrate such misconceptions is to deliberately simplify a model, by switching-off complete sectors or eliminating feedback loops, to show that a partial model can simulate an outcome that people were expecting, even if it proves to be erroneous. The correspondence between expected and simulated outcome frequently shows the rationale for pet theories (albeit flawed), which is reassuring to model users and helps to engage their interest. Partial model tests provide an alternative way to build confidence in the model, much different than time series fit, by showing the circumstances in which simulation matches intuition. From this basis of agreement the modeller then overlays the extra feedback structure contained in the full model to show its confounding effect.
In the soap industry project, lack of awareness of the effect of supermarkets on the development of the liquid soap business was a particularly important strategic misconception.[] To highlight this misconception, a comparison of three runs was made, as shown in Figure 10.20. The first run shows what would happen if no competitors were able to copy the liquid soap innovation: an optimistic belief in first-mover advantage that was widely shared among the management team. This partial model test was conducted by setting to zero all the flow rates in the new product sector of the market model except the Antibacterial Liquid Soap adoption rate. Sales volume of liquid soap (line 1) expands swiftly in the historical period to 2004 and then settles into a pattern of sustained slow growth. Continuous growth was exactly what managers were expecting and hoping for. The second run showed the company's sales as if the other branded competitor were the only rival able to imitate the new product: a recognition that imitation is possible, but still an optimistic view since the branded competitor is the least disruptive rival (due to its similar cost structure and pricing policies). This partial model test was conducted by setting to zero the adoption rate and switch rates for Me Too liquid soap. Sales volume of Old English's liquid soap (line 2) is slightly lower than before and again seems to confirm the assumption of first-mover advantage. The third and final run showed the company's sales if both the branded competitor and supermarkets were able to quickly imitate liquid soap. This test was conducted with the complete model. Sales volume of liquid soap (line 3) expands for four years but then declines as supermarkets capture new customers from the branded manufacturers by pushing price down.
[] Perhaps the single most important contribution of the modelling project to new product strategy development at Old English was to clarify the powerful role that supermarkets now play in exploiting the commercial benefits of successful new grocery products. Branded manufacturers invest heavily in developing such new products, tooling-up to manufacture them, and then advertising to win customers. Meanwhile, supermarkets watch and wait like predators. As soon as there is tangible evidence from shelf sales that a new product is becoming popular then supermarkets move swiftly to offer an equivalent own-label product, without all the development costs and risks incurred by branded manufacturers. Retailers' own-labels can be priced low and still be profitable. Moreover, since supermarkets control shelf space, they can ensure consumer visibility for their own-label products and simultaneously manage the trade margins they receive from branded manufacturers who initiate product innovations. The refined conceptual model in Figure 10.8 reveals supermarkets as the potent rivals they have now become. Simulations such as those in Figure 10.20 demonstrate just how effective me-too products can be. These findings constituted an important shift in Old English's perception of competition and rivalry in fast-moving consumers goods, a shift that is captured in the differences between Figure 10.7 (the management team's first conceptual model of the soap market) and Figure 10.8 (the refined conceptual model). Interestingly, the insights from the project are consistent with contemporary marketing literature that recognises a new competitive reality in the retail industry stemming from growth in private labels. The strategic marketing implications for branded manufacturers in general are documented and analysed by Nirmalya Kumar and Jan-Benedict Steenkamp (2007).
Figure 10.20. Partial model experiments: alternative trajectories for sales volume of liquid soap as imagined first-mover advantage fades and rivals imitate the new product

Source: From Supporting Strategy: Frameworks, Methods and Models, Edited by Frances O'Brien and Robert Dyson, 2007, © John Wiley & Sons Limited. Reproduced with permission.
10.7.3. Family Member Tests
A model developed for a specific situation can often be generalised to other comparable situations. In other words, it is a member of a family of models. For example, the soap industry model, developed for the UK market, was used to test the introduction of liquid soaps in other countries such as France and Germany by changing the initial conditions and by adjusting selected parameters. The recalibration process and, later on, simulations helped members of the project team to appreciate country differences in the growth of the new product and the performance of the traditional bar soap business.
10.7.4. Policy Implication Tests
A particularly powerful test for building confidence in a model is when simulations correctly predict the results of policy change in situations where the policy has been tried. A good example comes from a modelling project with the Harley-Davidson motorcycle company (mentioned in Chapter 4), whose purpose was to investigate Harley's dwindling market share in service parts and, if possible, reverse it. A policy recommendation based on model simulations was for management to invest in a large inventory of finished motorbikes in order to alleviate internal competition for capacity between bikes and service parts. A specific prediction from the model was that bikes produced for inventory under this policy would end-up in the dealer network rather than in the factory – a result that was not intuitively obvious. Moreover, the model provided a plausible explanation of this phenomenon. Hence, when the policy was implemented in the real world and the dealers snapped-up the extra bikes, then the model's credibility in the eyes of management was greatly enhanced.
10.7.5. Understanding Competitive Dynamics in Fast-moving Consumer Goods
The management team extracted a number of general insights from the soap industry model and simulations that clarified their understanding of competitive dynamics in the industry. The causal loop diagram in Figure 10.21 provides an example. The figure concentrates on bar soap, but similar processes are at work for liquid soap. The interaction between price and capacity is important. Sales volume drives manufacturing capacity. If manufacturing capacity rises then cost of goods sold declines due to economies of scale (and vice versa). Lower cost leads to lower price. Low price increases the value for money of the product thereby attracting more customers and more sales volume. Once established, success breeds success around the reinforcing loop R1 (market dominance dynamics) leading to a gradual demise of rivals unable to compete due to their higher costs. An effective way for competitors to halt this reinforcing process is to reduce the attractiveness of leader's products as soon as possible, either by launching similar products or by reducing prices, as occurred in liquid soap.
Figure 10.21. Main feedback loops underlying competitive dynamics in the FMCG industry
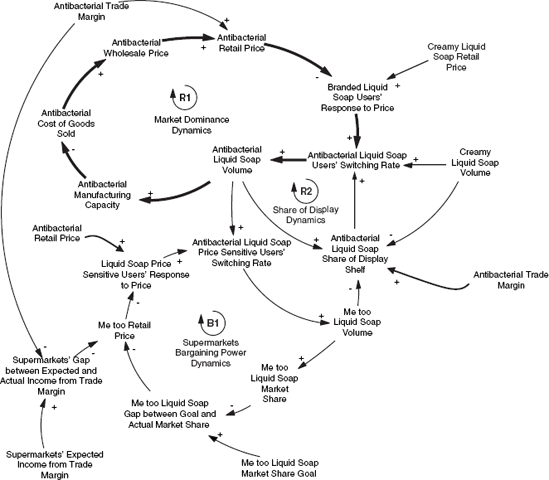
Source: From Supporting Strategy: Frameworks, Methods and Models, Edited by Frances O'Brien and Robert Dyson, 2007, © John Wiley & Sons Limited. Reproduced with permission.
An additional effect is the power of retailers to control the allocation of shelf space. As mentioned, display shelf is a fiercely contested resource in fast-moving consumer goods and has a major influence on the effectiveness of price promotions and advertising. Companies in the industry use trade margin to negotiate their share of display shelf with retailers. Higher sales volume and market share normally command greater share of display shelf because of the additional income for the retailer. Additional shelf space attracts more customers and higher sales volume and these relationships form reinforcing loop R2 (share of display dynamics).
However, there is more to the allocation of shelf space than sales volume alone. Retailers can use the display shelf for their own private-label products and use this threat to negotiate attractive trade margins. Competitors with low market share may buy display shelf by offering a better trade margin to retailers, providing they are willing to accept a compensating reduction of gross margin in order to remain price competitive. Private-label products therefore enable retailers to control the strength of the two reinforcing loops R1 and R2.