
IN THIS CHAPTER
Your Configuration Manager (ConfigMgr) 2007 site databases contain a wealth of information regarding your network environment and ConfigMgr site. ConfigMgr’s reporting capabilities allow you to tap into that data and use it to display detailed reports about your Microsoft Windows systems and ConfigMgr activities, such as software deployment and software updates. Here are some of the areas ConfigMgr allows you to report on:
• Discovery data— You can use ConfigMgr to discover and report on network resources and Active Directory (AD) user and computer objects. Chapter 12, “Client Management,” discusses discovery methods.
• Inventory data— ConfigMgr hardware and software inventory provide detailed information about client computers. Chapter 2, “Configuration Manager 2007 Overview,” introduced ConfigMgr inventory features.
• Software metering data— Also introduced in Chapter 2, you can use software metering to track the usage of specific software on your client systems.
• Asset Intelligence data— The new Asset Intelligence features of ConfigMgr 2007 use an extensive catalog of hardware devices and software products to help you identify, track, and manage the assets in your environment. Chapter 2 introduced Asset Intelligence; this chapter discusses Asset Intelligence data in more detail and presents its use in reporting.
• Configuration Manager site data— The configuration and relationships of your ConfigMgr sites, components, and client agents are stored in the site database. ConfigMgr reporting enables you to view and analyze the essential aspects of your ConfigMgr environment.
• Configuration Management data— You can use reporting to review the usage and progress of ConfigMgr features, such as software deployment, software updates, device management, Operating System Deployment (OSD), task sequences, Desired Configuration Management (DCM), and Network Access Protection (NAP).
• Configuration Manager status data— Reports based on status messages provide a useful tool for viewing the health of your ConfigMgr environment.
This chapter describes how to configure reporting and use ConfigMgr’s reporting features to plan and assess your ConfigMgr operations and to present an in-depth picture of your Microsoft Windows environment.
Systems Management Server (SMS) 2003 (and earlier versions of SMS) provided a product-specific reporting implementation capable of rendering discovery, inventory, and management data from the site database as web-based reports. Microsoft also provided an extensive variety of preconfigured reports that you could use or modify according to your needs. ConfigMgr 2007 continues to support this reporting interface, and Microsoft has provided more than 200 new reports in addition to those available with SMS 2003. With ConfigMgr 2007 Release 2 (R2), Microsoft also integrates ConfigMgr with Microsoft SQL Server 2005 Reporting Services (SRS). This chapter refers to the reporting implementation based on SMS 2003 reporting technology as “classic” reporting to distinguish it from SRS reporting.
Here are several advantages Microsoft’s SQL Reporting Services provides over the ConfigMgr web reports:
• SRS is an industry standard for reporting used by other System Center applications such as System Center Operations Manager (OpsMgr) 2007.
• SRS provides a user interface for those users unfamiliar with ConfigMgr 2007 reporting to generate ad hoc reports. Users can build SQL Reporting Services reports using SQL queries directly just as with classic ConfigMgr reports, or with reporting models that abstract away much of the detail of the underlying data source.
• SQL Reporting Services provides subscription services for reports. Using subscriptions, you can schedule regular updates to reports and distribute them by email or by placing them on a Windows file share. One advantage of publishing to a file share is the capability to easily maintain a report history.
• Classic ConfigMgr reporting allows you to export reports only to comma separated value (CSV) files. SQL Reporting Services additionally allows you to render reports to the following industry standard formats: eXtensible Markup Language (XML), Adobe Portable Document Format (PDF), Tagged Image File Format (TIFF), web archives (MHTML) and Microsoft Excel (XLS).
• SRS provides more flexible security options than available with classic reporting. Chapter 20, “Security and Delegation in Configuration Manager 2007,” discusses security for both SRS and classic reporting.
• The SQL Reporting Services Report Builder interface provides drag-and-drop functionality to design report layout and add graphical elements to reports. These graphical designs provide the capability to produce richer reports.
Classic ConfigMgr reporting has some advantages as well:
• Report design and administration are consistent with SMS 2003, so there is almost no learning curve for SMS 2003 administrators. Links to any existing reports you distributed to users continue to work when you upgrade your reporting point from SMS 2003 to ConfigMgr.
• Classic reporting provides the capability to link to the Computer Details page. The Computer Details page provides an Explorer-like interface listing the available reports for a particular computer. The “Viewing Computer Details” section of this chapter discusses linking to Computer Details.
• You are more likely to get adequate performance without a dedicated server for the reporting role if you use classic reporting. If you do use a dedicated server, SRS requires a SQL Server instance (and license) for the reporting services role whereas the classic reporting point does not.
• Although ConfigMgr provides a wizard for easily migrating existing reports to SRS, any dashboards you created using classic reporting require re-creating in SRS. The “Dashboards” section of this chapter discusses dashboards.
Each reporting interface also has its own look and feel. Figures 18.1 and 18.2 display the same report as rendered in the default web format by the classic reporting engine and SRS, respectively.

When choosing a site to host either classic or SRS reporting, keep in mind that data flows up the ConfigMgr hierarchy and management flows down the hierarchy. This means that all data in your hierarchy is available at the central site, including discovery data, client inventory, status messages, and metering data. The central site is, therefore, the most useful location when reporting on your ConfigMgr environment. If you use child primary sites for administration, you may decide to enable reporting at these sites as well. Because management objects such as packages, advertisements, and task sequences created at child sites are not available for reporting at higher levels of the hierarchy, you must run those reports that track local management operations at the child sites.
To provide reporting capability on your site, you must first configure the appropriate site systems. Chapter 8, “Installing Configuration Manager 2007,” discusses adding site systems and assigning site system roles.
• For classic reporting, you need to configure the Reporting Point site system role.
• For SRS reporting, you need to configure the Reporting Services Point site system role.
The next two sections discuss these configurations. You need to add any users that need to view reports and are not local administrators on the reporting point server to the Reporting Users local group on the reporting point server, and ensure users have either class or instance rights to view the appropriate reports. See Chapter 20 for a description of class and instance rights.
The reporting point site system computer must have IIS and Active Server Pages (ASP) installed and enabled. To enable rendering graphs in reports, install Microsoft Office Web Components (Microsoft Office 2000 SP 2, Office XP, or Office 2003) on your reporting point server.
Caution
Special Considerations for Windows Server 2008 and 64-Bit Operating Systems
If you use a computer running Windows Server 2008 as your reporting point server, additional steps are required to enable the required IIS options. Chapter 6, “Architecture Design Planning,” describes these steps. Also, 64-bit versions of Windows do not support Office Web Components. If you use a computer running a 64-bit operating system as your reporting point server, graph-rendering functionality is not available.
Here are the options you can specify when you configure a reporting point role:
• The report folder— ConfigMgr creates a folder with the specified name under the default website. The default name for the report folder is SMSReporting_<Site Code>. In Figure 18.3, the folder used for classic reporting is SMSReporting_DAL on the SCCMUnleashed Dallas site server.

• Transfer protocol— You can specify whether to use Hypertext Transfer Protocol (HTTP) or Secure Hypertext Transfer Protocol (HTTPS), and specify the port on which the reporting point should listen.
Based on the options you specify, ConfigMgr constructs and displays the reporting Uniform Resource Locator (URL). Figure 18.3 displays the options for configuring a reporting point.
You can assign the Reporting Services Point site system role to the site server or a remote server. For performance reasons, you generally want to move this role off the site server. The major prerequisites for the Reporting Services Point site system role include the following:
• The computer holding this role must have Microsoft SQL Server 2005 and its Reporting Services component installed. You must also configure the default report server and report manager virtual directories, the Windows service and web service identities, and the report server database.
For information about installing and configuring SQL Reporting Services, visit the SQL Reporting Services website at http://go.microsoft.com/fwlink/?LinkId=111840.
Be sure to test for a successful installation of SRS prior to configuring the reporting services point. You can do this by browsing to both http://localhost/reports and http://localhost/ReportServer from the SRS server.
• http://localhost/reports should display the SQL Server Reporting Services home page, including a toolbar for managing reports.
• http://localhost/ReportServer should display a page with the SRS installation date and version information.
• The computer containing the reporting services point must have IIS 6.0 installed.
• Your site must be running ConfigMgr 2007 R2 before you configure a reporting services point.
The only option to specify when creating the reporting services point is the report folder name. The default name for the report folder is ConfigMgr_<Site Code>. ConfigMgr creates the report folder under the ReportServer website on the SRS website. After creating the reporting services point, you need to configure several SRS options in the ConfigMgr console. To configure Reporting Services options, expand the Configuration Manager console tree to System Center Configuration Manager -> Site Database -> Computer Management -> Reporting -> Reporting Services. Right-click your reporting services point server, and choose Properties. The General tab displays the location, status, size, and a summary of the objects the reporting services point contains. You can use the remaining tabs to configure SRS options as follows:
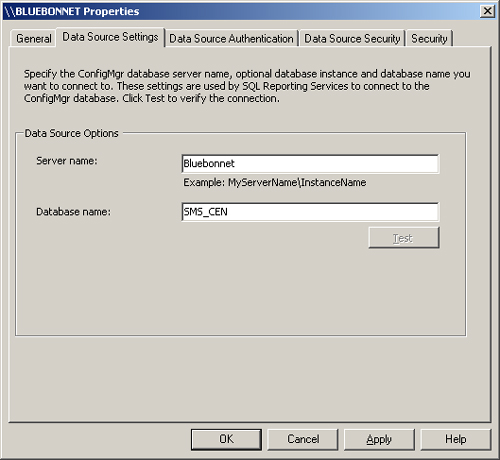
• The Data Source Settings tab settings specify the database that supplies data to your reports. This generally is your site database or a replica of the site database. Figure 18.4 displays the Data Source Settings tab. In this figure, the Server name is Bluebonnet and the Database name is SMS_CEN.
• The Data Source Authentication tab settings specify the credentials used to access the data source.
Note
Supported Options for ConfigMgr R2
Although the Data Source Authentication shows the option Credentials supplied by the user running the report, ConfigMgr 2007 R2 does not actually support this option.
Here are the supported options for data source authentication:
• Credentials stored securely in the report server— This option allows you to specify credentials for either a Windows or SQL Server user account, which is stored in encrypted form in the SRS report server database and used to authenticate to the data source. For more information about authentication in SQL Server, refer to the SQL Server 2005 product documentation available online at http://msdn.microsoft.com/en-us/library/ms130214.aspx. You generally choose this option if you plan to schedule unattended reports to support the SRS subscription feature.
• Windows Integrated Security— SRS uses the credentials of the user executing the report to authenticate to the data source.
• Credentials are not required— You can select this option if you do not need to restrict access to the reporting data.
Figure 18.5 shows the Data Source Authentication tab configured to store Windows account credentials in the report server database and allow the use of delegation. Delegation enables the server to use the credentials to connect to additional systems if required.

The remaining tabs specify SRS security settings. Chapter 20 discusses SRS security.
Caution
Reestablishing Console Report Links When Replacing a Reporting Services Point
If you enable the report option to Use Reporting Services Reports for Admin console report links and later remove the default reporting services point, console report links no longer work. To avoid this problem, select the report option to use classic reporting for console report links or specify a different default reporting services point prior to removing the reporting services point. You can reenable this option after you configure the new reporting services point. The “Console Reporting Links” section of this chapter discusses report options.
You must copy your existing classic reports to Reporting Services because establishing SRS does not automatically generate these reports. To copy ConfigMgr classic reports to Reporting Services, perform the following steps:
- Expand the Configuration Manager console tree to System Center Configuration Manager -> Site Database -> Computer Management -> Reporting -> Reporting Services. Right-click the reporting services point server, and choose the option to Copy Reports to Reporting Services.
- On the Data Source Settings page, enter the site database server name and database name from which you will copy the reports. Figure 18.6 displays the Data Source Settings page for the Bluebonnet server and the SMS_CEN database.
- On the Data Source Authentication page, choose the option that Reporting Services uses to authenticate to the data source. By default, the data source authentication you configured on the report server Properties page is used. If you select the credentials stored securely in the report server option, you need to reenter the password to complete this dialog box.
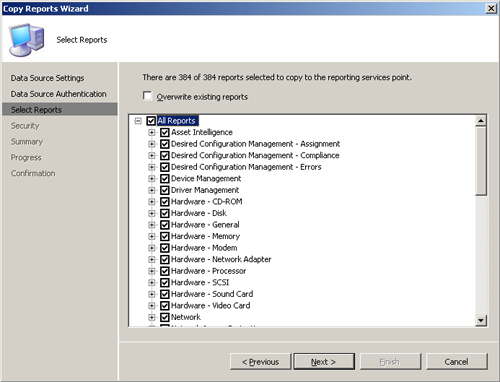
- The Select Reports page, shown in Figure 18.7, allows you to choose the reports you want to copy to SRS. You can include any custom reports you created in addition to those reports supplied with Configuration Manager.
- The Security page allows you to modify the security settings for the copied reports. By default, the reports inherit the security from the SRS report folder. Chapter 20 discusses SRS security.
-
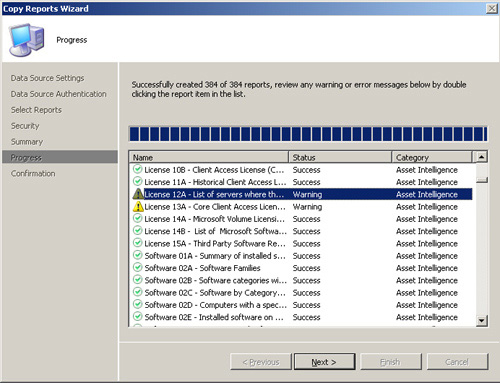
The Summary page displays the options you selected. Click Next to initiate the copy operation. The wizard now displays the progress for copying each report, as shown in Figure 18.8.
You can double-click each item showing a warning or error status to review the associated messages. The warnings displayed in Figure 18.8 indicate the report descriptions have been truncated to conform to the SRS maximum of 512 characters. Click Next to view a confirmation page displaying the overall results of the Copy Reports Wizard.

After copying the reports to SRS, you can use the ConfigMgr console to view and administer both types of reports. You can also view either type of report using a web browser, such as Microsoft Internet Explorer (IE).
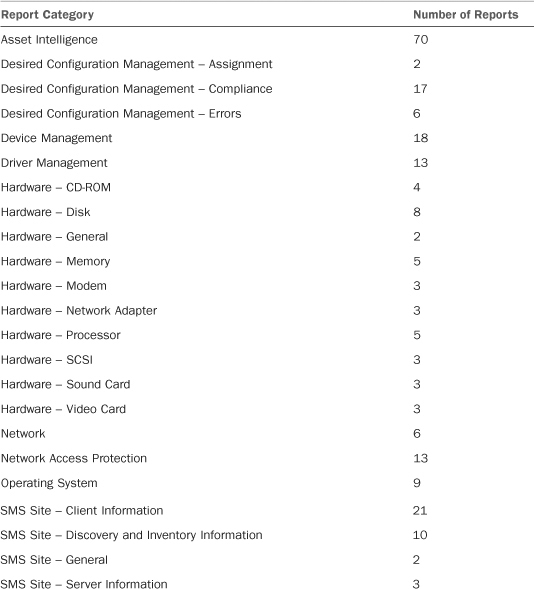
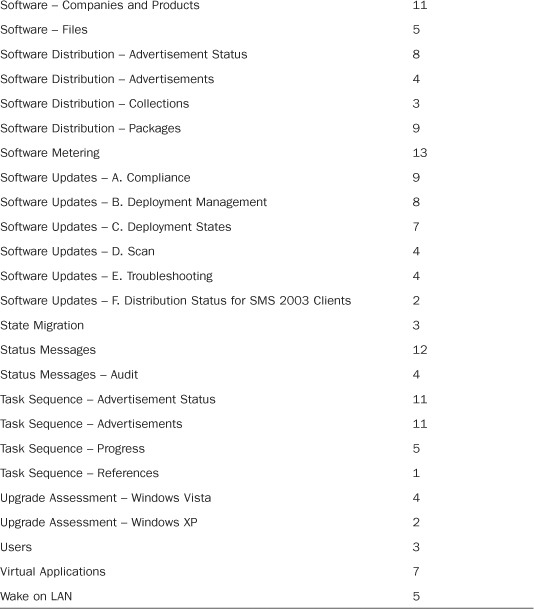
Microsoft provides more than 300 ready-made reports that you can use directly or modify to meet your reporting requirements. Table 18.1 shows the report categories and the number of reports in each category available with ConfigMgr 2007 R2.
Chapter 10, “The Configuration Manager Console,” discusses viewing classic and SRS reports.
In addition to the report viewing functionality found under the ConfigMgr console’s Reporting subtree, Microsoft provides a number of links throughout the console to reports relevant to the task at hand. As an example, the Software Distribution home page found under Configuration Manager -> Site Database -> Computer Management -> Software Distribution presents links to several reports related to software distribution. Perform the following steps to configure the behavior of these links:
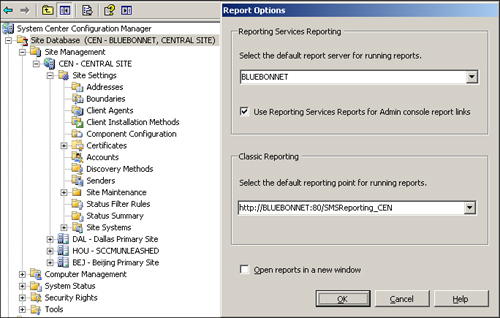
- Right-click the System Center Configuration Manager -> Site Database node in the Configuration Manager console tree, and choose Report Options.
- The Report Options dialog box provides check boxes to use SRS for the ConfigMgr console report links and to open reports in a new window. By default, report links open inside the console window and use the classic reporting engine. If you have multiple reporting points or reporting services points, you can also use this dialog box to specify which site systems to use when launching reports from the console. Figure 18.9 displays the Report Options dialog box.
The heart of each report is a Structured Query Language (SQL) statement that retrieves data from the site database. SQL is the standard language for managing and querying relational databases. If you are not familiar with the basic concepts of relational databases and the SQL language, it is worth taking some time to learn about them. You don’t need to be a SQL expert to administer ConfigMgr, but to get the most out of the product, it helps to know a little SQL. If you are already familiar with SQL, you might want to skip the rest of this section and proceed directly to the “Available Reports and Use Cases” section in this chapter.
A relational database management system (RDBMS) such as Microsoft SQL Server organizes data into logical storage containers called tables. You can think of a table as being similar to a spreadsheet, with data arranged in rows and columns. Table 18.2 shows a simple example of a database table.

Database developers use views to gather data from one or more tables and present that data to users. Using views gives developers the ability to choose which data to make available and how to arrange and format that data, without needing to reorganize the underlying tables. For the purpose of developing reports, views are essentially equivalent to tables. Microsoft provides an extensive set of views in the Configuration Manager database. Chapter 3, “Looking Inside Configuration Manager,” discusses these views. The reports Microsoft provides in Configuration Manager are based on the database views, and you should use these views wherever possible when designing or customizing reports.
Caution
Working with the Site Server Database
Many ConfigMgr administrators already have some degree of familiarity with the site server database, which is the repository of all data used by ConfigMgr. Microsoft strongly suggests using the look-but-don’t-touch approach, as direct modification of the database is not supported and might render your site unusable.
Microsoft provides views to use when developing queries and reports because the underlying table structure might change from version to version, and even from one service pack to another. Building queries that pull data directly from the base tables is not recommended because those queries might not work in a future version of ConfigMgr.
The SQL language contains a rich set of statements for manipulating data and managing databases. For reporting purposes, it is necessary to look at only one statement of the SQL language, the SELECT statement. The SELECT statement retrieves data from a database. The SELECT statement is an extremely powerful and flexible language construct, and this chapter covers some of its basic features.
In its most basic form, the SELECT statement looks like
SELECT select_list FROM table_source
Table_source specifies the database tables or views from which the data will be retrieved, and the select_list is the list of columns you want to retrieve. As an example, if the data presented in Table 18.2 were stored in a table named cars, you would use the following statement to retrieve the stock number, color, and body style of the available cars:
SELECT [stock number], color, [body style] FROM cars
Notice the column names containing spaces are enclosed in square brackets []. The brackets also allow you to include SQL reserved words in your column names if you choose to do so. The preceding query would return all the data shown in Table 18.2 except the engine type.
You can limit the results of your SELECT statement to rows meeting specific criteria by adding a WHERE clause to your statement. As an example, the statement
![]()
returns only the rows for cars with V-6 engines. Table 18.3 shows the results of this statement.

Database platforms such as Microsoft SQL Server are called relational databases because they take advantage of relationships in the data to reduce redundant storage and provide more flexibility in working with the data. If the cars in the cars sample table are rental vehicles, for example, you can use a separate table to store the rental history of each vehicle without duplicating all the information in the cars table each time a vehicle is rented. Table 18.4 shows a portion of the rentals table.

Now suppose you want to see the rental information for blue cars for the week ending 11/22/2008. Use the following SQL statement to retrieve that information, using both tables:
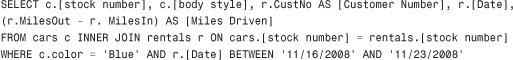
The key to this statement is the INNER JOIN clause, which causes this SELECT statement to pull only the data from the rows in the two tables where the stock numbers match. The results of this statement are displayed in Table 18.5.

This covers enough SQL syntax to understand the SQL statements used in ConfigMgr reports. This chapter introduces several other details of the SELECT statement as necessary, but even so, it barely scratches the surface of what is possible with the SELECT statement and other features of the SQL language. The Microsoft SQL Server implementation of SQL, known as Transact-SQL, is fully documented in the Transact-SQL Reference, available online at http://msdn.microsoft.com/en-us/library/ms189826.aspx. You may also want to read Microsoft SQL Server 2005 Unleashed (Sams, 2006) for additional information regarding SQL Server 2005.
The next several sections discuss a number of the report categories previously listed in Table 18.1 and their use in understanding your environment and supporting your ConfigMgr solution. Out of the box, these predefined reports are available only as classic ConfigMgr reports, although you can easily make these reports available through SRS as well. The process of migrating reports to SRS is briefly described in the “Copying ConfigMgr Classic Reports to SQL Reporting Services” section of this chapter, and Chapter 10 discusses how to view both classic and SRS reports.
One of the most valuable and often overlooked features of ConfigMgr is the data it gathers about your network and Windows environment. This section looks at some of the reports in the Hardware, Software, Operating System, and Network categories listed in Table 18.1 and how they use ConfigMgr inventory and discovery data.
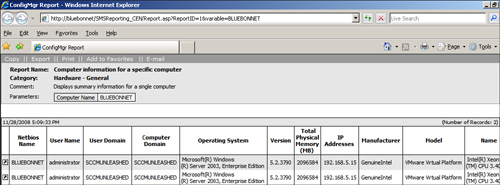
One of the most basic ConfigMgr reports provided by Microsoft is the Computer information for a specific computer report. Figure 18.10 displays the output of this report for the Bluebonnet system.
Let’s look at the details of how this report is constructed. From the System Center Configuration Manager -> Site Database -> Computer Management -> Reporting -> Reports node of the Configuration Manager console tree, you can right-click the report and choose Properties to view and edit the report properties. Figure 18.11 displays the General tab of the report’s Properties page.
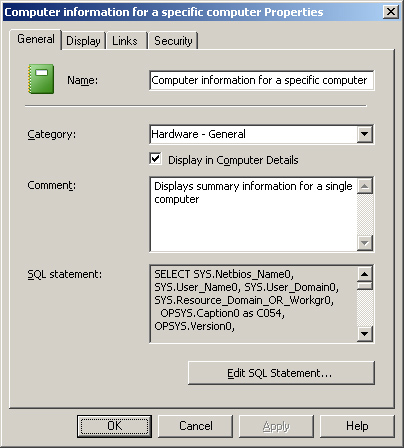
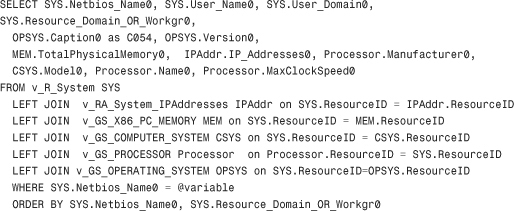
The General tab shows the report’s name, category, and the optional comment associated with the report. This tab also displays the SQL statement on which the report is based and provides an option to edit the SQL statement. Clicking on the Edit SQL Statement button launches the Query Builder. Figure 18.12 displays the SQL statement for the Computer information for a specific computer report in the Query Builder. The “Customizing Configuration Manager Reports” section discusses the Query Builder interface in more detail. Notice that the Display in Computer Details check box is enabled. The “Viewing Computer Details” section of this chapter shows how the Computer Details page displays data from this report.
Figure 18.12. The Query Builder interface displaying the SQL statement for the Computer information for a specific computer report

The SQL statement for the Computer information for a specific computer report is as follows:
Here’s how the statement functions:
• The SELECT list specifies the columns that displayed in the report; for example, SYS.Nebios_Name0 is the Nebios_Name0 column from the view v_R_System, to which the SQL statement assigns the alias SYS. The report rendering engine reformats the column header to NetBIOS Name.
• The data is pulled from six resource views joined together on their ResourceID. Microsoft uses the ResourceID column in each of the views to identify the computer system that each data record represents. As Chapter 3 discusses, views with the v_R or v_RA prefix represent discovery data, and those with the v_GS prefix represent inventory data.
• The LEFT JOIN is used in this query so that partial results are returned even if some of the requested data is not available. As an example, if the discovery data in the System and System IPAddresses views is available but the inventory data is not, the report displays the discovery data. If an INNER JOIN were used, no data would be returned unless all the views contained the corresponding ResourceID. The join also explains why there are two essentially identical records in the report. The computer has two processors; therefore, the join on v_GS_PROCESSOR matches two distinct rows. A record will be returned for each of these rows.
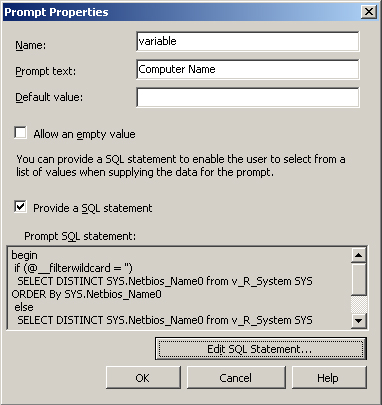
Many ConfigMgr reports prompt the user to supply one or more parameters at run-time. For example, the Computer information for a specific computer report requires the user to enter the computer name. Chapter 10 describes how to enter these values. To view details behind this prompt, click the Prompts button on the Query Builder screen (Figure 18.12), then right-click the Computer Name prompt, and choose Properties. Figure 18.13 shows the properties for the Computer Name prompt.
Caution
Use Caution When Creating Joins
Using the wrong type of join or joining views on the wrong column can cause the query to retrieve large amounts of data, which is likely to cause your reports to time out and might create an excessive load on your Report Server and Site Database.
The Name text box on Prompt Properties page contains the name variable, which indicates that the prompted value populates the @variable parameter. This parameter appears in the WHERE clause of the report SQL statement (WHERE SYS.Netbios_Name0 = @variable). Chapter 10 describes the Report Viewer and shows how you can click the Values button to retrieve a list of available values from the site database for a prompted parameter. To edit the query that returns this list, click the Edit SQL statement at the bottom of the Prompt Properties page displayed in Figure 18.13. The query for the Computer Name prompt is
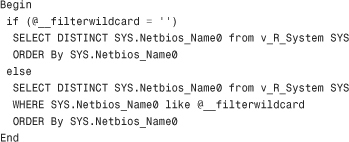
If you entered any text in the Computer Name text box before clicking the Values button, the @__filterwildcard variable represents the text you entered. This value is used to match only the values that are “like” the text string you entered. The like operator is a standard SQL relational operator that supports wildcard matching.
Returning to the Properties page for the Computer information for a specific computer report and clicking the Link tab displays the information shown in Figure 18.14.
Figure 18.14. Computer information for a specific computer report Properties page Link tab shows a Link to the Computer Details.

This page indicates that the report contains a link to the Computer Details page for the computer named in column 1 of the report.
Tip
Using ConfigMgr Reports in Spreadsheets
As with any web page, you can place hyperlinks to your Configuration Manager reports in email messages, Word documents, and so on. One way you might want to use reports on specific computers is to include them in any spreadsheets you maintain with system information. To add links to the Computer information for a specific computer to an Excel spreadsheet, add a column to your sheet, and enter a link similar to the one here to the first cell of that column.
=HYPERLINK("http://<Reporting_URL>/Report.asp?ReportID=1&variable="&xxxx ,"ConfigMgr Data")
<Reporting_URL> is the URL of your ConfigMgr reporting point and xxxx is the cell containing the NetBIOS name of the computer in the initial row. Now, copy the cell and paste it into the rest of the column.
You might have noticed the small square containing an arrow at the beginning of each row of the report shown earlier in Figure 18.10. This is the link to the Computer Details page. Figure 18.15 displays the Computer Details page for the Bluebonnet computer.

The tree control in the left pane displays the report categories for all reports that have been linked to Computer Details. Figure 18.11 showed the Display in Computer Details check box enabled for the Computer information for a specific computer report, and that the report category is Hardware – General.
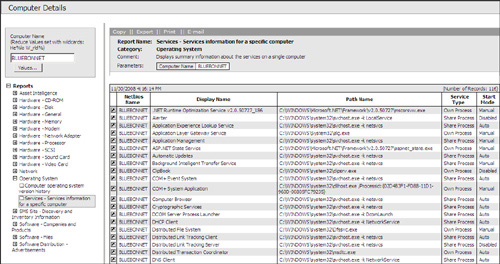
When you expand the Computer Details Hardware – General node, you see the Computer information for a specific computer report for the selected computer. Computer Details provides convenient access to the additional reports including hardware, software, and operating system (OS) information; data about the ConfigMgr client and software advertised to the client; and asset intelligence data. For example, Figure 18.16 shows how you can quickly access information about Windows services from the Computer Details page.
The Computer Details drill down interface is available in classic reporting but is not included with the SRS reports.
One of the most useful applications of ConfigMgr inventory data is to report on computers matching specific characteristics. Some typical uses for this type of report are to identify machines needing hardware upgrades, find all computers with a specific software product installed, or enumerate the machines on a specific Internet Protocol (IP) subnet. An example of a report commonly used for computer maintenance is the Computers with low free disk space report shown in Figure 18.17. In this case, specify 2000 MB at the Disk Space Amount prompt.
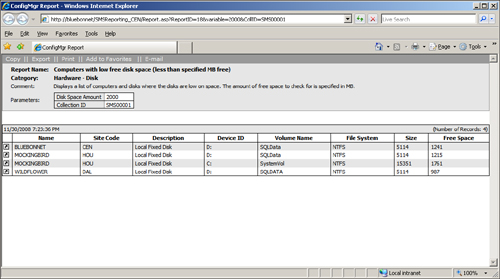
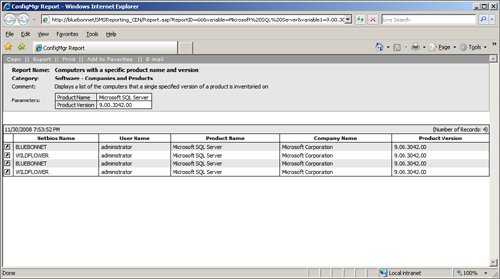
Figure 18.18 shows another commonly used report: Computers with a specific product name and version. This report is an example of the Software – Companies and Products category. Most of the reports in this category use property data that the ConfigMgr software inventory process extracts from the file headers—the same data that you view when you right-click a file and view the product properties entered by the software vendors. This data might be more or less complete, depending on the information the vendor has chosen to supply. The reports in the Software – Files category focus primarily on file system information—the information you would see in a directory listing in Windows Explorer or at the command prompt.
You can also use ConfigMgr 2007 to report on network segments and users in your environment:
• Network reports list the IP subnets in your environment, enumerate the client computers and other devices on each subnet, and allow you to drill down to see detailed information about the networking components of each client computer.
• User reports give an overview of the users in your AD domains.
• The Computers for a specific user name report can help identify computers used by a specific user, although it is dependent on the user having been the last person to log on at the time inventory ran.
Some of the reports in the Network and Users categories require enabling Network Discovery or Active Directory User Discovery to gather the required data.
ConfigMgr reporting can report on your ConfigMgr 2007 hierarchy and sites. Although the SMS Site – General and SMS Site – Server Information report categories together only contain five reports, these reports provide a high-level overview of some of the most important site attributes and site status information. Here are the reports in the SMS Site – General category:
• Sites by hierarchy with time of last site status update— As the report description states, this report displays the list of sites in hierarchy order and shows the last time the site status was updated. The ConfigMgr status system does not automatically display a degraded site status in the ConfigMgr console tree when a site has not recently reported any status. This report is therefore a good starting point for checking the health of the hierarchy. Figure 18.19 shows the Sites by hierarchy with time of last site status update report.
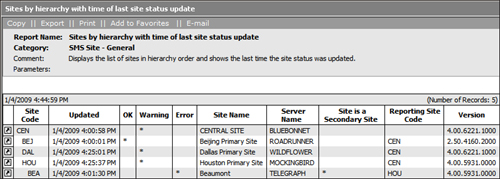
• Computers in a specific site— This report displays basic information about all computers in the site.
Reports in the SMS Site – Server Information category display the site system roles and provide status information for distribution points and branch distribution points.
Reporting is an essential part of day-to-day operations in your ConfigMgr sites. You can utilize ConfigMgr reporting to describe the operation of ConfigMgr activities including software distribution, software updates management, device management, software metering, DCM, OSD, and NAP. The next sections discuss several of these areas.
You can use ConfigMgr reports to help you plan, manage, and assess your software distribution services. Here are the report categories Microsoft provides, related to each major step of the software distribution process:
• Software Distribution – Packages
• Software Distribution – Collections
• Software Distribution – Advertisements
• Software Distribution – Advertisement Status
The All Packages report provides summary information for all packages available at the site. One of the most challenging aspects of software distribution is ensuring packages are available and up to date at the correct distribution points. ConfigMgr reporting provides a number of reports in this area:
• Several reports relating to packages allow you to view information such as all packages on a specific distribution point, distribution status for a particular package, and all active distribution activity.
• Two new reports with ConfigMgr 2007 R2 support virtual application distribution, reporting on streaming store distribution status for virtual application packages on a per package and per distribution point basis.
A second challenge in software distribution is ensuring the targeted collections have the correct membership, and the collection’s maintenance window schedule does not conflict with the distribution. Here are two reports to assist with this:
• The All resources in a specific collection report is useful for reviewing collection membership.
• The Maintenance Windows Available to a Particular Client report is useful for planning software distribution and helping you determine whether the maintenance window feature prevented an advertisement from running.
Tip
Evaluating Collection Membership Locally
Although collection membership rules are replicated down the ConfigMgr hierarchy, each primary site evaluates collection membership based on the inventory and discovery data in its local site database. Although the All resources in a specific collection report is a useful way to look at collection membership at the site containing your reporting point, keep in mind that collection membership might be evaluated differently at the client’s assigned site.
Clients receive policy, including advertisements, from their assigned site. If you troubleshoot a software distribution issue and the client’s site does not have a reporting point, you can use the ConfigMgr console to connect directly to the assigned site and view the collection membership as it is evaluated locally.
The Advertisements category includes reports about all advertisements, advertisements based on a particular package, and advertisements to a particular client or collection. These reports help answer questions such as
• “Who has a particular package been advertised to?”
• “What software has been advertised to a user’s machine?”
The Advertisement Status category helps you assess the ultimate results of software distribution and troubleshoot any issues with advertised software. This set of reports provides an excellent example of ConfigMgr reporting’s drill through functionality. The All advertisements report provides an overview of your ConfigMgr advertisements. From the All advertisements report, you can drill down into the status of an individual advertisement by clicking the link in the left column. This link opens the Status of a specific advertisement report, which shows the count and percentage of clients for each acceptance status and status. Clients might have the following acceptance statuses:
• Accepted
• Expired
• No Status
• Rejected
Those clients that have accepted the advertisement also report a last status, which can have the following values:
• Accepted – No Further Status
• Cancelled
• Failed
• No Status
• Reboot Pending
• Retrying
• Running
• Succeeded
• Waiting
For each status category, the Status of a specific advertisement report provides a link to the All system resources for a specific advertisement in a specific state report, which lists the systems in the specified state and provides some system and status details. Finally, the All system resources for a specific advertisement in a specific state report provides a link to the Advertisement status messages for a particular client and advertisement report for each system, which displays the status messages in detail. Together these reports comprise a powerful tool for tracking the progress of your advertisements. The “Creating Classic Reports” section in this chapter provides an example of a report you can use to view the drill through sequence starting from a specified report.
For advertised task sequences, reports in the Task Sequences categories provide additional details on the progress and status of the task sequences. The Task Sequence – References report also gives the packages references by each task sequence.
ConfigMgr 2007 R2 adds the Virtual Applications report category, including reports on software you distribute as virtual applications using the new R2 application virtualization capabilities. These reports provide a comprehensive summary of your virtual applications and information about virtual application launch failures.
ConfigMgr includes an extensive and highly organized set of reports for tracking software updates. Here are the categories used for the software updates reports:
• The Compliance category contains nine reports that display compliance information on a per system, per product, and per update basis, and overall compliance summaries.
• The Deployment Management category provides eight reports on the contents of your deployments and the systems they target.
• The Deployment States category includes seven reports on the state of each deployment and on specific systems. Microsoft defines 24 possible deployment states, such as installed, not required, and various detailed pending, downloading, or failure states.
• The Scan category consists of four reports with details of the last time your clients were scanned, and the scan results.
• The Troubleshooting category provides four reports on scan errors and deployment errors that you can use to quickly identify problems with your software update services.
• The Distribution Status for SMS 2003 Clients category contains two reports on the status of deployments to SMS 2003 clients in your sites.
ConfigMgr reporting is one of the major advantages for using ConfigMgr software updates over a standalone WSUS implementation in enterprise environments.
You can use reporting to help plan and track your OS deployment operations. Reports you can use to support OS deployment include the following:
• Upgrade Assessment reports for Windows Vista specify the systems meeting the minimum or recommended requirements for Vista upgrades, and those that do not.
• Driver Management reports list the drivers in your packages and boot images, match drivers to computers and collections, and display driver installation failures.
• State Migration reports track the activity of your state migration points and the details of state migration for individual computers.
• Some of the report categories used with software distribution also provide visibility into OS deployment operations. The Task Sequence – Progress category includes the Progress of OS deployment task sequences report. You can use additional reports in the Task Sequence and Software Distribution categories to view details and status information for advertisements and distribution operations supporting OS distribution.
Reporting is an essential part of DCM. Reports in the Desired Configuration Management – Compliance category are at the heart of an effective DCM implementation:
• You can use the compliance reports at a high level to assess regulatory compliance or compliance with internal standards.
• You can use drill-through functionality to view details about compliance issues that you can use to guide your remediation efforts.
As you deploy configuration baselines, you want to view reports such as the Summary compliance by configuration baseline report to see an overview of how your systems measure up against the baseline. From this report, you can select a configuration item you are interested in and drill down to the Compliance details for a Configuration baseline by configuration item report. You then see the compliance for the selected configuration item by system and can use the link for an individual computer to view the Summary compliance for a configuration item by computer report. Finally, you can open the links for Non-compliance details for a configuration item on a computer report to view the details of compliance issues related to the selected item.
DCM reporting provides flexibility in viewing compliance data. An alternative to analyzing compliance with respect to specific baselines and configuration items is to begin with the Summary compliance for a collection by computer report and analyze compliance on a per system basis.
While reports in the Compliance category help manage compliance in your environment, DCM reporting provides two additional categories to assist with managing DCM itself:
• The Desired Configuration Management – Assignment category displays the baseline assigned to a collection or an individual computer.
• You can use reports in the Desired Configuration Management – Errors category to identify and evaluate errors for troubleshooting DCM.
Tip
Using SQL Reporting Services to Provide Historical Data
The ConfigMgr database maintains historical data for some items, such as inventory, but not for others such as DCM. One way to maintain a history for DCM baseline compliance or other items that do not maintain history is to create an SRS subscription delivering reports to a file share using incrementally named files. The “Creating SQL Reporting Services Subscriptions” section in this chapter provides an example of this type of subscription.
In addition to those reports in the preceding sections, Microsoft provides report categories to assist with implementing the following ConfigMgr features:
• Device Management— Reports in the Device Management category provide details about devices connected to client computers via ActiveSync, device client agents, and device issues such as low battery state and low disk space.
• Network Access Protection— An important planning step for deploying NAP includes reporting on NAP-capable and NAP-upgradable computers, then using the List of computers that would be non-compliant based on selected software updates report to assess the impact of enforcing NAP in your environment. After deploying NAP, you can use reports to list NAP policies and view remediation details.
• Software Metering— ConfigMgr gathers usage data for any application you specified in software metering rules. Reports on software metering data allow you to verify license compliance and analyze usage trends to help you plan software purchases. Reporting on computers with a metered program installed that have not run the program since a specified date can help reclaim licenses by identifying applications that are not in use and can be removed.
• Wake On LAN— You can report on Wake On LAN (WOL) activity in your ConfigMgr environment, including a history of WOL activity, pending activity and errors that have occurred.
Status messages are one of the primary troubleshooting tools in ConfigMgr 2007. ConfigMgr server components and client systems generate status messages to report on errors, warnings, or important milestone activities that take place during ConfigMgr operations. You have already seen how reports such as the Advertisement status messages for a particular client and advertisement report display status message information related to particular ConfigMgr operations (see the “Reporting on Software Distribution” section in this chapter). Reports in the Status Message category provide a more comprehensive view of the status of your ConfigMgr sites, site components, and computer systems. Here are some reports you can use to provide an overview of how your site is functioning:
• Count errors in the last 12 hours
• Component messages for the last 12 hours
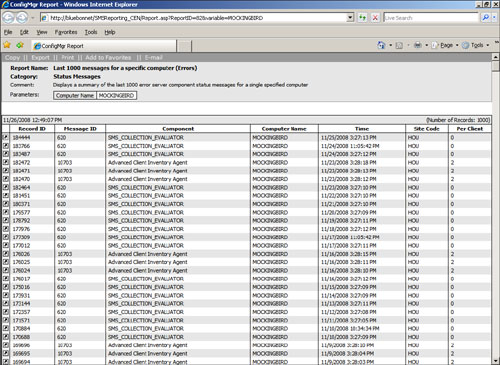
• Fatal errors (by component)
• Last 1000 messages for a specific server component
You can also use status messages reports to view status information about the computers in your hierarchy and about specific computers. Some reports that assess computer status include the following:
• Fatal errors (by computer name)
• Last 1000 messages for a specific computer (Errors)
• Last 1000 messages for a specific computer (Errors and Warnings)
A particularly valuable report is All messages for a specific message ID. Microsoft Knowledge Base (KB) articles and other documentation often refer to message IDs to look for when troubleshooting specific problems or confirming normal operational milestones. The All messages for a specific message ID report helps you quickly locate all occurrences of a specific message in your environment.
Reports in the Status Messages – Audit category allow you to track the usage of these sensitive operations that touch ConfigMgr clients:
• Remote Control
• Out of Band Management Console Activity
Both types of operations allow administrative users to interact directly with client systems. You can view reports on all audited activity or on activity by a specific user. Audit reports also include console activity such as adding, modifying, or deleting ConfigMgr objects.
Note
Effect of Status Filter Rules and Maintenance Tasks on Audit Reports
When a ConfigMgr site receives a status message, it processes the message according to settings specified in the site’s status filter rules. Chapter 5, “Network Design,” discusses the use of status filter rules to reduce the volume of network traffic due to status message replication, and Chapter 21, “Backup, Recovery, and Maintenance,” describes how to configure status filter rules. The Write audit messages to the site database and specify the period after which the user can delete the messages status filter rule is enabled by default and determines the handling of audit messages. Using the default settings for this rule, the ConfigMgr status message system writes all audit messages to the site database with a minimum retention period of 180 days and does not replicate audit messages to the parent site.
For reporting purposes, verify that the rules are configured so that all status messages in the audit reports are replicated to the reporting site and written to the site database at that site. The Delete Aged Status Messages site maintenance task removes status messages from the site database when the minimum retention period has expired. If you have this task enabled, you should make sure that the minimum retention period specified on the status filter rule’s Actions tab complies with your organization’s audit retention requirements. Chapter 21 discusses site maintenance tasks.
Figure 18.14 previously showed how to use the report Properties Links tab to link a report to the Computer Details for each client machine displayed in the report. On the same tab, you can choose the Link to Status Message Details option. This option provides a link next to each row of the report, which opens the details of the status message associated with that row. On the Links tab, you must specify the column that contains the status message record ID, which uniquely identifies the specific message. An example of a report that links to status message details is the All messages for a specific message ID report displayed in Figure 18.20.
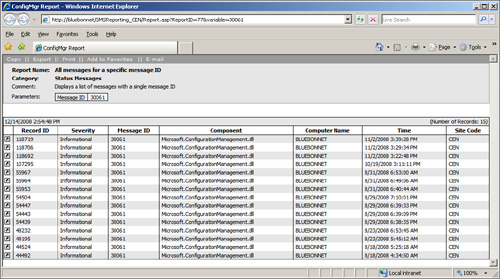
The first row of the report in Figure 18.20 displays summary information for the status message with record ID 118719. Clicking the link next to this row displays detailed information for that event occurrence. Figure 18.21 displays the details for this status message.
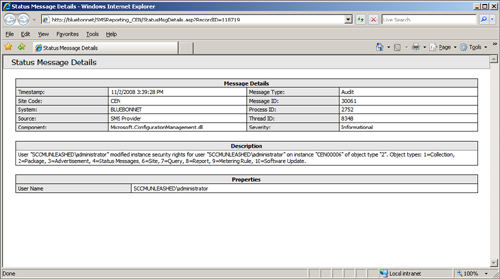
The description provides sufficient information to tell us that the Administrator account changed the permissions on the package with ID CEN00006, which turns out to be Adobe_Reader_Adobe_9_MNT. The message does not describe what specific permissions were changed.
The effectiveness of your ConfigMgr-based solutions is highly dependent on the client deployment coverage and the health of the ConfigMgr client components on your managed systems. All releases of ConfigMgr 2007 provide a variety of reports that use client inventory, discovery, and status message data to report on client operations and functionality. ConfigMgr 2007 R2 includes a new client status reporting (CSR) application, which gathers additional data from the management point and the clients themselves to provide enhanced client status reporting capabilities. The next sections look at how you can use both the standard reporting capabilities and the new features of R2 to help manage client operations and detect problems with client functioning.
You can use many of the reports in the Client Information and Discovery and Inventory report categories to track your client deployment and management operations and help troubleshoot problems with potential or existing clients.
The SMS Site – Client Information report category includes a number of reports that can help you plan and manage the client deployment at your sites. Here are some particularly useful reports for planning purposes:
• Computers assigned but not installed for a particular site
• Computers with a specific SMS client version
• Clients incapable of native mode communication
• Summary information of clients capable of native mode communication
• Computers with out of band management controllers
Some of the reports specifically designed to help you monitor the status of client deployment operations include the following:
• Client Deployment Failure
• Client Deployment Success
• Client Deployment Status Details
• Client Assignment Status Details
• Client Assignment Detailed Status
• Summary information of clients in native mode
• Status of client out of band management provisioning
• Issues by incidence summary
• Issues by incidence detail for a specified site
Tip
Determining Which Clients Are Ready for Native Mode
The Clients incapable of native mode communication, Summary information of clients in native mode, and Summary information of clients capable of native mode communication reports provide details on which clients have all certificates required for native mode. Before running these reports, you should run the Sccmnativemodereadiness.exe utility on each client computer to populate the site database with client readiness data. http://technet.microsoft.com/en-us/library/bb680986.aspx describes the Sccmnativemodereadiness.exe utility and provides steps to use ConfigMgr software distribution to assign the utility on client machines.
The Issues by incidence reports show issues reported by clients that connect to fallback status points due to problems communicating with the ConfigMgr site.
The SMS Site – Discovery and Inventory report category includes several reports that you can use to identify problems with existing clients. These reports include the following:
ConfigMgr 2007 R2 includes a new set of client status reporting tools for adding in-depth data about client status and health to the site database for reporting purposes. In addition to leveraging existing site data, R2 client status reporting pulls data from management points and directly from the clients. Client status reporting uses the following mechanisms to gather this data:
• Client Pulse— The CSR service connects to the management point, gathers management point logs, and extracts client policy request events. Clients normally request policy from their default management point at regular intervals, every hour by default.
• Client Ping— The CSR service attempts to ping inactive clients to determine whether the client’s name resolves successfully and the client responds to an ICMP (Internet Control Message Protocol) echo request. The service then attempts to connect to the client to check the status of the ConfigMgr client service and the Background Intelligent Transfer Service (BITS). Client ping requires that the clients are configured to respond to ping requests and the CSR service account has administrator rights on the client to connect to the service control manager. Internet-based client management does not support client ping.
To use client status reporting, you must set up a client status reporting point for your ConfigMgr site. The client status reporting point system must be running Windows XP SP 2 or higher, Windows Vista, Windows Server 2003 SP 2 or higher, or Windows Server 2008 (other than Core), with the .NET Framework 2.0 installed. ConfigMgr supports all editions of these operating systems except home editions of Windows XP and Windows Vista.
The client status reporting point does not require the ConfigMgr executive service and therefore is not required to be a ConfigMgr site system. Unlike site system roles, you do not configure the client status reporting point through the ConfigMgr console. Instead, you run ClientStatusReporting.msi from the Client Status Reporting folder of the ConfigMgr 2007 R2 installation media. The Installation Wizard is straightforward and only requires you to accept the license agreement and specify the client status reporting installation path. The Installer package creates a Microsoft ConfigMgr 2007 R2 Client Status Reporting program group with links to the configuration utility and the documentation. To configure client status reporting, perform the following steps:
- Launch Configure Client Status Reporting from the Microsoft ConfigMgr 2007 R2 Client Status Reporting program group.
-
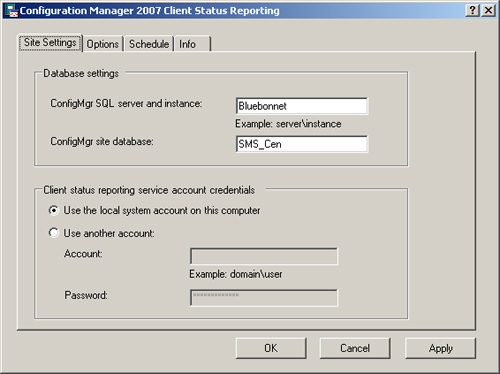
On the Site Setting tab, specify the site database server, database name, and the client status reporting service logon account. Figure 18.22 shows the Configure Client Status Reporting Site Settings tab.
In this example, the CSR tools are installed on the management point server, and the service runs under the local system account, which has administrative access. If the CSR service does not have administrative access on the management point, you need to perform additional steps to configure the management point to support client pulse functionality as described in the CSR documentation in the ConfigMgr help file.
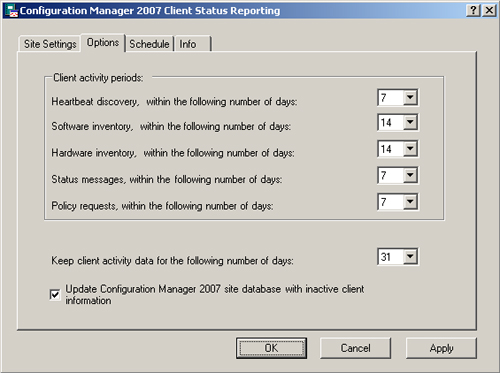
- On the Configure Client Status Reporting Options tab, select the intervals after which you will consider a client inactive if the site has not received discovery data, inventory, status messages, or policy requests from the client. The default interval is 7 days for each type of client activity. Figure 18.23 shows the Options tab.
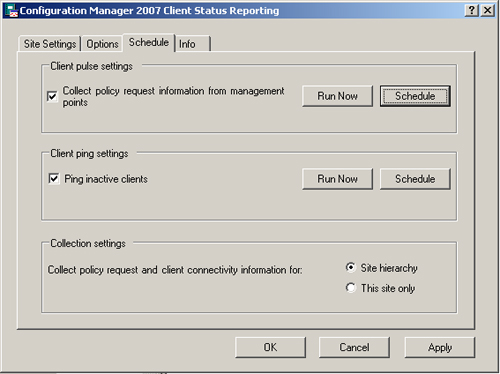
- On the Configure Client Status Schedule tab, specify whether to use client pulse and client ping and the schedule for these actions. You can schedule each of these actions for specific days of the week and specify the time of day for the action to occur. You can also use this tab to specify whether the client status reporting point is for the local site only or for the entire hierarchy. Figure 18.24 shows the Schedule tab.
Microsoft acquired AssetMetrix, an asset management software company, in 2006. They have used the technology from this acquisition to greatly enhance ConfigMgr asset recognition and reporting capabilities.
Microsoft introduced Asset Intelligence (AI) 1.0 functionality in SMS 2003 SP 3. The ConfigMgr 2007 RTM and SP 1 releases have included enhanced functionality with AI 1.1 and 1.5, respectively. This discussion focuses on support for Asset Intelligence 1.5 in ConfigMgr 2007 SP 1. You can find a comparison between the SMS 2003 version and Asset Intelligence in ConfigMgr 2007 at http://searchwindowsserver.techtarget.com/tip/0,289483,sid68_gci1301339,00.html, and Microsoft provides a datasheet at http://download.microsoft.com/download/5/9/8/598662ce-61db-474f-80a5-7b1dafc31843/Configuration_Manager_Asset_Intelligence_Datasheet.pdf. (These links are also provided in Appendix B, “Reference URLs.”)
ConfigMgr hardware and software inventory gather raw data about the components and files present on client computer systems. AI matches hardware and software elements to its extensive catalog of known devices and applications to convert inventory data into usable information about the assets in your environment. AI also integrates usage and license data to provide reporting capabilities on how information technology (IT) assets are used in your environment and compliance with licensing requirements. Here are some questions Asset Intelligence reports can help you answer:
• What IT hardware and software assets are deployed in the environment?
• Who is using IT assets, and what are the usage patterns and trends?
• What changes have occurred in the IT asset base?
• How are software licenses and Microsoft Client Access Licenses (CALs) used?
• What hardware is compatible with operating system and application software in use or proposed for deployment?
Asset Intelligence information collection is not enabled by default in ConfigMgr 2007. AI uses specific hardware inventory classes and software metering data to identify and report on various assets. Before enabling AI, you need to enable the hardware inventory agent and software metering agent at each site where you plan to gather AI data. Chapter 8 describes how to enable and configure client agents. To enable AI in ConfigMgr 2007 SP 1, perform the following steps:
- Expand the Configuration Manager console tree to System Center Configuration Manager -> Site Database -> Computer Management -> Asset Intelligence.
- Right-click the Asset Intelligence node and choose Edit Asset Intelligence Reporting Class Settings from the context menu.
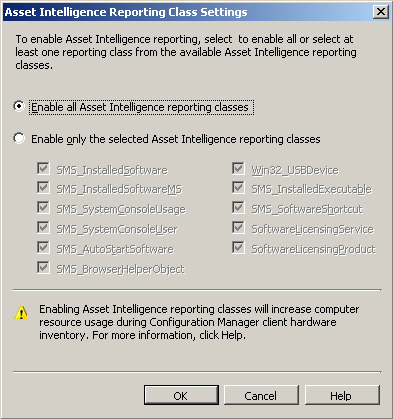
- On the Asset Intelligence Reporting Class Settings page, select the reporting classes you want to enable, and then click OK. Figure 18.25 displays this dialog box with the Enable all Asset Intelligence reporting classes option selected. Before making your selection, click the Help button and review the information about which reporting classes are required for each AI report. You can also view the list of reports using data from each class by hovering your mouse pointer over the class name. Enable only the AI reporting classes you need, to avoid increasing computer and network resource usage during the hardware inventory cycle.
Asset Intelligence uses logon events from the local Windows security event log to monitor Client Access License usage. If you plan to use AI to monitor CALs, complete the following tasks:
- Enable auditing of success logon events on client computers. Generally, you can accomplish this through Active Directory Domain Security Policy. For clients in workgroups or downlevel domains, you need to configure this setting in the local group policy on each system. The help files for your version of Windows describe how to accomplish these tasks.
- Edit the Configuration.mof file for each ConfigMgr site at which you collect CAL data to add appropriate settings to the CCM_CALTrackConfig WMI data class. The article at http://technet.microsoft.com/en-us/library/cc161947.aspx describes the CCM_CALTrackConfig WMI data class. Chapter 3 discusses editing the Configuration.mof file.
One of the most exciting new features in AI 1.5 is the ability to synchronize your Asset Intelligence catalog with System Center Online. This feature is available only to Microsoft Software Assurance (SA) customers who carry SA on ConfigMgr. For more information about the Microsoft Software Assurance program, see http://www.microsoft.com/licensing/sa/default.mspx. Previous versions of AI provide only a static catalog, which quickly becomes out of date. In addition to synchronizing with the latest online catalog, SA customers may submit data about unrecognized software to Microsoft for analysis, upload custom applications to share with the System Center community, and maintain local customizations of their own catalog.
To configure AI to synchronize with System Center Online, you must first install and configure an asset intelligence synchronization point in your ConfigMgr central site. Prior to installing your AI synchronization point, obtain a System Center Online authentication certificate file (.pfx) from your Microsoft representative and confirm that the site system on which you install the synch point can communicate with the Internet on port 443. Perform the following steps to configure the Synchronization Point site role:
- Add the asset intelligence synchronization point as a new server role for the appropriate site system. Chapter 8 describes adding site system roles.
- Enter the path to the certificate file (.pfx) on the New Site Role Wizard Asset Intelligence Synchronization Point Connection Settings page, and click Next.
- Configure the synchronization schedule on the Asset Intelligence Synchronization Point Schedule page.
ConfigMgr 2007 SP 1 allows you to import license information from a Microsoft Volume Licensing Software (MVLS) spreadsheet or custom spreadsheet in the appropriate format. MVLS customers can obtain this spreadsheet from their software reseller. For information about creating a custom spreadsheet for non-MVLS license information, see http://technet.microsoft.com/en-us/library/cc431362.aspx. To import license information, perform the following steps:
- Open the spreadsheet in the same version of Excel used to create it and save the spreadsheet as an .xml file. (You must use Microsoft Office Excel 2003 to convert spreadsheets with the .xls file extension and Microsoft Office Excel 2007 for spreadsheets with the .xlsx extension.)
- Expand the Configuration Manager console tree to System Center Configuration Manager -> Site Database -> Computer Management -> Asset Intelligence.
- Right-click the Asset Intelligence node and choose Import Software Licenses from the context menu.
- Browse to the location of your .xml license file, select the file, and click Finish to complete the License Import Wizard.
Microsoft provides a white paper on Configuration Manager 2007 Asset Intelligence at http://download.microsoft.com/download/d/0/f/d0f027ac-501c-415a-ba28-85c051d57da4/ConfigMgr_Asset_Intelligence_Whitepaper_FINAL_v4.pdf. (This link is also included in Appendix B as a live link.)
When you configure Asset Intelligence and allow time for the inventory collection process to populate AI data in the site database, you can view AI reports from the Reporting node of the ConfigMgr console similar to viewing any other reports. You can also view AI reports in the console, under System Center Configuration Manager -> Site Database -> Computer Management -> Asset Intelligence -> Asset Intelligence Reports. Within the Asset Intelligence report category, there are three subcategories, each of which provides extensive reporting capabilities:
• Hardware— Asset Intelligence reports in the Hardware category include reports on upgrade readiness of computers and reports that identify USB (Universal Serial Bus) devices attached to client systems. By recognizing specific hardware devices, AI gives you the capability to report on readiness for OS and application upgrades. Several reports in this category use logon information from the Security event log to report on the users who have logged on to the machine, and attempt to identify the primary user of each computer.
Identifying the primary user of a computer has been an ongoing challenge for SMS and ConfigMgr administrators. While the AI method is not perfect, it is another tool to help meet this challenge. The AI Hardware category also includes reports that detail changes made on client systems.
• Licensing— By leveraging licensing data along with software inventory data, AI provides extensive reporting capabilities on the licenses you own, license usage, and license expiration. AI licensing reports can help you solve some of the more difficult challenges in license compliance reporting, such as Client Access License (CAL) tracking and identifying Microsoft Developer Network (MSDN) software. You can use reports on per-user and per-device CAL usage to help determine how many client access licenses are in use.
AI can distinguish between different licensing SKUs (stock keeping units) such as retail or MSDN. The terms and conditions specified in MSDN license agreements differ from those in retail licenses, and the ability to recognize MSDN software is essential for determining whether your organization is appropriately and fully utilizing software used under this program. For more information about MSDN, see http://msdn.microsoft.com/.
Another license compliance challenge is distinguishing between different editions of software such as Microsoft SQL Server. The executable names are the same, for example, for SQL Server Standard Edition and SQL Server Enterprise Edition. AI matches file details with its asset catalog, presenting accurate information on SQL Server editions in your environment.
• Software— Reports in the AI Software category provide a far more detailed and meaningful picture of the software deployed in your enterprise than reporting on raw software inventory data. AI uses its catalog of more than 300,000 software products and versions to accurately identify applications and provide details about those applications.
AI categorizes software by family, such as application development software, industry-specific software, and software used by system components and peripherals. AI further distinguishes software titles by specific categories such as software for the mining industry or software for educational services. You can also add custom labels to software titles to provide additional information relevant to your business.
All this information is available though AI software reports. AI also provides reports on software configured as auto-start and browser helper applications. AI uses software metering data to report on software usage patterns such as recently used or infrequently used programs.
There is an active TechNet forum on Asset Intelligence at http://social.technet.microsoft.com/Forums/en-US/configmgrai/threads/.
One of the major challenges of deploying operating system upgrades, service packs, and patches is identifying potential application and hardware compatibility issues and device driver upgrade requirements. To help system administrators address these issues, Microsoft provides the Application Compatibility Toolkit (AppCompat or ACT). The Microsoft ACT connector for Configuration Manager uses AppCompat data to help you plan for Vista and Windows Server 2008 upgrades or service pack deployments for Windows XP and higher versions of Windows. To use the ACT connector, you must complete the following tasks:
- Download and install the Application Compatibility Toolkit. The ACT toolkit is available from http://technet.microsoft.com/en-us/library/cc507847.aspx.
- Install the ACT connector by running setup from the ConfigMgr 2007 installation media and selecting System Center Configuration Manager Application Compatibility Toolkit Connector from the installation options.
-
Create and deploy the appropriate ACT data collection packages (DCPs). The ACT documentation describes how to create the DCPs. You can use ConfigMgr software deployment to deploy the DCPs. Chapter 14, “Distributing Packages,” describes software deployment.
You should deploy the Inventory Collector DCP to collections of up to 5,000 systems at one time to identify the applications on your target systems. After developing an application inventory, deploy a Windows Vista Compatibility Evaluator DCP to a representative collection of machines to evaluate possible compatibility issues such as User Account Control (UAC) compatibility issues, applications using deprecated application programming interfaces (APIs), systems with a non-Microsoft Graphical Identification and Authentication (GINA) and applications requiring access to session 0.
- Expand the Configuration Manager console tree to System Center Configuration Manager -> Site Database -> Computer Management -> Application Compatibility Toolkit Connector. Click Run Device Driver Synchronization from the Actions pane. This task retrieves the latest driver compatibility information from the Microsoft online database.
Note
Processing Time for Data Collection Packages
It can take up to 7 days for the ACT toolkit to retrieve and analyze application compatibility data from 5,000 machines.
After completing the steps in this section, you can use reports in the following categories to analyze your systems for issues related to Vista or Windows 2008 Server upgrades:
• Upgrade Assessment – Windows Server 2008
• Upgrade Assessment – Windows Vista
• Upgrade Assessment – Windows XP
Each report category includes reports that can help you determine which of your systems meet minimum and recommended hardware requirements for the relevant upgrades, and identify systems needing additional free disk space or hardware upgrades. Additional reports in the Windows Vista category display application and driver-compatibility information and availability status for driver upgrades.
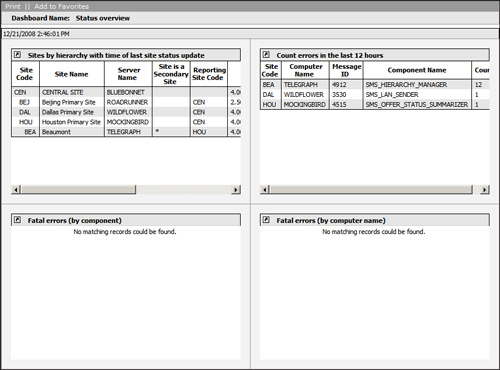
ConfigMgr 2007 uses dashboards to present several related reports on a single page. This section creates a dashboard to display the overall status of the sites in your hierarchy, the number of errors reported by each site in the past 12 hours, and the fatal errors by component and by computer. To create the dashboard, perform the following steps:
- Expand the Configuration Manager console tree to System Center Configuration Manager -> Site Database -> Computer Management -> Reporting.
- Right-click the Dashboard’s node and choose New Dashboard.
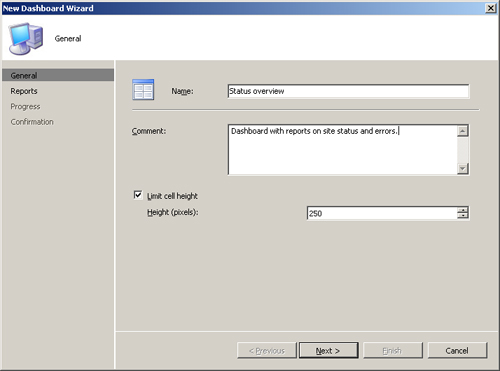
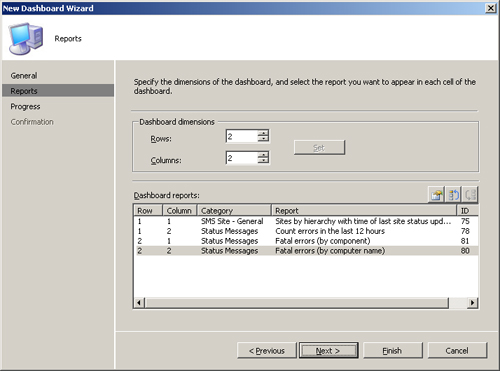
- On the New Dashboard Wizard General page, enter the name for your dashboard, an optional comment, and the maximum height in pixels for the cells that contains individual reports. The default value for the maximum cell height is 250 pixels. Click Next to continue. Figure 18.26 shows the New Dashboard Wizard General page.
- On the Reports page, select the dimensions of the dashboard in rows and columns and the reports you want to include in the dashboard. Click Next to complete the Reports page, and Close when you receive confirmation the dashboard has been successfully created. The Reports page provides buttons to select reports and move them up or down in the display order. Dashboards can include only those reports that do not require prompted values. Figure 18.27 shows the New Dashboard Wizard Reports page.
You can view the dashboard by navigating to the Configuration Manager console Dashboards node, right-clicking the dashboard and selecting Run. Alternately, you can open the Reporting Site home page in your web browser and navigate to the dashboards node of the Report Viewer. Figure 18.28 shows the Status overview dashboard as rendered in the ConfigMgr console.
The ready-made reports Microsoft includes with ConfigMgr provide extensive capabilities for reporting on your environment and operations. However, you might sometimes need to customize these reports to get just the right report to fit your requirements. Here are several ways you can customize reports:
• Change layout and display characteristics of a report. For example, you can re-order the columns, add a chart or modify the existing chart, or add or modify a link.
• Change which data rows or columns are included in the report.
• Add data from additional Configuration Manager database tables or add data ConfigMgr does not capture by default through inventory or discovery customizations.
• Add data from sources outside the Configuration Manager database.
The following sections present examples of each of these types of customization.
Note
Cloning Reports
For purposes of discussion, some examples in this section modify the default Configuration Manager reports. In reality, you generally want to clone the original report and make your modifications to the cloned copy.
To clone a report, expand the Configuration Manager console tree to System Center Configuration Manager -> Site Database -> Computer Management -> Reporting -> Reports. Right-click the report and choose Clone. You need to supply a new name for the cloned report.
To customize the order the columns appear in a report, you can edit the report’s SQL statement and simply re-order the items in the selection list. The “Dashboards” section in this chapter shows how to create a dashboard to display critical status information. One of the reports used was Sites by hierarchy with time of last site status update. This report provides a useful view of your sites, including their hierarchical relationships and status. The most relevant data for the status dashboard, however, is in the columns on the right of the report. You cannot view the status information in the report in the upper-left quadrant of the dashboard (as shown in Figure 18.28) without scrolling to the right. To change the column order so that the status information appears earlier in the report, perform the following steps:
- Expand the Configuration Manager console tree to System Center Configuration Manager -> Site Database -> Computer Management -> Reporting -> Reports. Right-click the Sites by hierarchy with time of last site status update report, and choose Properties.
-
On the Properties page for the report, select the General tab and click the Edit SQL Statement button. A portion of the report’s SQL statement is:

-
Edit the SQL Statement by moving the SiteName, ServerName, C085 (this is the secondary site indicator), ReportingSiteCode, and version columns to the end of the selection list. The resulting SQL statement will be:

-
Click OK to close the Edit SQL Statement dialog box and again to close the report Properties page. You can now run the report or the dashboard to view the results of your changes. Figure 18.29 displays the Status Overview dashboard reflecting the report modifications.
Figure 18.29. The modified dashboard is the same as the one in Figure 18.28, except the first report now displays status date and overall site status.

You can also use the report Properties dialog box to add a chart or link to an existing report or to modify an existing chart or link. Chapter 6 introduces Jeff Tondt’s SMSMap utility. You can add a link to the Sites by hierarchy with time of last site status update report, which displays a map of your hierarchy as follows:
- Use SMSMap to create the hierarchy map and save it as a graphical interchange format (gif) file in a file system directory under your SMS reporting folder. The reporting folder in this example is http://bluebonnet/SMSReporting_CEN. You can use the Internet Information Service (IIS) Manager in the Administrative Tools program group on Bluebonnet to view the properties of the SMS_Reporting folder under the default website and see that the file system path for the folder is c:inetpubwwwrootSMSReporting_CEN. The SMSMap is saved as c:inetpubwwwrootSMSReporting_CENimagesSMSMap.gif. (See the Windows Server help files for information about using IIS Manager.)
- Open the report Properties by following step 1 of the previous procedure and click on the report Properties page Links tab. Choose Link to URL from the Link type drop-down list and enter http://bluebonnet/SMSReporting_CEN/images/smsmap.gif in the URL box; then click OK to save your changes. The report now displays a link icon next to each of the site codes, allowing you to reference the site hierarchy map.
ConfigMgr reports are based on the ConfigMgr database views. You can add columns to your report or remove columns from the report by changing the selection list in the report SQL statement. You can also filter which rows display in the report, by modifying the WHERE clause of the report SQL statement or by specifying additional qualifiers.
The “Reporting on Computers Based on Specific Criteria” section in this chapter discusses the Computers with low free disk space (less than specified MB free) report, shown in Figure 18.17. To add or remove columns from this report, perform the following steps:
- Expand the Configuration Manager console tree to System Center Configuration Manager -> Site Database -> Computer Management -> Reporting -> Reports. Right-click the Computers with low free disk space (less than specified MB free) report and choose Properties.
-
On the report Properties page General tab, click the Edit SQL Statement button. A portion of the report’s SQL statement is:

-
The SQL statement’s FROM clause on the third and fourth lines of the code listing in step 2 indicates that the report is based on data from the v_FullCollectionMembership and v_GS_LOGICAL_DISK views. Figure 18.30 displays the Query Builder interface, which you can use to select columns from these views to display in the report. This figure shows v_GS_LOGICAL_DISK in the views list and VolumeSerialNumber0 in the columns list as selected. After clicking the Insert button, add the view alias LDISK as a column prefix and a comma after the column name. You should also add the LDISK.Compressed0 column from the same view and SYS.Domain0 from the v_FullCollectionMembership view. The modified selection list is as follows:
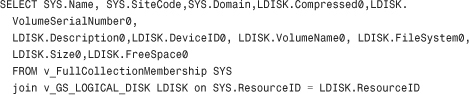

The modified report now includes domain information from the system view, and the volume serial number and compression attribute from the logical disk view. Figure 18.31 displays the new report.
Figure 18.31. The modified Computers with Low Disk Space report includes additional information not shown in Figure 18.17.
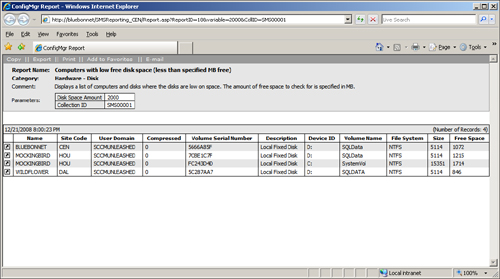
The “Reporting on Computers Based on Specific Criteria” section also discusses the Computers with a specific product name and version report. Notice that the example of this report displayed in Figure 18.18 contains two identical rows for each entry. This is common in ConfigMgr reports and occurs because one or both views contain records that are identical with respect to the data selected for the report but differ on some characteristic that is not of interest. This example contains two entries for Microsoft SQL Server version 9.00.3042.00 on each computer. Let’s look at the SQL code used for the Computers with a specific product name and version report:
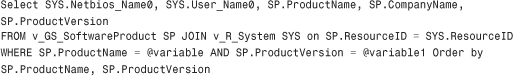
Chapter 3 introduces the native SQL Server 2005 Query Tool. It is often easier to use the Query Tool rather than the Query Builder interface when you want to quickly experiment with a number of changes to SQL statements and see the results. To find the source of the apparent duplicate entry, paste this SQL statement into the Query Tool and change the selection list in the first line of the statement by replacing the specific columns from the v_GS_SoftwareProduct view (alias SP) with the wildcard SP.*. This returns all available columns from v_GS_SoftwareProduct. You also want to replace the variables in the WHERE clause with the literal strings ‘Microsoft SQL Server’ and ’9.00.3042.00’ to avoid having to populate the report prompt parameters at run time. The resulting SQL statement is
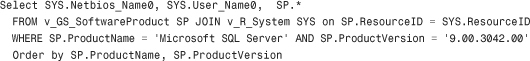
Running the modified query in the SQL Query tool generates the results shown in Figure 18.32.
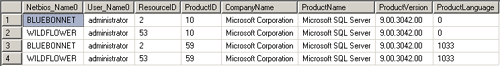
The data in rows 1 and 3, for example, is identical with the exception of the ProductID and ProductLanguage columns. The product information is gathered from file headers by the software inventory process, and the database contains inventory from files that show the product language code as 0 and from files showing the product language code as 1033. Each language version is also distinguished by Product ID. Product language information is not necessary for this report, so filter the data by adding the keyword distinct to the selection list in the original SQL statement:
![]()
This example has the prompt variables in the SQL statement replaced with literal strings to make the query easier to work with using the Query Tool. You might also want to use this technique to modify reports so that you can use them in dashboards or send to users with prepopulated parameters. You cannot use the Computers with a specific product name and version report in a dashboard because it contains prompts. However, the modified SQL statement that explicitly specified the product name ‘Microsoft SQL Server’ and product version ‘9.00.3042.00’ could be used to create a dashboard report, or could be sent to your database administrators to provide specific information about that SQL Server version.
Another common issue with reports is seeing stale data included in the report. The site database often includes data about inactive computers, which are not reporting heartbeat discovery, or obsolete records about computers that have been re-imaged or replaced. To exclude this data from your reports, add the following conditions to the WHERE clause of your SQL statement:
SYS.Obsolete0 <> 1
SYS.Active0 = 1
Tip
Removing Old Data from the Site Database
ConfigMgr provides maintenance tasks that can periodically remove various types of outdated data from the site database. You can greatly improve the quality of data in many of your reports by enabling these tasks and optimizing them for your environment. Chapter 21 describes how to configure database maintenance tasks. If you use AD discovery methods, you also need to make sure old data is regularly removed from your AD to avoid ConfigMgr rediscovering objects from AD that no longer exist on your network.
In some cases, you might want to filter data based on criteria not in the base views for the report you work with. As an example, the Computers with a specific product name and version report is based on software inventory data, so you might want to ensure you are looking only at data from systems that have recently reported software inventory. The last software inventory scan date is in the v_GS_LastSoftwareScan view, which is not part of the report. To add the view to the report and filter for only those systems with inventory scans in the last 30 days, perform the following steps:
-
Add the v_GS_LastSoftwareScan to the JOIN clause of the report’s SQL statement. Using the Query Builder or the SQL Query Tool, you can list the columns of v_GS_LastSoftwareScan.
Like all ConfigMgr resource views, v_GS_LastSoftwareScan contains a ResourceID column. Use this to add this view to the report by changing

to

-
The columns from v_GS_LastSoftwareScan are now available for the report, so add the following condition to the WHERE clause:
LSS.LastScanDate > (getdate ()-30)
The final SQL statement looks like this:
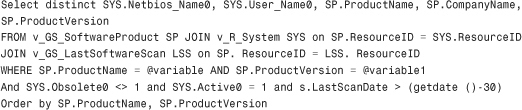
The report now includes modifications to show only distinct rows and exclude data from obsolete records and machines that are inactive or have not reported software inventory in the past 30 days.
With their default settings, ConfigMgr discovery and inventory methods gather a wide variety of data that you can use to report on your environment. If you need additional information about your client systems or discovered AD objects, there is a good chance ConfigMgr can get the data you need. The following sections present examples of customizing AD discovery and hardware inventory to extend your reporting capability.
The Configuration Manager AD discovery methods import information about computers, users, and security groups from the AD database. Each method has a default set of attributes that it retrieves from the directory. You can specify additional attributes you want to include in the AD system discovery and AD user discovery methods. As an example, add the department, telephone number, and title to the AD user discovery method, and then display these attributes in a customized report. Perform the following steps to add attributes to the AD user discovery method:
- Expand the Configuration Manager console tree to System Center Configuration Manager -> Site Database -> Site Management -> <Site Code> <Site Name> -> Discovery Methods. Right-click Active Directory User Discovery and choose Properties.
- In the Active Directory User Discovery Properties dialog box, select the Active Directory attribute tab, click the new (starburst) button, enter the name of the attribute you want to add, and click OK. Figure 18.33 displays the dialog box for adding the Title attribute.
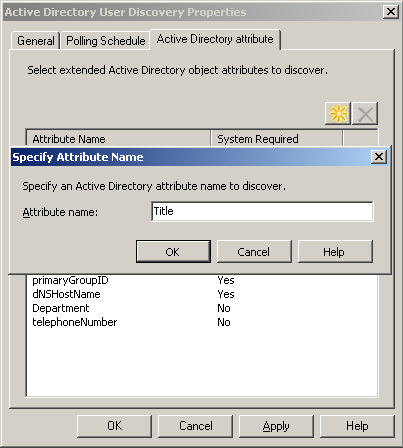
Tip
Using ADSIEdit to View Object Attributes
Chapter 3 introduces the ADSIEdit MMC snap-in, which you can use to view and edit Active Directory objects. To view the available attributes for user or computer objects, run ADSIEdit, expand the domain naming context, and select an object of the appropriate type. Right-click the user or computer object and choose Properties. This launches the Attribute Editor, which displays a complete list of available attributes for the object type.
When the discovery method runs, it generates data discovery record (DDR) files for each object it discovers. When the ConfigMgr Discovery Data Manager (DDM) component processes a DDR containing a new property, the DDM updates the WMI resource class and the site database with the new property. ConfigMgr automatically adds the new property to the appropriate resource view, which makes it available for reporting. The resource view for user data is v_R_User. Having specified the attributes you want in the user resource view, let’s see how to add them to a report.
The Asset Intelligence report category includes a number of reports on user activity, such as the systems, software, and licenses the user has used. Including additional user details might make these reports more useful in understanding who the user is and how to contact them. Figure 18.34 shows the Hardware 05A – Console users on a specific computer report, which displays all users who have logged on to the machine’s console.
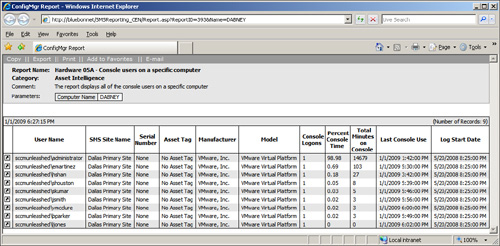
An abridged version of the SQL statement for this report is as follows:
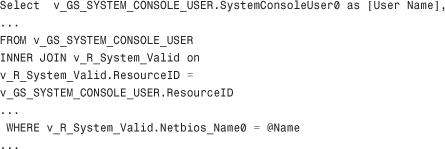
To create a report showing details about the users that have logged on to a particular computer, you can clone the Hardware 05A – Console users on a specific computer report and modify the SQL statement as follows:
• In the FROM clause, add the following join to the user resource view.
![]()
• In the select list, remove columns you are not interested in and add details from the user resource view. The list of columns added from the user resource view include the telephoneNumber, Department and Title AD attributes added to the AD User Discovery method in Figure 18.33, as follows:
![]()
Figure 18.35 displays the modified console users report.

Chapter 3 discusses the role of the SMS_Def.mof file in hardware inventory, and Chapter 12 explains how to enable additional inventory data items by editing this file. This section demonstrates how to use these additional classes in ConfigMgr reports. The hardware inventory process gathers basic data about each network adapter’s IP configuration by default. Figure 18.36 displays the IP – Information for a specific computer report for the computer Bluebonnet, which shows the basic network adapter inventory data.
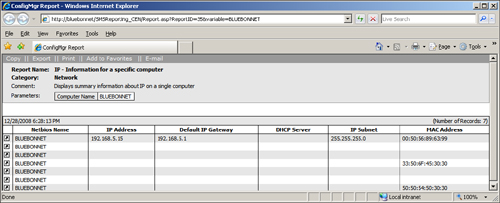
The next example adds the DNS server and DNS suffix search order to this report. Perform the following steps:
-
Use a text editor such as Windows Notepad to locate the following lines in class Win32_NetworkAdapterConfiguration section of the SMS_Def.mof file:

-
Change SMS_Report value for each of these items from FALSE to TRUE:

This change causes the hardware inventory agent on computers in the site to collect and report the DNS server and DNS domain suffix search order values for each configured network adapter. When the site server processes inventory files containing this information, it appends two new rows to the Network_DATA table in the site database:
• DNSDomainSuffixSearchOrde0
• DNSServerSearchOrder00
Remember that Microsoft bases Configuration Manager reports on SQL views rather than the underlying tables. Here is the SQL statement for the IP – Information for a specific computer report:
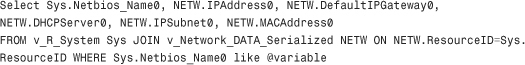
The FROM statement in the third line above reveals the report uses network information from the view v_Network_DATA_Serialized. Unlike the resource views used to report on discovery data, the inventory views are not updated automatically when you add new attributes to ConfigMgr inventory.
Chapter 3 also introduces the SQL Server Management Studio. You can use SQL Server Management Studio to examine and edit the v_Network_DATA_Serialized view. Perform the following steps:
- Launch SQL Server Management Studio from Start -> Programs -> Microsoft SQL Server 2005 -> SQL Server Management Studio.
- After connecting to the site database server SQL instance, expand <servername> -> database -> SMS_<Site Code> -> views in the tree control in the left pane.
-
Right-click the v_Network_DATA_Serialized view and choose Edit. This opens a query window that displays the SQL statement required to alter the view. V_Network_DATA_Serialized is based on the following select statement:
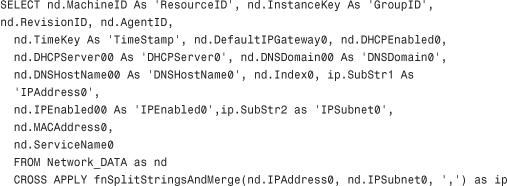
-
Add the following attributes to the SELECT list; then click the Execute button from the SQL Server Management Studio toolbar:
nd.DNSDomainSuffixSearchOrde0, nd.DNSServerSearchOrder00
The v_Network_DATA_Serialized view now includes the DNS domain suffix search order and DNS server configuration information.
Note
About Changes to Default Views
Future upgrades to ConfigMgr might overwrite customizations you make on default ConfigMgr objects, including views. You should document all customizations and be prepared to re-create your custom views following a service pack or upgrade.
To display this information in the IP – Information for a specific computer report, edit the SQL statement for the report and add the DNSDomainSuffixSearchOrde0 and DNSServerSearchOrder00 columns to the SELECT list. You also need to remove NETW.DHCPServer0 from the list. Figure 18.37 displays the resulting report for the computer Bluebonnet.
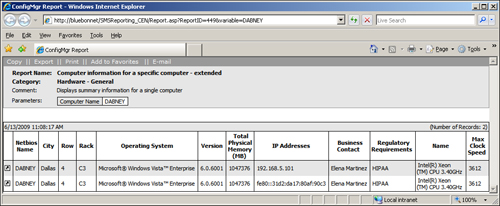
You undoubtedly have other applications and data stores in your environment that contain information related to your ConfigMgr client systems and other objects in the site database. Although reports linking to external data sources are not strictly ConfigMgr reports in that they are not based exclusively on the ConfigMgr views, linking in external data can be useful for a variety of purposes. This section presents an example of a report that uses data from the v_R_System view and from an external spreadsheet. The example imports the spreadsheet data into the ConfigMgr database. You can also use data in a separate database on a local server or on another SQL Server.
Note
About Fully Qualified Object Names in SQL Server
Up to now, the discussion has focused exclusively on objects in the ConfigMgr site database. When objects such as tables and views are in the site database, you can refer to them by the simple object name, and ConfigMgr reporting will know where to find them. To reference data stored in other databases or on other servers, use the four part or fully-qualified name in the form server.database.schema.object. For example, the fully qualified name for the sites table in the central site database for SCCMUnleashed.com is bluebonnet.sms_cen.dbo.sites. The dbo schema is the default schema for objects created by the database owner. The server, database, and schema qualifier are optional but must be supplied if the appropriate values differ from the defaults.
For more information on SQL Server object naming, see the Transact-SQL Syntax Conventions topic in the Transact-SQL Reference, part of the online books that you can install from the SQL Server installation media.
Figure 18.38 shows a portion of a spreadsheet in which the SCCMUnleashed IT department keeps information about systems in the company data centers.
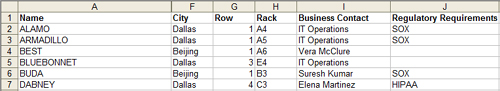
To add the sample data to the Computer information for a specific computer report, perform the following steps:
- Open the spreadsheet in Microsoft Excel, then choose File -> Save As from the Excel menu, and save as a file of type text (tab delimited). Save this file as systeminfo.txt.
- Open SQL Server Management Studio and connect to the site database server. Expand the Databases node in the Object Explorer (the tree on the left side), right-click the site database, and choose Tasks -> Import Data. This launches the SQL Server Import and Export Wizard.
- Click Next on the wizard’s startup page. On the Choose a Data Source page, choose Flat File Source from the data source list box and browse to the location of the saved text file. Click the Column names in the first text row checkbox, and then click Next. Figure 18.39 shows the Choose a Data Source page with the appropriate options selected.
- On the next page of the wizard, verify that the row delimiter is {CR}{LF} and Tab {t} is the column delimiter; then click Next.
- On the Choose a Destination page, the default options should show the destination as SQL Native Client and the servername and database name for your site database. Verify that the options are correct and click Next.
- The Select Source Tables and Views page shows your file mapped to a database table with the same name. Click Next to accept this mapping.
-
The wizard’s Save and Execute Package page offers options to execute the import immediately to save the data import package. If you plan to update the data in the future, you can use a saved package to import your updated data on demand or on a scheduled basis.
After selecting the appropriate options, click Next and then Finish, which completes the wizard.
- Expand the Tables node under the site database in the Object Explorer tree. Right-click the newly created table and choose Properties, and then select the Permissions page. Click the Add button and add webreport_approle to the list of users and roles. Check Select in the Grant column of the list of explicit permissions for webreport_approle and click OK. Figure 18.40 shows the Permissions page for the systeminfo table.
- Open the Configuration Manager console and navigate to the Reports node. Right-click on the Computer information for a specific computer report, choose Clone, and enter the name for the new report. Name the new report Computer information for a specific computer – extended.
-
Right-click the new report, choose Properties, and then edit the report’s SQL statement. Locate the following portion of the statement:

Insert an additional join condition for the systeminfo table. The edited section will be

Edit the selection list at the beginning of the SQL statement and replace the following column names:

with:

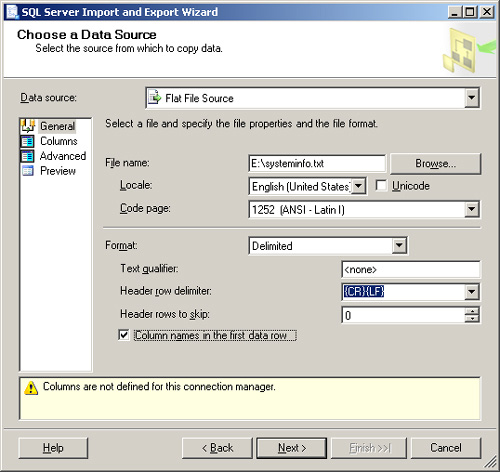

Figure 18.41 shows the Computer information for a specific computer – extended report for the computer DABNEY.
Figure 18.41. The Computer information for a specific computer – extended report for the computer DABNEY

Microsoft provides guidance and examples for developing custom reports at http://technet.microsoft.com/en-us/library/dd334620.aspx, and you can download additional documentation including a Visio diagram of the ConfigMgr SQL views by accessing Microsoft’s download center, http://www.microsoft.com/downloads and searching on Creating Custom Reports By Using Configuration Manager 2007 SQL Views.
Custom reporting is also one of the most active topics on the myITforum SMS/ConfigMgr email discussion list. For information regarding the discussion list and subscribing to the list, see http://www.myitforum.com/lists/#Microsoft_Systems_Management_Server_(SMS)_List.
Given the wide variety of ready-made reports Microsoft provides, it is generally easier to clone a report that is close to what you need and modify it than to create a new report from scratch. There might be times, however, when you want to start with a blank slate and create an entirely new report. The next sections discuss how to create new reports both in classic reporting and in SRS.
To create a new classic report, perform the following steps:
- Expand the Configuration Manager console tree to System Center Configuration Manager -> Site Database -> Computer Management -> Reporting -> Reports. Right-click the Reports node and choose New -> Report.
- On the New Report Wizard General page, enter the name, category, and an optional comment for your report. Figure 18.42 shows the New Report Wizard General page for the report named Drill Through Sequence for a Specific Report, created using this wizard. This report displays a sequence of reports you can open through links, beginning with an initial report selected by the user.
-
Click Edit SQL Statement to launch the Query Builder dialog box, and enter the following SQL statement for the report:

The user is prompted at run time to supply the value of the @ReportName parameter. To define the properties for the prompt, select Prompts to launch the prompts dialog box, and then click the New Prompt (starburst) icon to access the Prompt Properties page shown in Figure 18.43.
- On the Prompt Properties page, enter the prompt name to use in the report SQL statement (ReportName in this example) and the prompt text you want displayed to users. Click the Edit SQL Statement button to launch the Query Builder dialog box, and enter the SQL statement used to provide the list of available values to the user:
-
After completing the SQL Statement dialog boxes, click Next to complete the wizard’s General page and again to accept the defaults on the Display, Links, and Security pages. When you receive confirmation that the report creation was successful, click Close to complete the wizard.
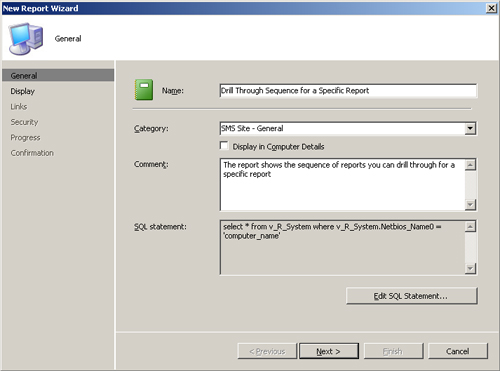


Figure 18.44 shows the Drill Through Sequence for a Specific Report showing the sequence of linked reports beginning with the All Software Companies report.
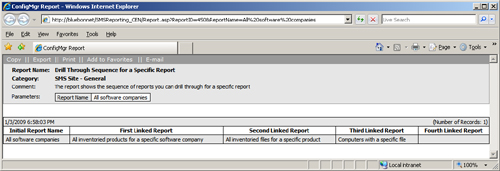
Perform the following steps to create a new ConfigMgr 2007 R2 SQL Reporting Services based report:
- Expand the Configuration Manager console tree to System Center Configuration Manager -> Site Database -> Computer Management -> Reporting -> Reporting Services. Right-click on the report server name and choose Create Report.
- The Create Report Wizard Information page allows you to select either a model-based report or a SQL-based report. SQL–based reports allow you to enter SQL statements directly, as in the previous example in the “Creating Classic Reports” section. Figure 18.45 displays choosing to create a model–based report.
- Microsoft provides the ClientStatusReporting and SoftwareUpdateManagement reporting models for Configuration Manager. Figure 18.46 shows the Model Selection page with the SoftwareUpdateManagement model selected. Click Finish to complete the wizard, or if you prefer to view a summary page and confirm your selections click Next, and then click Next on the Summary page and Close on the Confirmation page.
- When the Create Report Wizard finishes, the Microsoft Report Builder launches automatically. The Report Builder is a graphical development environment that allows you to create, edit, and test SRS reports. For more information about using the Report Builder to design ConfigMgr reports, see http://technet.microsoft.com/en-us/library/cc678431.aspx.


One of the most useful SRS features is the ability to create subscriptions. Subscriptions allow you to publish the latest version of a report on a scheduled basis to email recipients or save to a Windows file share.
Note
Prerequisites for SRS Subscriptions
If you plan to use email delivery for SRS report subscriptions, you need to configure the SMTP (Simple Mail Transport Protocol) server and other email settings using the Microsoft SQL Server 2005 Reporting Services configuration tool. Depending on the option selected on the Data Source Authentication tab when you configure the Reporting Services Point site system role, you might also need to use the SRS configuration tools to configure an unattended execution account used to render reports for subscription-based delivery. If you chose the Credentials stored securely in the report server data source authentication option, it is not necessary to configure an execution account. The “Configuring the Reporting Services Point for SRS Reporting” section of this chapter discusses data authentication options. For information about installing SRS and using the SRS configuration tool, see http://technet.microsoft.com/en-us/library/cc512033.aspx.
To create a subscription, perform the following steps:
- Expand the Configuration Manager console tree to System Center Configuration Manager -> Site Database -> Computer Management -> Reporting -> Reporting Services -> <servername> -> All Reports. Right-click the report you want to create a subscription for, and choose New Subscription.
- Figure 18.47 shows the New Subscription Wizard – Subscription Delivery page for the Computers with a specific product name and version report. The options selected sends a report in Adobe PDF format to the email recipient [email protected]. The subject line will be Visual Studio installation report and the email will be delivered as a Normal priority message.
- Use the New Subscription Wizard – Subscription Schedule page to create a delivery schedule for the subscription. Figure 18.48 shows the Subscription Schedule page. The report delivery is specified for a weekly basis at 8:00:00 PM Sunday to avoid rendering the report during peak usage hours.
- If your subscription is based on a report containing prompts, use the Subscription Parameters to supply values for the parameters. Figure 18.49 shows the Subscription Parameters page for the Computers with a specific product name and version report.
- To complete the New Subscription Wizard, click Next on the Summary page. Click Close when you receive confirmation that the subscription was successfully created.
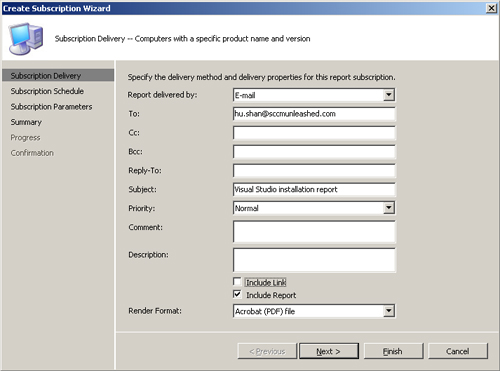


The process is essentially identical for delivery to a file share, other than the options entered on the Subscription Delivery page. Figure 18.50 shows those options required to post a series of regularly incremented versions of the Visual Studio report to a file share. To use file share delivery, you must specify an account with at least Change permission on the specified share at both the share and file system level.

Some common issues with ConfigMgr reports include the following:
• Classic web reports, SRS reports, or dashboards not displayed correctly in Internet Explorer. If you have problems viewing reports, verify that the client has IE 5.01 SP 2 or later installed and the ConfigMgr reporting site is in the trusted sites or local intranet zone in your browser security settings. If charts and graphs in classic reports do not display correctly, verify that Microsoft Office Web Components (Microsoft Office 2000 SP 2, Microsoft Office XP, or Microsoft Office 2003) are installed on your reporting point server.
• You receive an Access Denied error when trying to view reports. Verify the user account has appropriate rights on the report you are attempting to view and is a member of the Report Users or local Administrators group on the reporting point server. For troubleshooting purposes, you might want to log on with an administrative account and attempt to view the same report.
• Running SRS reports from the Configuration Manager console fails with an insufficient privileges message. Make sure you have the SRS My Reports privilege, or as a workaround run the report from the SRS web page rather than the console. Chapter 20 discusses SRS privileges.
• Rerunning a SQL Reporting Services report in the Configuration Manager console does not reflect recent changes to the report. As a workaround, right-click the System Center Configuration Manager -> Site Database node in the Configuration Manager console tree, choose Report Options, and enable the Open reports in a new window option.
• You receive timeout errors when running reports. IIS uses several timeout values that govern report execution. You might need to change one or more of these timeout values if you experience frequent timeout issues:
• Use IIS Manager in the Administrative Tools program group to modify the ASP script timeout value. The exact procedure varies depending on the version of IIS you run. The procedures for IIS 6 and IIS 7 are available at http://technet.microsoft.com/en-us/library/bb632464.aspx.
• Use a text editor to modify the DBConnectionTimeout and DBCommandTimeout values in the Global.asa file in the report folder virtual directory. These settings specify the time that an ActiveX control waits for a database connection and a result set, respectively, before timing out. The default settings are 30 seconds for the connection timeout and 300 seconds for the command timeout.
Tip
Optimizing Report Queries
The majority of report execution time generally is spent executing queries and retrieving results. To avoid timeout issues and provide better report performance, you can use tools such as the Query Analyzer and SQL Profiler to optimize your queries. In some cases, you might also need to tune SQL Server to provide better performance and avoid timeouts.
Query optimization and SQL Server performance tuning are major topics of interest for database administrators, and there is a vast amount of information available on these topics. A good place to start is the SQL Server Query Processing Team blog, at http://blogs.msdn.com/sqlqueryprocessing/default.aspx. Detailed information on SQL Server query optimization and performance tuning is also included in another volume in this series, Microsoft SQL Server 2005 Unleashed (Sams, 2006), which is available at http://www.mypearsonstore.com/bookstore/product.asp?isbn=0672328240.
This chapter discusses Microsoft Configuration Manager 2007 reporting features. It includes a discussion of both classic ConfigMgr reporting and the new SQL Reporting Services reporting introduced with Configuration Manager 2007 R2. The chapter describes reporting related site and site system configuration, use cases for reporting, and creating and modifying reports. The next chapter describes one of the most compelling feature sets in Configuration Manager 2007, Operating System Deployment (OSD).