Chapter One. The Worldwide Graphic Language for Design
Objectives
After studying the material in this chapter, you should be able to:
1. Describe the role of graphics in the design process.
2. Identify stages in the design process.
3. Contrast concurrent versus traditional design processes.
4. List five professions that use technical drawings.
5. Describe four creativity techniques.
6. Explain why standards are important.
7. Identify three purposes for technical drawings.
Refer to the following standard:
• ANSI/ASME Y14.100 Engineering Drawing Practices
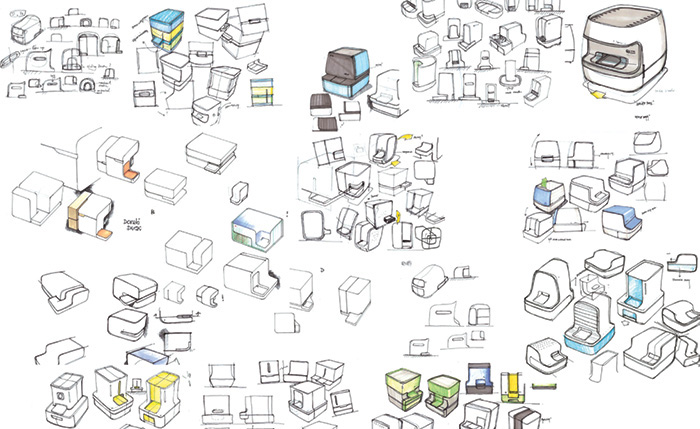
Conceptual Sketches. Exploring many design options through quick sketches is one method that Lunar, recently named one of the top 10 award-winning American product design firms by BusinessWeek magazine, uses to create beautiful products and successful brands. (Images courtesy of LUNAR.)
Understanding the Role of Technical Drawings
Drawings and specifications control the many details of product manufacture, assembly, and maintenance. Both ease in freehand sketching and the ability to use computers to produce CAD models and technical drawings are valued skills in the global marketplace. Conveying information graphically requires knowledge of the standards that allow drawings to concisely communicate designs around the world.
Technical drawings can take many forms: idea or concept sketches (such as the sketches on the previous page), computation sketches, design sketches, layout drawings, part drawings, working or construction drawings, electrical drawings, installation drawings, and assembly drawings are all examples. Sketches, 2D CAD drawings, and 3D CAD models are all forms of technical drawing. Some of these types of technical drawings are shown in Figures 1.1 through 1.3. Each of these types of drawings and others have a place in the process of designing and building a product, system, or structure. In general, technical drawings serve one of three purposes:

A wide variety of professions use technical drawings to communicate and document designs. Some examples are civil engineering, mechanical engineering, electrical engineering, architecture, bio-resource engineering, landscape design, landscape architecture, industrial design, construction engineering, construction technology, pattern making, project management, fabrication, and manufacturing. There are many others.
Whether you are designing a bridge, installing underground power lines in a subdivision, or designing a plastic housing for a new toaster, understanding and using technical drawing is a key skill you will need.
The Design Process
The organized and orderly approach to solving problems is known as the design process. The engineering design process addresses society’s needs, desires, and problems by applying scientific principles, experience, and creativity.
Different types of technical drawings have a specific function in the engineering design process. For example, freehand sketches capture and document the ideation process. Later in the process, CAD models and drawings capture the design and specify the details necessary for manufacture.
The design process for any product requires a clear understanding of the functions and the performance expected of that product. The steel beam construction shown in Figure 1.5 is very different from the styling and functional requirements of the products shown in Figure 1.4, but the stages in the design process are similar for both.

1.4 These drills all perform similar functions, but a consumer’s choice of one over another may depend on the product’s styling and aesthetics as well as function. (©Shutterstock/Vereshchagin Dmitry.)

1.5 A project engineer in a hard hat examines a blueprint. (Courtesy of Dennis MacDonald/Photo Edit, Inc.)
It has been estimated that 70% to 80% of the cost of product development and manufacture is determined during the initial design stages. Although many industrial groups may identify them in their own way, one procedure for designing a new or improved product follows the stages shown in Figure 1.6:
1. Problem identification: First, a clear statement of the need for and objectives for the design must be written.
2. Ideation: Technical sketches are often used to convey concepts to multidisciplinary teams.
3. Refinement/analysis: Designs may be rethought, based on engineering analysis. CAD models and sketches are useful during the analysis and compromise stage. Accurate 2D or 3D CAD models and drawings are created to refine the design.
4. Implementation/documentation: Production and/or working drawings providing the details of manufacture and assembly are finalized and approved.

Ideally, the design moves through these stages, but as new information becomes available, it may be necessary to return to a previous stage and repeat the process. For example, based on engineering analysis, the familiar phrase “back to the drawing board” might come into play at the refinement/analysis stage.
Concurrent Engineering
Traditionally, design and manufacturing activities have taken place in sequential order rather than concurrently (simultaneously). Designers would spend considerable effort and time analyzing components and preparing detailed part drawings, and then forward them to other departments. For example, the materials department would use the drawing to identify the particular alloys and source vendors to use. The manufacturing department would then identify the processes needed for efficient production. This step-by-step approach seems logical, but in practice it has been found to be wasteful.
For example, if a manufacturing engineer wanted to taper the flange on a part to make it easier to cast in metal, or to choose a different alloy, the design analysis stage would have to be repeated to ensure that the product would still function effectively. These iterations, illustrated in Figure 1.7a, may be necessary, but they waste resources, and more importantly, time. Time is important because early product introduction makes possible a greater market percentage (and hence greater profits) and a longer life before the product becomes obsolete (clearly a concern with products such as consumer electronics).

Concurrent engineering is a systematic approach that integrates the design and manufacture of products with the goal of optimizing all elements involved in the life cycle of the product. Figure 1.7b illustrates the concurrent design process.
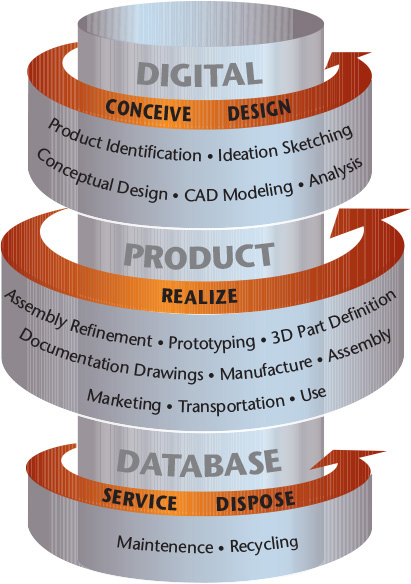
Life cycle design means that all aspects of a product (such as design, development, production, distribution, use, and its ultimate disposal and recycling) are considered simultaneously. Figure 1.8 depicts the life cycle of a product from conception to disposal.
The basic goals of concurrent engineering are to minimize product design and engineering changes and to reduce the time and cost involved in taking a product from concept through production and ultimately to the marketplace. In concurrent engineering, all disciplines are involved in the early design stages, so that natural iterations result in less wasted effort and lost time.
Communication between and within disciplines is especially important in a concurrent design process. Effective interaction among engineering, marketing, and service functions, as well as among engineering subdisciplines, is recognized as crucial to this type of process. Cross-disciplinary communication also helps provide a fertile environment for innovative approaches that can lead to savings in material and production costs.
Computer-Aided Design and Product Development
For both large and small companies, product design often involves preparing analytical and physical models of the product that can be used to study factors such as forces, stresses, deflections, and optimal part shape. The necessity for these types of models depends on how complex the product is. Today, the process of constructing and studying analytical models is simplified by using computer-aided design (CAD), computer-aided engineering (CAE), and computer-aided manufacturing (CAM) techniques. These systems allow rapid design analysis for simple objects as well as complex structures.
CAD allows for a range of activities, from modeling 2D and 3D geometry to creating drawings that document the design for manufacturing and legal considerations.
CAM provides computerized control for manufacturing processes. Examples include using a computer interface to control a lathe, or generating the path for milling machine tools directly from the CAD model. In more sophisticated systems, CAM can be used in materials handling, assembly, and inspection.
CAE allows users to simulate and analyze structures that will be subject to various temperatures, static loads, or fluctuating loads. Kinematic analysis studies moving parts. Some of these functions are integrated with CAD software, and other packages import data from a CAD system. Using these tools, engineers can simulate, analyze, and test designs efficiently, accurately, and quickly.

A Structural Designer Working with CAD. (Courtesy of Kryczka/iStockphoto.com.)
Designing Quality into Products
Companies use a number of systematic ways to try to design “quality” into their products as well as to measure performance and make decisions based on data. Designers may feel that their creative approach to problem solving is stifled when these systems are poorly implemented in the workplace; but when these systems are well implemented, organizations can show quality improvement.
DFSS Design for Six Sigma is an approach that uses engineering and statistical tools to design products in a way that predicts and minimizes customer and manufacturing problems.
Six Sigma is a process originated at Motorola to improve quality by reducing or eliminating defects.
DMAIC Define, Measure, Analyze, Improve, and Control are steps defined in a continuous improvement process that attempts to define and ensure critical to function (CTF) characteristics.
QFD Quality Function Deployment is a tool for decision making that helps companies focus on a customer-driven approach and set of product characteristics.
The Digital Database
Computer use continues to change the way products are produced. All the information to manage, design, analyze, simulate, package, market, and manufacture a product can be shared with a diverse (and perhaps geographically distant) group of users through a single complex digital database.
Product data management (PDM) systems or enterprise data management (EDM) systems electronically store the various types of data associated with designing and manufacturing a product. An effective PDM system allows all the product data to be quickly stored, retrieved, displayed, printed, managed, and transferred to anywhere in the organization. This allows for designs to be optimized or directly modified at any time. Costs, product revisions, and engineering change orders (ECOs) can be analyzed, tracked, and implemented quickly. Managing enterprise data requires commitment and planning, but companies who implement PDM effectively can capture product data once and utilize it many ways to achieve a competitive advantage (Figure 1.9).

1.9 Product Data Management. PTC’s Windchill is an enterprise-wide product data management system designed to be extended to serve data over the internal network (or intranet). Data from the database are provided to external users via a secure, password-protected site (to share nonpublic information with suppliers and other partners in remote locations). (Courtesy of Parametric Technology Corporation.)
1.1 Graphics Tools in Action
Designers and engineers use graphics for visualization, communication, and documentation throughout the design process. A case study from Santa Cruz Bicycles will illustrate the tools used in the redesign of its V10 model, a downhill racing mountain bike, shown in Figure 1.10.
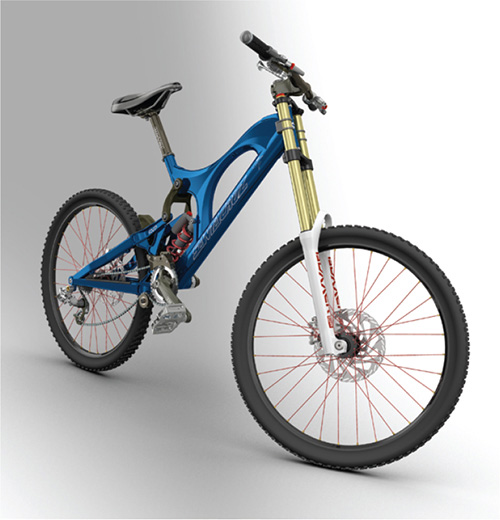
1.10 The V10 is a generation of downhill racing bikes first sold in 2002 and continually improved based on race team results and rider feedback. The 3D model of the new design is shown here. (Courtesy of Santa Cruz Bicycles.)
Design Phase: Problem Identification
The impetus for the V10, as for most racing bikes, was higher performance. In 2000, Santa Cruz Bicycles (SCB) purchased three patents for suspension systems that had never been developed. Most bikes have suspension on the front wheel; these patents showed how rear suspension could be manipulated to improve performance and control.
The bicycle’s suspension has two roles: absorbing bumps and translating the pulsing motion coming from the human pedaler into forward movement. The balance between how far the wheel can move up and down and maximal forward motion determines bike performance.
The first V10 was ridden in 2002. Its rear suspension allowed the wheel to travel vertically 10 inches. At that time, 8–8.5 inches of travel was common among competitors.
When SCB set out to update the V10 design, better performance was a key criterion. The design team included the product manager (who interfaced with marketing), two design engineers, and racers who rode the V10. The team members had plenty of information for defining the problem: they were familiar with the design drawings, performance specifications, and manufacturing costs of the V10 already being produced. Racing teams provided feedback about how the current design handled and where they envisioned improvement. Racers and engineers viewed race videos to see how the bike performed on courses with more or less rugged terrain. Marketing provided information about competitors’ bikes and how the V10 measured up against them.
At the problem identification stage, the team worked to enlarge the criteria for judging the solution. The team identified three primary goals for the redesign:
• Get maximum forward movement from a suspension that also absorbs bumps.
• Improve the handling to give the rider better control.
• Minimize the weight to make a lighter bike.
Design Phase: Ideation
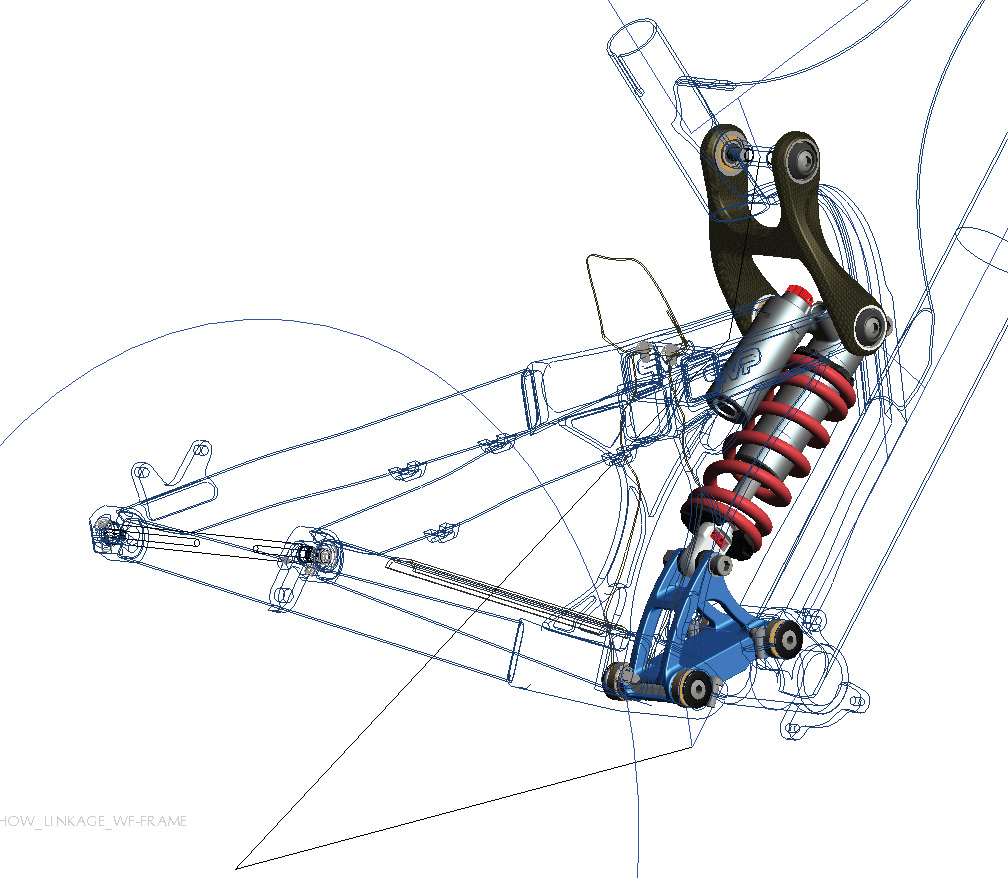
The design team focused first on the geometry of how the parts of the bike are arranged. Unlike the frame of a conventional bicycle, the V10’s frame is in two parts. The back wheel connects to a triangular “swingarm” that attaches to the front frame with a pivot (see Figure 1.11). The length of the parts, the angles between them, and their movement determine how the bike handles. In the ideation phase, the team captured and evaluated different combinations of handlebar placements, seat, crank, pivots to the wheels and shock absorbers, and more. How much the shock absorbers allow the wheel to travel vertically, the pivot locations, and link sizes all affect how the bike will perform.

1.11 The V10’s rear wheel attaches to a triangular swingarm that connects to the front part of the frame with a pivot. This allows the rear wheel to travel up and down. (Courtesy of Santa Cruz Bicycles.)
At the ideation stage, being able to draw a readable freehand sketch is vital to “selling” your idea to your design team colleagues. This stage is called universal possibilities because the group seeks to consider every possible solution and not limit the design by preconceived notions of what will be best.
For each subsystem of the bike, the team generated and evaluated many concepts. For example, they brainstormed all the ways a pivot assembly might be made. They also employed a kind of “contest” to spur creativity and generate options. One engineer would be given 1.5 days to come up with a combination of parts and materials to make a subsystem, such as a link mechanism. Then, the design tasks would be shuffled and a different engineer would have 1.5 days to define an alternative approach to the link mechanism. Using a whiteboard, the team would then list the pros and cons of each subsystem design.
Design Phase: Decision Process/Design Selection
The design selection process varies by company and by the design challenge. It may be informal and conducted by a single individual, or it may be a highly formal process in which different teams compete for development dollars for new products. In all cases, design selection narrows the field of options for the final design.
SCB’s team needed to evaluate how the parts would move. They created 3D skeleton models in CAD. A skeleton model is a simplified representation of the centerlines and other shapes that capture the design geometry. These skeleton models are useful for kinematic analysis (Figure 1.12).
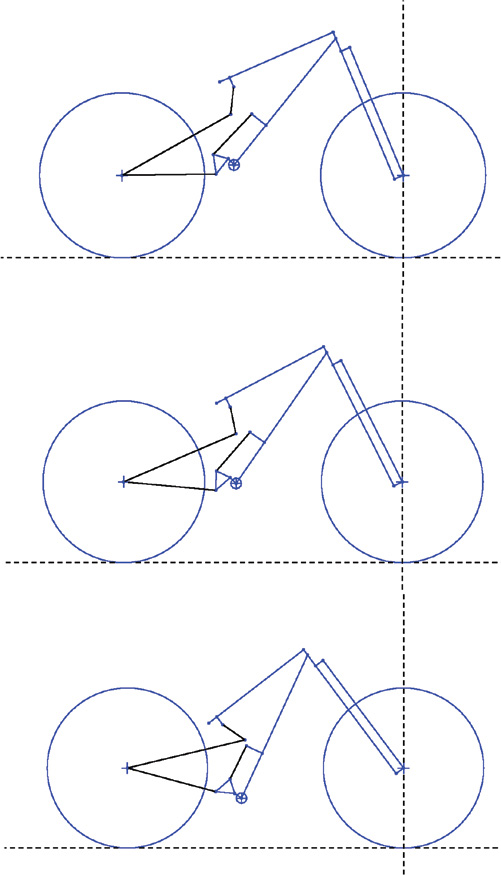
1.12 Skeleton models were used for kinematic analysis of different combinations of the swingarm geometry. The model shows how much the swingarm can pivot. (Courtesy of Santa Cruz Bicycles.)
Data generated from each model showed the behavior of the suspension and how the bike handled. Data from the kinematic analysis were captured in a spreadsheet and used to compare the various arrangements of lengths and angles in the designs (Figure 1.13).
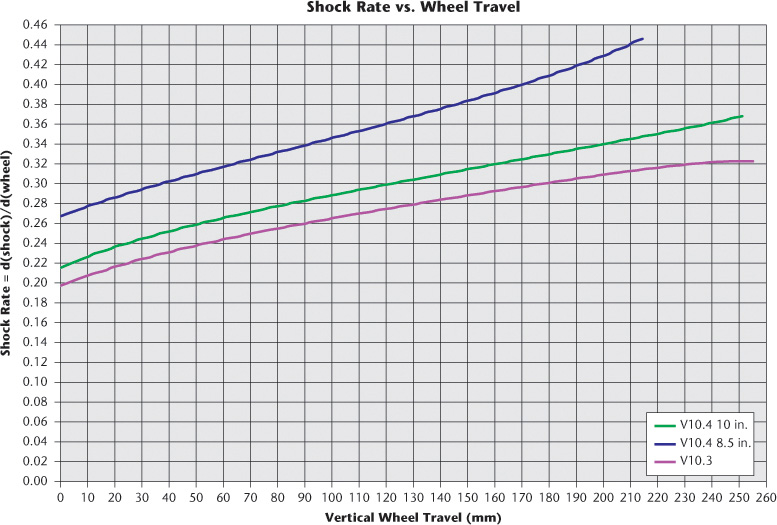
1.13 This graph compares the measure of rear-wheel travel produced from the skeleton model during ideation. (Courtesy of Santa Cruz Bicycles.)
Even at this early stage, drawings and models can be used to elicit customer feedback. If the user interface is important to a product, a 3D model or a computer simulation provides a way to get early user feedback. These models may be shown to customers informally, or more formally through focus groups.
At SCB, promising combinations were translated into simple prototypes that could be used to verify the concept. Called “mules,” these proto-bicycles were fabricated so that a human rider could evaluate the handling (Figure Figure 1.14).

1.14 This prototype “mule” for the V10 can be ridden and evaluated by a human rider. (Courtesy of Santa Cruz Bicycles.)
For a new product, the design team generally prepares a product proposal to show the management group approving new products. Drawings or sketches are used to communicate key features of the device. Rendered models or prototypes convey options for the final look. The proposal may include a product plan, sales estimates, and cost figures for developing the product. It estimates the profit to be generated by the product and describes how it will meet the criteria for a new product, such as helping to achieve company goals or promising the best return on investment. The ability of the design team to communicate effectively through drawings, spreadsheets, written communication, and oral presentation all play a role in the product’s acceptance for development.
The preliminary design selection group for the V10 consisted of design engineers, manufacturing engineers, and the product manager. (At some companies, the team might also include members from finance or executive management.)
Function was the primary criterion for this review of the V10’s redesign. Spreadsheets with data from the skeleton models, graphs comparing different options, and measurements from the prototypes were used to make the selection. Feedback from the riders who rode the “mules” was an important part of the process as well.
Design Phase: Refinement
When a product is approved for further development, the team moves into the refinement and analysis phases of the project. Because these two phases form another “loop” in the design process, they are often combined into a single stage called the development phase.
During the refinement stage, the product concept is solidified into an accurate plan for making the product. Different options are evaluated in terms of how much they will cost, how long they will take to make, how well they satisfy the customer’s requirements, how durable they will be, how difficult they are to assemble and service, how environmentally sustainable the design is, and so forth. At this stage members may join the design team to provide expertise in these different areas.
At Santa Cruz Bicycles, the team had chosen a functional design and was now ready to begin defining the part features, styling, and materials for the bike. During refinement, the design is updated as more information is determined about the designed components and their manufacturing processes (see Figure 1.15).
1.15 This subassembly is a combination of features that were evaluated during refinement. (Courtesy of Santa Cruz Bicycles.)
At this point, time and money are invested in creating a model to represent the product accurately. At Santa Cruz, two or three combinations of features were modeled in 3D and used to analyze and test the design further.
The following were criteria at this point:
Weight: How much will a component or choice of material add to the weight of the bike? Strength: Can the material used to make the part stand up to the stresses generated during a bike race?
Cost: Is a lower-cost option available? Or is the cost justified because of what it adds to performance?
Optimization: Does the choice result in fewer parts to make or better clearance between parts?
The team used an informal concept/criteria matrix to evaluate the options against multiple criteria. For example, manufacturing the frame using carbon fiber instead of aluminum would affect the cost but would decrease the weight of the bike by 15%–17%. The matrix can tally the pluses and minuses of various options to aid in comparing them.
At Santa Cruz, bicycles are modeled in Pro/ENGINEER, a parametric solid modeling package. Parametric or constraint-based modeling captures relationships between part features and the sizes of the features. These relationships capture the design intent for the part. They define features in terms of characteristics that must be preserved when the part changes. For example, the key design criteria for a pair of holes for mounting a bracket might be that each be the same distance from the center of the part. Defining the location of the holes to be half the width of the bracket from its midline ensures that when the bracket gets wider, the holes will move accordingly. Similarly, when a part is defined in terms of its relationship to another part, changes in that part will cause any related parts to be updated automatically (see Figure 1.16). This flexibility makes it easy to test many different versions of a design—and is ideal for continually refining and improving racing bikes like the V10.
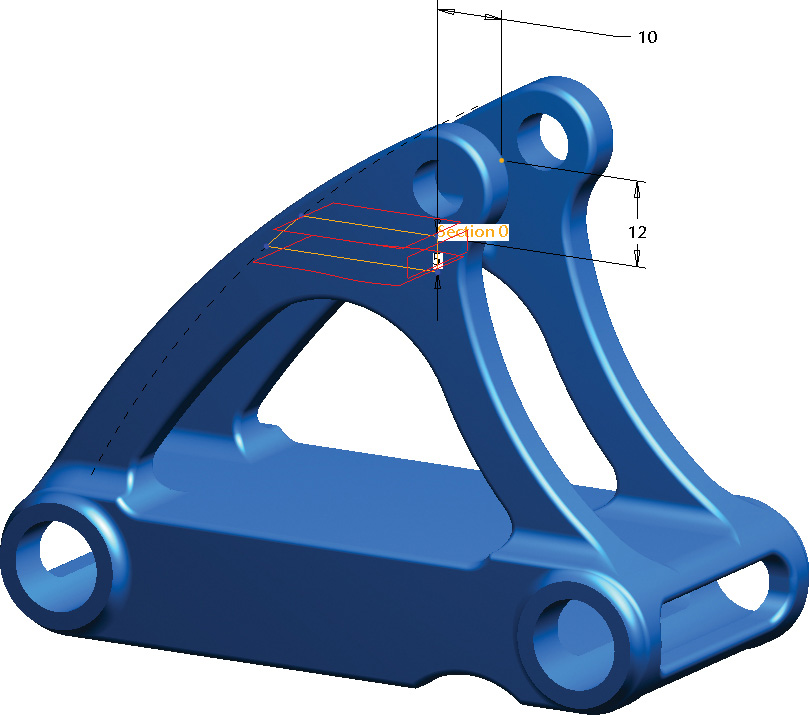
1.16 The rib shown here in red is constrained to be 10 mm back of and 12 mm down from the pivot point. If the pivot location is changed, the rib will be updated to preserve the relationship defined by the constraints. (Courtesy of Santa Cruz Bicycles.)
Design Phase: Analysis
The analysis phase tests the design and feeds back information to refine the design further, forming the second key iteration or “loop” in the design process. Crucial here are the performance criteria that the design must meet.
For the V10, the assembled solid model could be tested like a real bike. By specifying the material for each part, the team assessed the total weight of the bike as designed. Stress analysis (finite element analysis) predicted where parts or the frame might be likely to break (see Figure 1.17). The model was also used to evaluate the bike’s fit for riders of different sizes. Human factors software provides a database of different body types and sizes for this purpose. The team can simulate what an Asian female in the 50th percentile for height and weight sees while riding, what she can reach, and the location of her center of mass. The same can be done for a white male in the 50th percentile (see Figure 1.18).

1.17 Finite element analysis can be performed within the solid modeling software, or the model can be imported into a separate analysis package. (Courtesy of Santa Cruz Bicycles.)

1.18 “Mannequins” of various shapes and sizes can be added to the solid model to assess ergonomic factors. (Courtesy of Santa Cruz Bicycles.)
At this point, the model can also be used for manufacturing analysis. At Santa Cruz, manufacturing engineers identify aspects of the design that will be hard to manufacture: a part shape that will require special tooling or be difficult to weld, or parts that must be made to a high degree of precision (tolerance).
Tools that work within the solid modeling packages are available for much of the analysis. Analysis for moving parts, such as the rear wheel suspension, can be done in Pro/ENGINEER (and other modelers) and tested under a wide range of physical conditions—even zero gravity! Human factors and stress testing are two more examples of analysis that can be done in the 3D modeler. For more advanced or specialized testing, a wide range of software can import the 3D model data.
Whether the analysis software recommends a change or simply reports results, it is up to the design engineer to interpret the tests and take steps to refine and test the design further until the desired results are achieved.
Design Phase: Decision Process/Design Selection
Once a design is ready to manufacture, another design review may be required. At each stage of the design process, more is invested in the design, and design changes become more costly. At the ideation stage, many ideas are investigated at relatively low cost. In the refinement stage, more time and money are devoted to building and testing models, and the cost of making major design changes increases. After the second design review, companies commission molds and tooling, purchase materials, and commit other resources to manufacturing the product. After this point, major design changes become very costly and can threaten a product’s success. The second selection process, often called critical design review, is a filter that allows only the products with the greatest chance of success to proceed.
The selection team and review process may be very similar to the one that precedes refinement, or it may involve a completely different set of criteria. Understanding the review criteria helps you make an effective presentation and also helps you make better design decisions in the context of your company’s goals.
For the V10, more stakeholders evaluated the design at this point. Representatives from marketing, sales, and graphic design were added to the team, and the aesthetics of the design were considered (see Figure 1.19). How will the logo fit onto the bike as designed? Which look is more marketable? Should a straight or a curved tube be used for the swingarm? What are the implications of the manufacturing cost for the bike’s sales potential?

1.19 Multiple options for the look of the frame triangle were considered in the final design review. (Courtesy of Santa Cruz Bicycles.)
Design Phase: Implementation
During the implementation phase, the design is communicated to those responsible for manufacturing, assembling, and distributing the product. Up to this point, drawings and models served a variety of purposes. In the implementation phase, they become contracts with suppliers. The model and the accompanying drawings (if any) must clearly specify what constitutes an acceptable part.
As in refinement, the 3D solid model serves as the information database. Dimensioned multiview drawings may be generated directly from the solid model. Increasingly often, manufacturing processes are directed from the model itself, with no need for an intermediate drawing. In these cases, tolerances may be noted in the model, or critical dimensions and tolerances marked on a drawing may be sufficient.
Tooling for a bicycle’s design can cost as much as $120,000, so care is taken to be sure that the tools are correct. SCB uses a detailed checklist to ensure that they are ready to have the tools made for manufacturing the bicycle. Because the 3D model is used to communicate the design to the toolmakers, it is sent to them for review and analysis before the final design is documented.
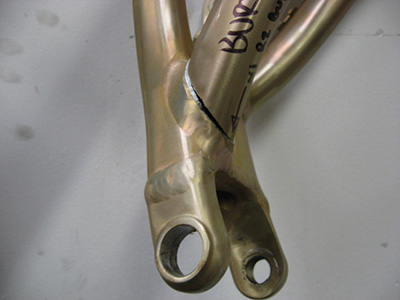
Sample parts are requested so that the physical parts can be measured against the model and tested to see how they fit together. Mechanical testing, ride testing, and destructive testing are done on the sample parts while there is still time to make a change to alleviate problems (see Figure 1.20). Once engineering is satisfied with parts as manufactured, the models for the design are approved.
Although the design has been finalized, there still may be changes during the implementation phase (as well as later when the product is in production). With rapid prototyping and design simulations using the solid model, it is easier and more cost effective to anticipate these issues in the refinement stage, but it is not uncommon for fine-tuning to occur during implementation. Unavailable parts or materials can force a substitution, a supplier may recommend a cheaper alternative, standard parts may be substituted for newly designed ones, or unanticipated problems may crop up during assembly. Sustainability issues can affect a design throughout the lifetime of the product.
Assembly drawings may be generated to document the parts included in an assembly and to illustrate how they fit together. The parts list, or bill of materials, is an important facet of inventory planning and assembly. Parts from the solid model may be catalogued in a company-wide parts database. Parts in the database can be reused or shared by other products, and standard parts inventories can be tracked and monitored.
Design Phase: Documentation
The documentation phase of the design process captures the final design and freezes it. Each company has its own procedures for managing models and controlling changes to the model database, but it must create permanent records for archival purposes, patent applications, and other legal uses (see Figure 1.21).
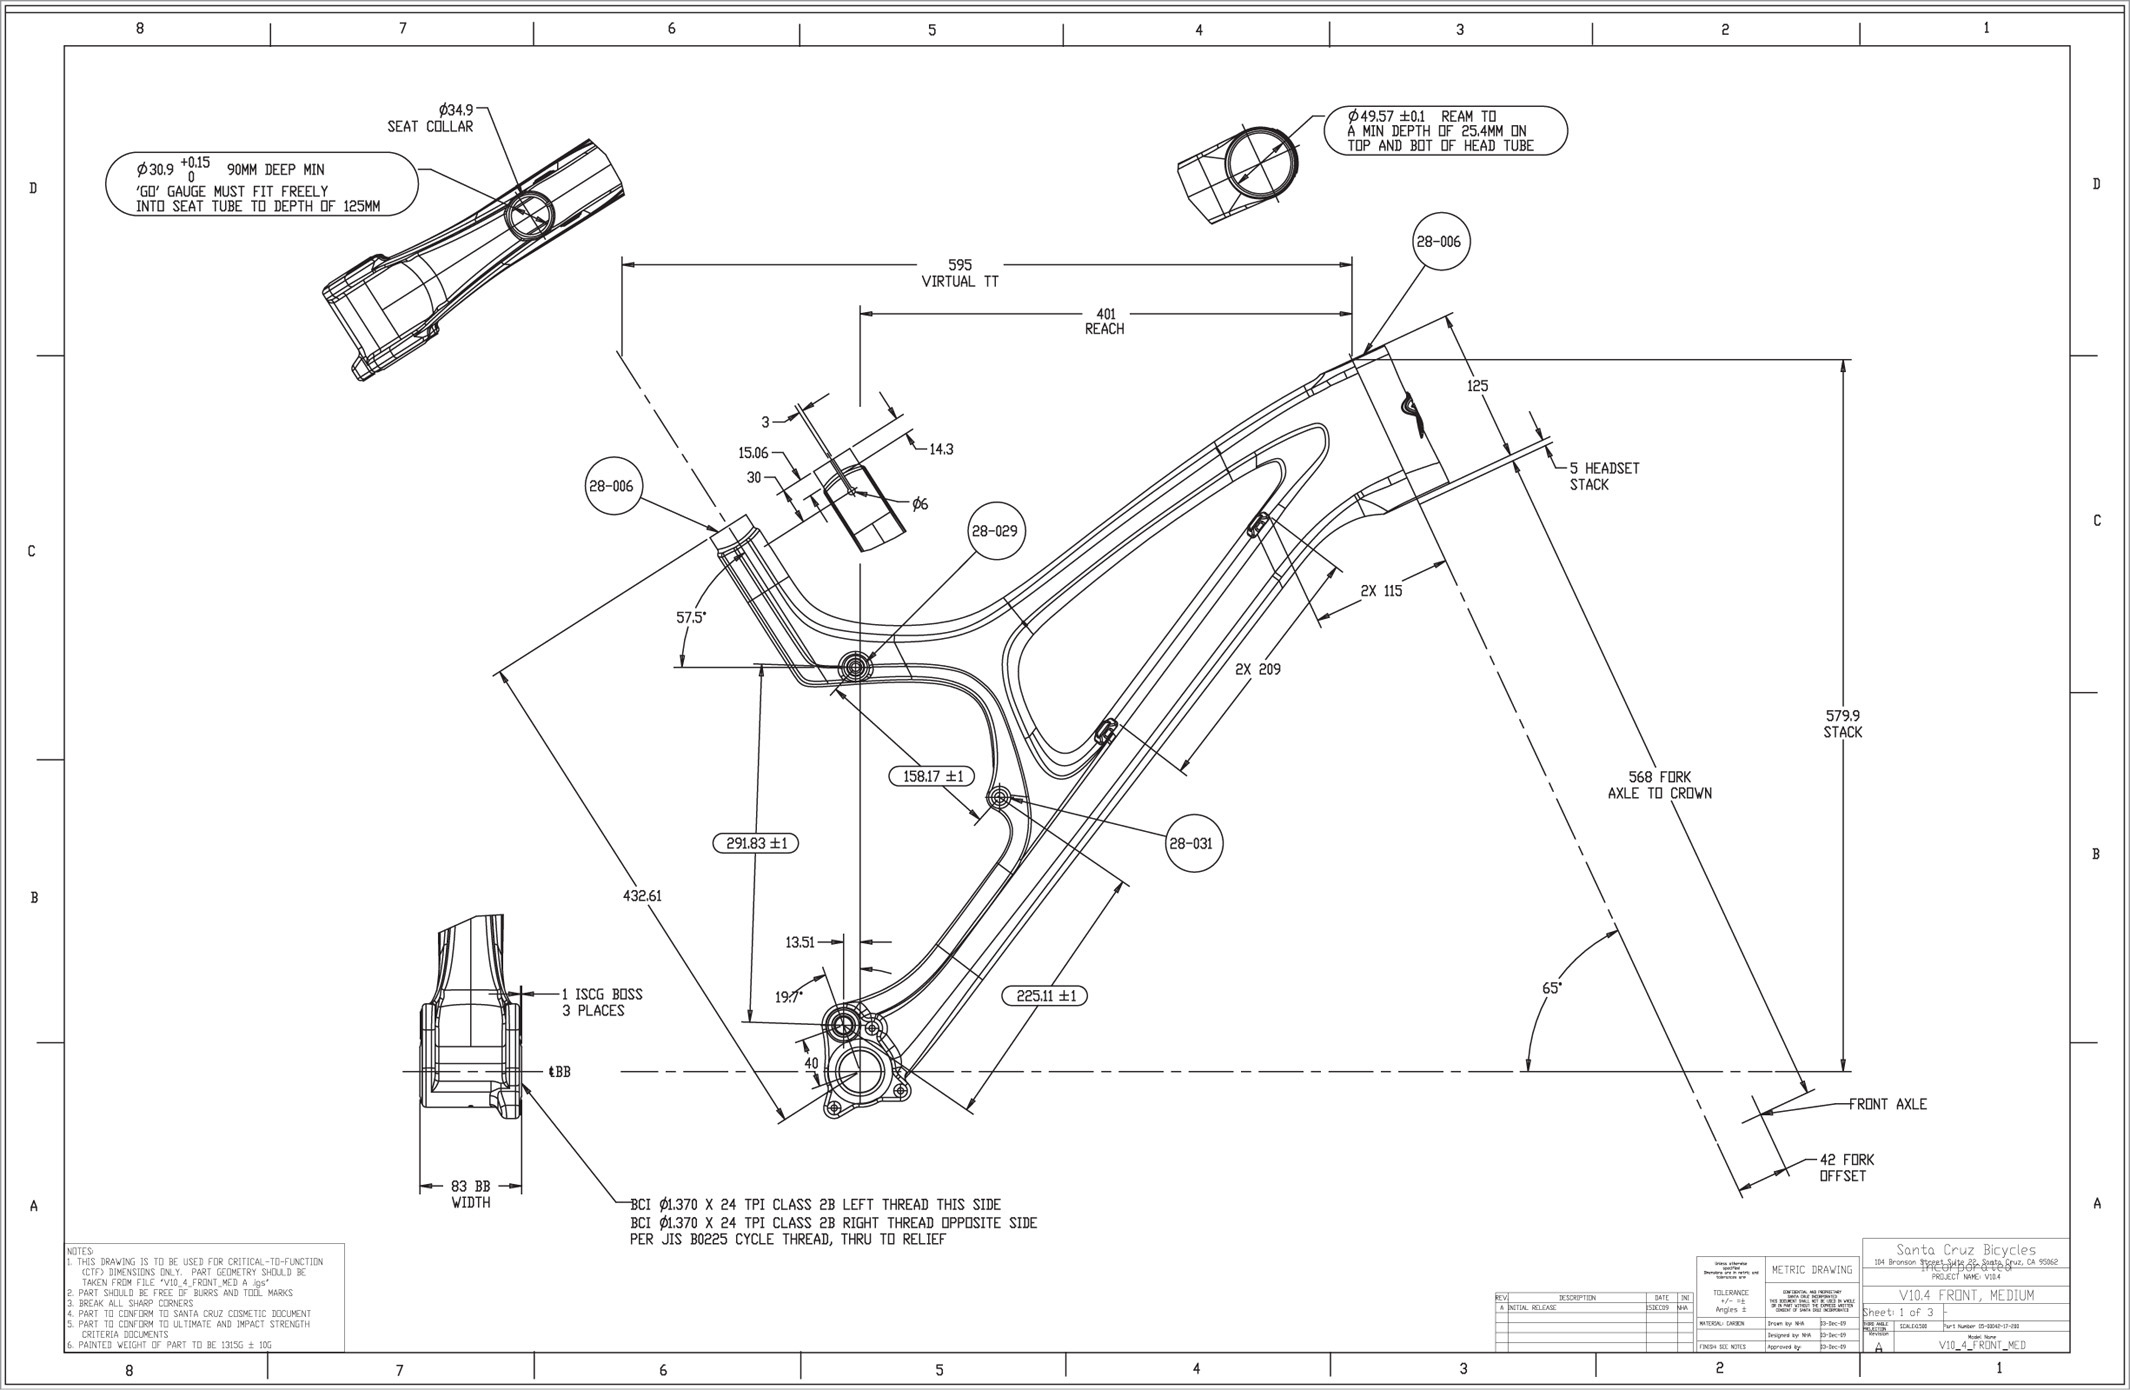
1.21 This drawing generated from the solid model includes notes that call attention to the fit with other parts that the V10’s frame must achieve. (Courtesy of Santa Cruz Bicycles.)
At Santa Cruz Bicycles, the 3D model is archived at each stage of the process. The model is sufficiently documented so that no 2D drawings are needed. Occasionally, a 2D drawing generated from the model is used to call a toolmaker’s attention to a key dimension or tolerance.
Sometimes, after a model is sent to the manufacturer, dimensioned drawings are prepared to document the final product as manufactured and assembled. Measurements are taken from the actual parts, and the solid model is modified to match them, then dimensioned drawings from the final model are stored in the archive. (This is the reverse of the traditional model, in which the documentation drawings are prepared first to transmit the design to manufacturing.)
The 3D design database (solid model) may be archived as the permanent record. Fully dimensioned engineering drawings also may be used to provide a permanent record of the design at some point. Companies that use the model for documentation have well-defined procedures for archiving the final model. Because files stored in electronic format can be altered so that they no longer represent the actual product design, companies must control access to the information in the solid model—or capture it in another medium—to create a permanent record. Once a model has been archived, only authorized personnel may make changes to it.
The solid model can also be used to generate a wide range of graphics used to document a product or process. Views of the model are imported into step-by-step illustrated guides for assembly line personnel (Figure 1.22), and the same guides are sent to service personnel who need to disassemble and reassemble the products after sale.
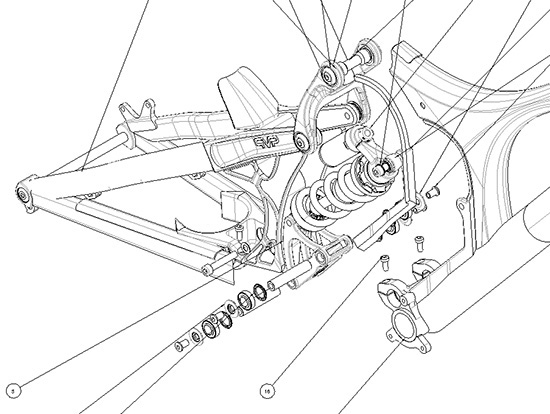
1.22 Exploded views such as this one can be used to illustrate assembly or service manuals for the V10. (Courtesy of Santa Cruz Bicycles.)
1.2 Rapid Prototyping
While refining design ideas the design team often works concurrently with manufacturing to determine the best ways to make and assemble the necessary parts. After several cycles of refining, analyzing, and synthesizing the best ideas, rapid prototyping systems allow designers to generate parts quickly, directly from 3D models, for mockup and testing. For example, they can check usability for humans or explore customer reactions in consumer focus groups by showing them facsimile products created using rapid prototyping. 3D design data can be formatted for use by rapid prototyping equipment. Figure 1.23 shows the prototyped part emerging from the unfused material of the ZPrinter 450 rapid prototyper, which can “print” a color part like the one shown in about four hours. You will learn more about rapid prototyping in Chapter 10.
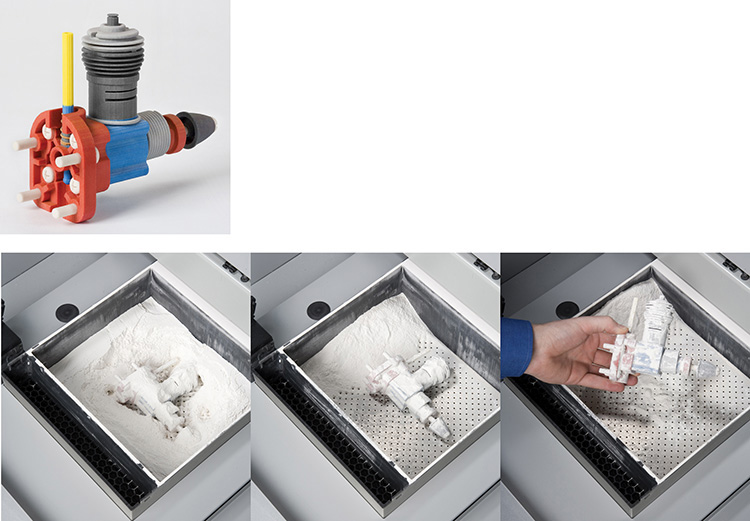
1.23 Rapid Prototyping. The ZPrinter 450 “printed” the colored part shown in about four hours. (Courtesy of 3D Systems.)
1.3 Drafting Standards
There are standards that support a uniform, effective graphic language for use in industry, manufacturing, engineering, and science. Technical drawing texts like this book can help you learn them. In the United States, providing these standards has been the work of the American National Standards Institute (ANSI) with the American Society for Engineering Education (ASEE), the Society of Automotive Engineers (SAE), and the American Society of Mechanical Engineers (ASME).
Participants in these organizations help develop the American National Standard Drafting Manual—Y14, which is composed of a number of separate sections that are published as approved standards as they are completed (see Appendix 1). These standards are frequently updated to communicate information so that it meets the needs of modern industry and engineering practice. They are considered the most authoritative guide to uniform drafting practices in the United States today.
International standards, often defined by the International Organization for Standardization (ISO), and the ASME or ANSI standards for drawing practices are similar in many respects. The greatest differences are in the preferred method of projection: firstangle versus third-angle projection, and in the units of measurement in dimensioning. Third-angle projection is the projection method that you will be learning in this text. Where practical, information for both U.S. and international drawings will be presented.
1.4 Creativity Techniques
Some people are naturally gifted at design and drawing, but all persons can improve their design ability if they learn to use the proper tools and techniques. It is similar to learning to play a musical instrument; it comes more naturally to some people than to others, but all can learn to play if they practice.
How do you develop new ideas? Here are some proven techniques you can practice.
Examine Manufactured Products
It is common for design engineers to dismantle manufactured products, evaluate them, and study how their parts are designed to work together. As you use and examine manufactured products, ask yourself, How could they be improved? What would you do differently? How could you expand/change the design to guarantee better performance? What could you do to expand the life of the product? How could you make it more efficient, more costeffective, and so forth?
Reverse engineering is a term that refers to designing products based on existing designs, usually through measurement and deconstruction of an existing product. A coordinate measuring machine (CMM) aids in speeding the time to reverse engineer some products. A CMM measures the object using a probe or laser and stores the pertinent geometric information into a database where it can be manipulated using CAD.
Functional decomposition is a term for determining the subfunctions involved in a design and then using those functions to reconstruct a similar product.
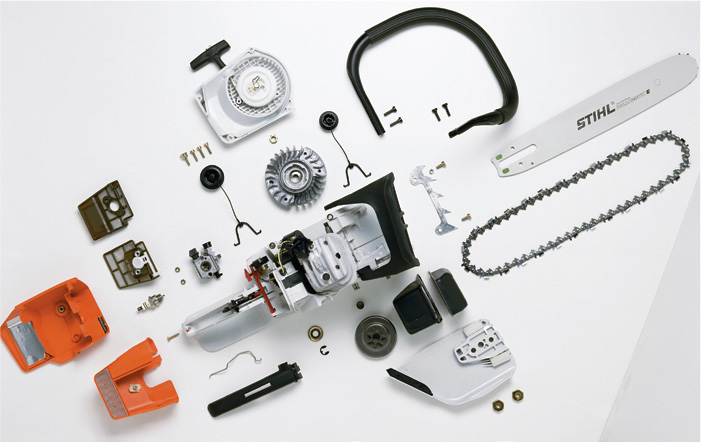
A Chain Saw Disassembled. (Dave King © Dorling Kindersley, Courtesy of Andreas Stihl, Ltd.)
Study the Natural World
Noting how other creatures and organisms function and interact with their surroundings can provide a wealth of information and creativity. Such things as beehives and spiderwebs are masterpieces of structural design that have inspired human designers for centuries. A hummingbird’s wings are aerodynamic wonders. There is much to be learned by studying natural forms and expanding on their designs, as Leonardo da Vinci did with his flying machine (Figure 1.24).
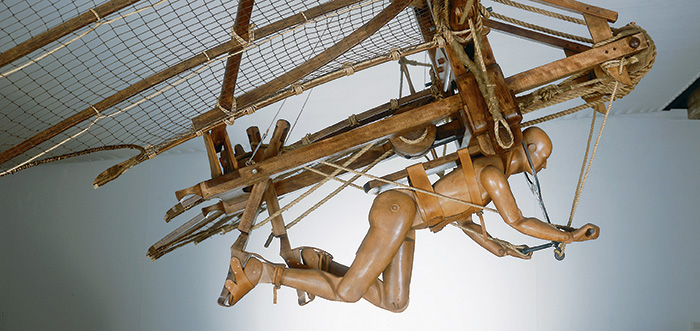
1.24 Full-Scale Wooden Replica of the Ornithopter, a Flapping-Winged Flying Machine Conceived by Leonardo da Vinci (Courtesy of Peter Chadwick © Dorling Kindersley.)
Watch the Web
Excellent resources for engineering and design are available on the World Wide Web. Reading technology blogs and news feeds and visiting engineering sites is a way to stay current and keep in touch with peers. The following websites are useful for engineering design:
• www.uspto.gov (U.S. Patent Office online search site)
Research Patent Drawings
Patents can be a great source of ideas. A patent is issued by the U.S. government and grants the holder the “right to exclude others from making, using, or selling” a specific product for a specific time period. The patent process was first developed as a way to promote the disclosure of technical advances. You can research the current state of design for your product idea at the U.S. Patent and Trademark Office’s searchable website (www.uspto.gov). The U.S. Patent and Trademark Office has strict regulations as to how designs are presented in patent drawings so the drawings are easy to reproduce (Figure 1.25).

Design Groups
To bring complex products and systems to market, most individuals end up working in a team environment. Teams combine the expertise of individuals familiar with materials, production processes, marketing, finance, and so on, so most projects become a team effort long before a product is produced and marketed. In addition to supplying the varied expertise that it takes to bring an idea from concept to manufacture, interaction between people of varied talents plays an important role in the creative design process. The ability to create and understand technical drawings helps group members contribute to and benefit from team communication.
1.5 Product Definition
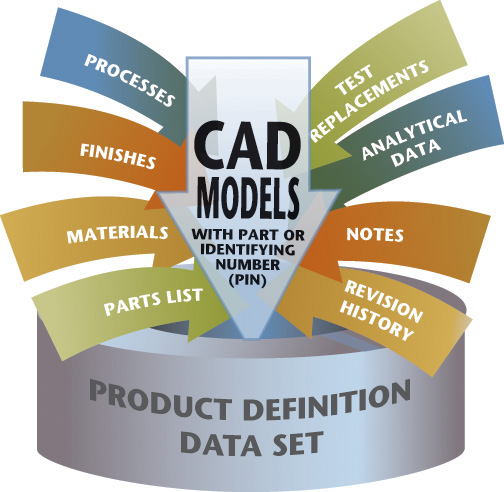
As stated before, technical graphics play three important roles: visualization, communication, and documentation. Drawings and CAD models are an important part of product definition. Product definition refers to the collection of digital or hard copy documents that specify the physical and functional requirements for a product. These can range from a 3D CAD model that specifies manufacturing requirements within the CAD file to a dimensioned paper sketch.
Many companies prefer storing information in a digital format because the storage cost is comparatively low and the data can be easily searched, retrieved, and utilized by many individuals. Figure 1.26 represents the range of contents in a product definition data set. A thorough understanding of the graphic language, from hand sketches to complex 3D models, is necessary to be a player in the competitive world marketplace.
1.6 Showing the Design Process in a Portfolio
A portfolio is a representative sample of work that helps communicate your skills and talents, usually to a prospective employer or client. Many companies and individuals post portfolios on the Web to promote their capabilities and accomplishments. Larger companies tend to show more models and completed projects because working drawings may be proprietary information. Individuals, particularly recent students, may focus more on showing correct drawing practices and creative problem-solving skills.
Whether you are a consulting engineer, an architect, an industrial designer, or a draftsman, showing samples of your work offers an advantage over just talking about it. Drawings are proof that you not only have good ideas but also have the skill to communicate clearly and accurately throughout the stages of a project, from concept to completion.
If you are seeking an entry-level job, don’t worry if your portfolio looks like an entry-level portfolio. Clean, correct student work is a good indication of your potential. Don’t try to cover a lack of well-drawn examples with a more expensive portfolio case, or decorative presentation. Instead, spend that energy completing a project that shows your ability.
A portfolio is an opportunity to tell concise success stories. For example, you may want to show four to six projects, including the design brief (or assigned problem), sketches, development drawings, and final presentation (including working drawings, renderings and physical or 3D models) for each. Your portfolio samples make great talking points in an interview, so take advantage of the chance to show how you tackled challenges such as cutting costs, improving function, or solving problems that arose along the way.
Some more tips for creating a successful portfolio are:
1. Less is more. Others will assume that your portfolio is your best work, so a few good examples are better than a million mediocre examples. Four to six projects are usually plenty.
2. Show correct drawing practices. Especially if you are seeking a drafting position, but even if your strength is creativity, be sure that lineweights, dimensioning, notes and other parts of the drawing conform to technical drawing standards.
3. Keep several versions of your current portfolio, including hard copy, digital, and Web presence. Use widely accessible formats (such as PDF or PowerPoint) to make your digital portfolio easy to access. Including your Web address in correspondence allows people to view your work or refer to your samples at their convenience.
4. Never rely entirely on electronic equipment. Even if you have a great digital presentation, bring a portfolio of printed samples. Drawings should be clean and legible. Depending on your discipline, you may want a larger or smaller portfolio case, keeping in mind how convenient it is to transport and view. You may fold large drawings to fit, as long as they are easy to take out and look at.
5. Save good examples as you create them. It is easy to forget what you did last year, or four years ago. Keep copies (both digital and paper) of your best work in a file for portfolio samples and remember to save some development sketches from successful projects, too.
6. Depending on your career goals, let your portfolio reflect the area you want to explore. If you are seeking a creative position and you have related skills (such as artistic drawing or photography) you may want to include appropriate examples. If you are mainly interested in a drafting position, you may want to include more working drawings and models.
Throughout this book, the Portfolio sections give you some exposure to real-world drawings that apply to chapter topics. However, the Portfolio section in this chapter shows how an industrial design student successfully communicated the design process through a well-conceived portfolio page.

This single page from the portfolio of John Mountz begins with the design brief and rationale for the design. It includes initial concepts, more refined sketches, a solid model, and details. Mountz showed the final presentation drawing on an additional portfolio page. At the time, he was a student of industrial designer Doug Wintin, then Chair of the School of Design at ITT Technical Institute. (Courtesy of John Mountz.)
Define, Measure, Analyze, Improve, Control (DMAIC)
Implementation/Documentation Phase
Parametric Modeling
Quality Function Deployment (QFD)
Chapter Summary
• The graphic language is the universal language used to design, develop, and construct products and systems throughout the world.
• The design process combines ideas, scientific principles, resources, and existing products into a solution for a problem. It consists of five specific stages.
• Every technical drawing is based on standards that prescribe what each symbol, line, and arc means.
• The members of a engineering design project team must be able to communicate among themselves and with the rest of the project team to contribute to the team’s success.
• The basic principles for communicating information using technical drawings are the same whether drawings are created by hand or using CAD.
• Successful companies hire skilled people who can add value to their team. A thorough understanding of the graphic language is an essential skill that employers value.
Review Questions
1. When is sketching used as graphic communication?
2. Why are standards so important for members of the engineering design team?
3. What is the design process?
4. What are the five phases of the design process?
5. Describe the difference between concurrent and traditional design process models.
6. What does PDM or EDM stand for? What are some advantages of PDM?
7. When are rapid prototypes useful?
8. List three ways a CAD database can be used.
9. List five techniques you can use to enhance creativity.
Chapter Exercises
If necessary, refer to the appropriate section of the chapter to check your answers.
Exercise 1.1 Define the following terms as they apply to the design process: needs statement, concept, compromise solutions, prototype, layout sketch.
Exercise 1.2 Sketch a flowchart that depicts the design process as you understand it.
Exercise 1.3 The hypothetical “Flies R Us” fishing tackle company has contracted your services to restructure their design process and increase profitability. Read the job descriptions accompanying the “Flies R Us” design flowchart and decide at what stages of the design process each team member should be involved. Sketch out a flowchart that illustrates the new reporting relationships for these individuals or groups.
Exercise 1.4 Using the “Flies R Us” flowchart as a guide, answer the following:
• What sort of information does Randy Edwards need before he can source raw goods for the manufacture of a new product?
• At what point should Todd Benson be involved in the design process, and why?
• What might happen if Samir Raol was out of the communication loop?
• Would Annette Stone be likely to see a prototype?
• Which team members do you think Monte VanDyke has on the speed-dial function of his office phone?

Reverse Engineering Projects
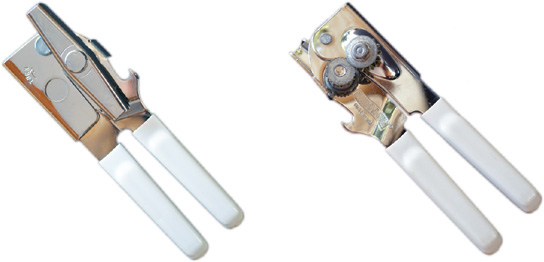
Can Opener Project
In this ongoing project, you will reverse engineer an Amco Swing-A-Way 407WH Portable Can Opener. It is recommended you purchase a readily available and affordable product similar to this one, so you can make measurements directly when required. This effective and low-cost can opener seems simple in its familiarity, but it is clear when you begin to take one apart that considerable effort went into designing a product that is inexpensive, reliable, and easy to operate for most people.
Product Features
• Portable
• Lightweight
• Manually operated
• Comfortable to hold
• Durable construction
• Has a bottle opener
• Colored handles available
• Low maintenance
• Five-year warranty
Exercises for Chapter 1
RE 1.1 This is far from the only can opener on the market. Use the Web to research manual can opener designs. Find at least three can opener models that are different from the Amco Swing-A-Way. Make a list of the features of each of the three.
RE 1.2 Create a diagram for the can opener. How many distinct parts are used in its manufacture? Which parts can be grouped together and preassembled as a unit?
Exercises for Chapter 2
RE 2.1 Make a table listing the dimensions of the can opener parts. Do not worry about measurements for now. Give names to the dimensions, such as lower handle length, lower handle height, and hole diameter.
RE 2.2 Which dimensions in the list you created are critical to the function of the can opener? Identify in your list the dimensions that must match dimensions on other parts for the can opener to function. Which dimensions will not be very important to the can opener’s function?
RE 2.3 To accurately reverse engineer the can opener, you will need to make measurements for the part features. Metrology is the science of making measurements. The digital caliper is one commonly used measurement tool. The accuracy of a measurement is dependent on several factors, including the following:
• the skill of the operator
• the temperature at which the measurements are taken
• how stationary the part is while being measured
• the accuracy of the measurement device
Measure the critical dimensions of the lower handle part. Make each measurement five times. Calculate the mean and standard deviation for each set of measurements. Determine what value you will use when modeling that dimension. Label the values on the sketch you drew for the lower handle.
RE 2.4 What factors influence the accuracy of the value you chose for the dimension?
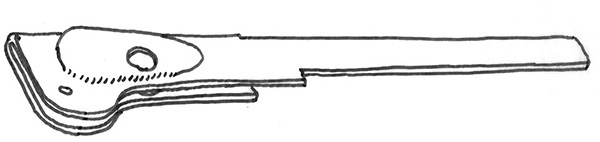
RE 3.2 Sketch a pictorial drawing of the can opener part assigned by your instructor, such as the one shown here for the upper handle.
Exercises for Chapter 4
RE 4.1 Sketch and model a 3D wireframe drawing showing the main centerlines of the can opener parts. Use your 3D modeling software to create a single 3D sketch that shows the centerlines of each main part of the can opener, similar to that shown. Draw the 3D sketch lines only. You will model the can opener parts later.
Draw the 3D sketch lines only.
You will model the can opener parts later.
Exercises for Chapter 5
Begin modeling the can opener’s parts, with emphasis on the dimensional and geometric constraints that are appropriate.
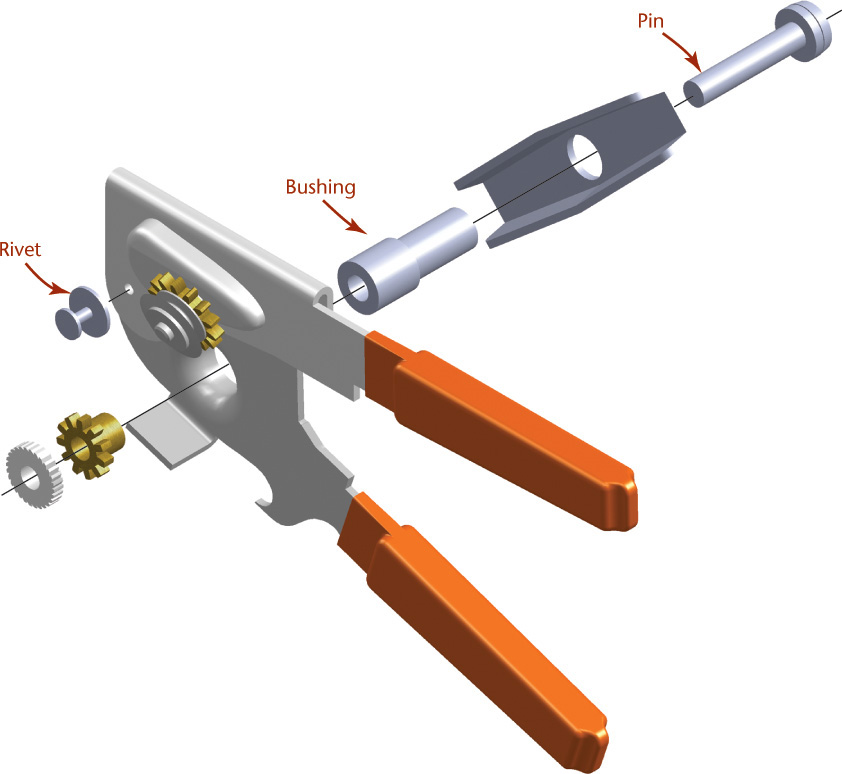
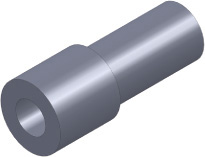
RE 5.1 Model the pin, rivet, and bushing for the can opener using your 3D modeling software.
RE 5.2 Create constraint-based part models of the top handle, bottom handle, cutter, knob, and gears (see next page). Consider part fit, and make your model so that the major dimensions can flexibly change. Review the dimension names you assigned for the lower handle, and revise them if needed. Assign dimension names to these parts wherever it makes sense for the can opener assembly.

Exercises for Chapter 6
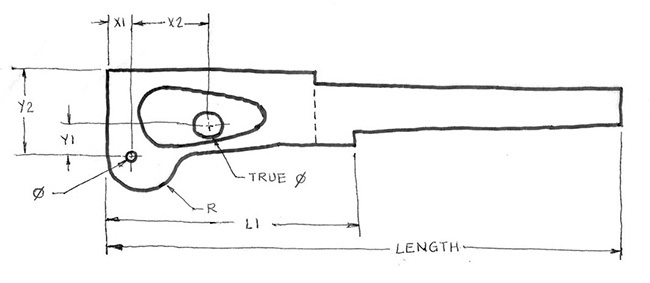
RE 6.1 Create an orthographic view sketch of the lower handle for the can opener similar to that shown here for the upper handle.
RE 6.2 Name the dimensions. Add dimensions to your orthographic sketch of the handle.
Exercises for Chapter 7
RE 7.1 Create a multiview part drawing for the upper handle. The upper handle is a sheet metal part that is bent to form its shape. Consider this manufacturing process as you create the dimensioned drawing. An example drawing is shown below with dimensions added. Complete Chapter 11 before adding the dimensions to your drawing.

Exercises for Chapter 8
RE 8.1 Create an orthographic drawing for the bushing part. Show the front view in section.
Exercises for Chapter 10
RE 10.1 Using the parts you created to create an assembly of the can opener.
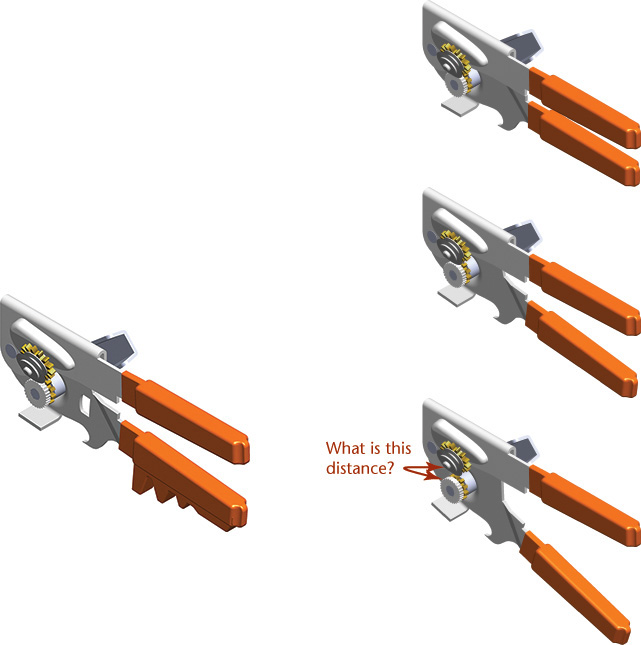
RE 10.2 Use the capabilities of your software to animate the motion of the can opener. What is the minimum distance between the cutting wheel and the lower gear?
RE 10.3 Assign appropriate materials to each of the parts and determine the weight of the can opener from your assembly model. Weigh the actual can opener and compare the two. Are they close?
RE 10.4 Next, determine the center of gravity (COG) for the can opener assembly. Do you think the can opener will feel balanced when you are operating it based on the location of its center of gravity?
RE 10.5 Change the handle parts to make a new pistol-grip design. Analyze the part again to determine the mass properties and COG.
RE 10.6 Experiment with different options by making changes to your can opener parts and updating the assembly. List two options for changing the design if you are required to reduce the overall weight by 20%.
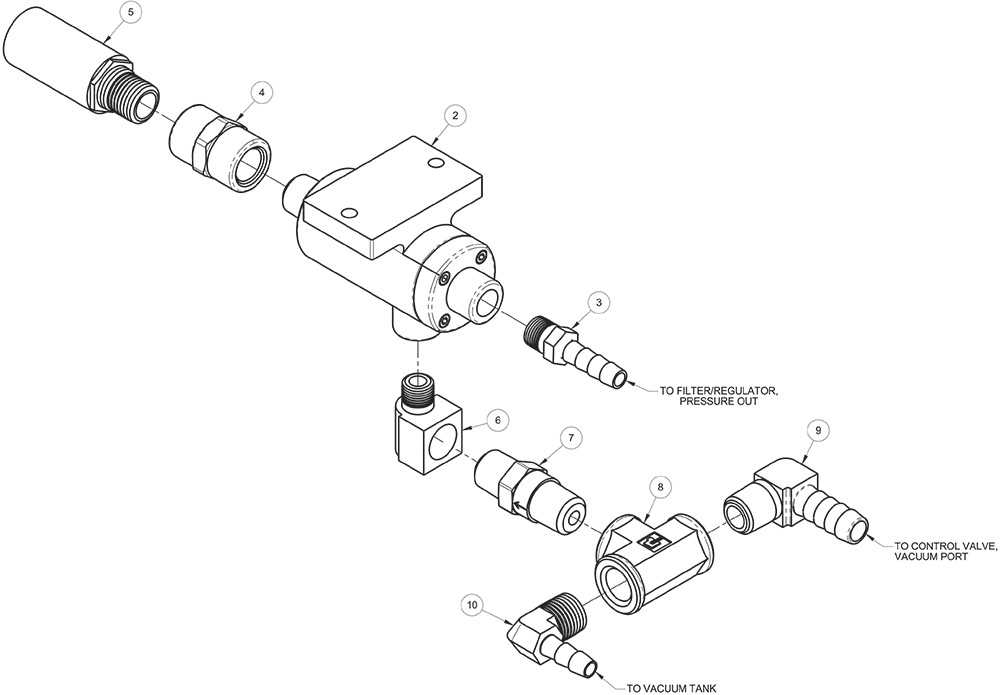
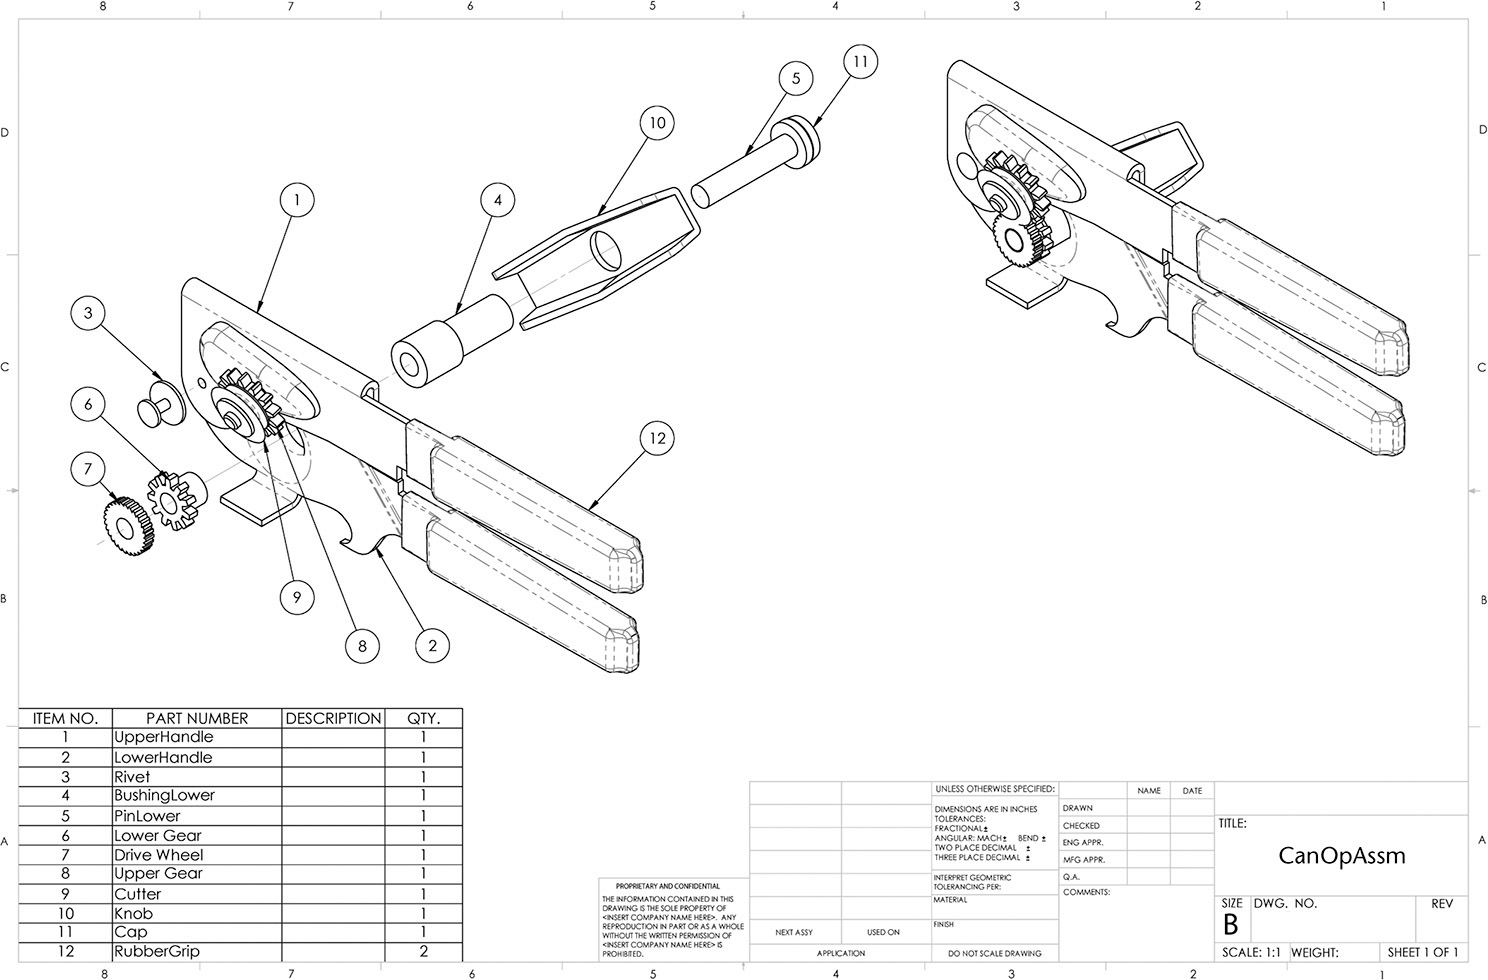
RE 10.7 Create an assembly drawing for your can opener, similar to the one shown. Use an exploded view and a fully assembled view. Add balloon numbers and a parts list.
Exercises for Chapter 11
RE 11.1 Add dimensions to the multiview orthographic part drawings you created earlier.
Exercises for Chapter 12
RE 12.1 Assign tolerances to the part model of the lower handle of your can opener. Then, add tolerances to your drawing of the lower handle part. Your drawing should look similar to the example below.
RE 12.2 What parts of the can opener have fits that are critical to the can opener function? This can opener sells for around $5.00. Consider and describe some of the effects on the price of the can opener if highly-precise fits are required.

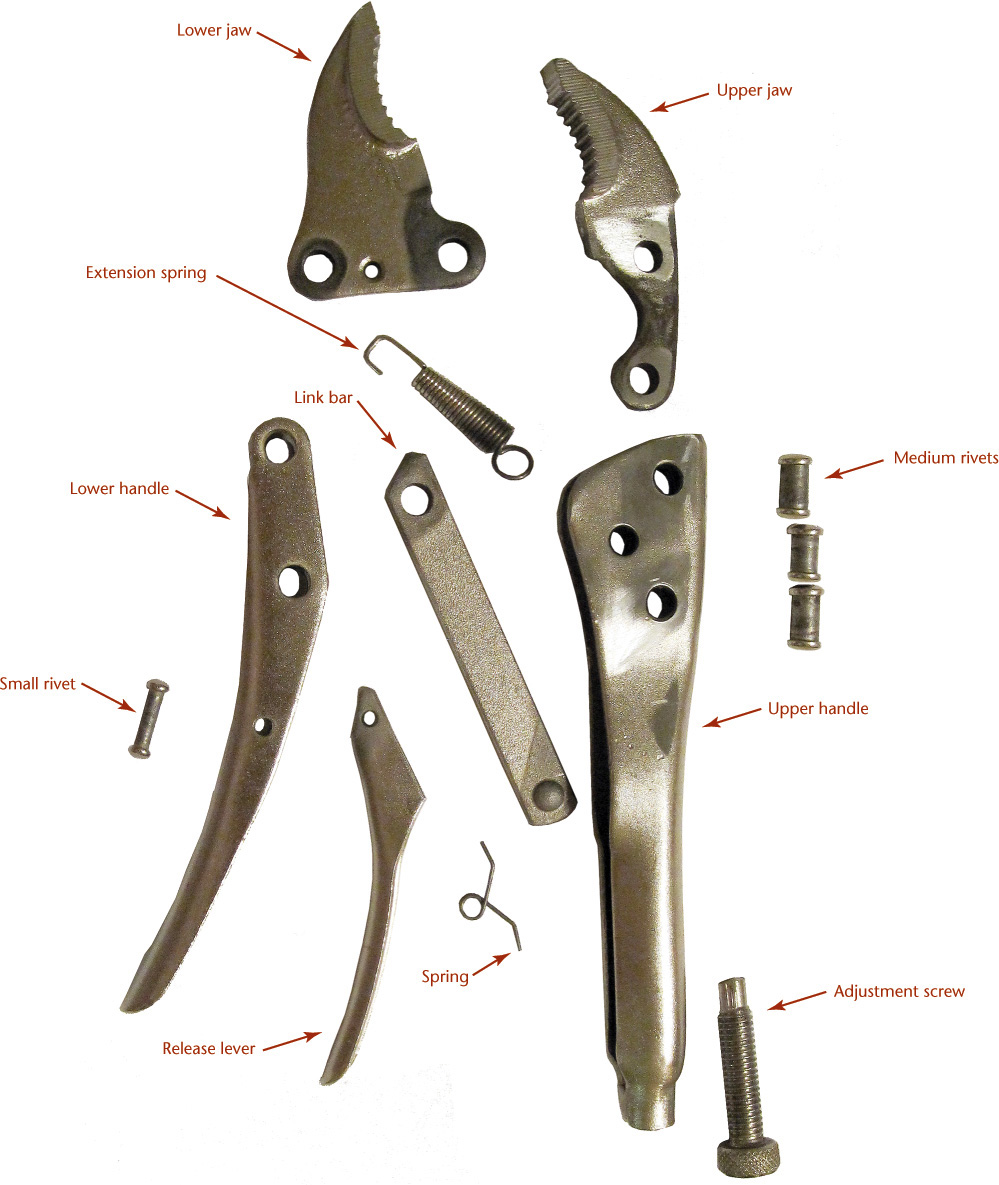
Locking Pliers Project
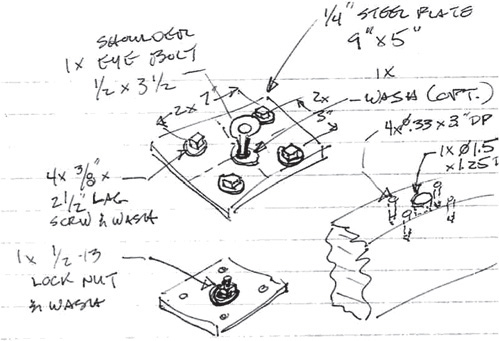
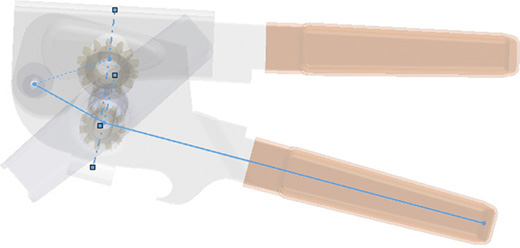
RE Locking Pliers 1. Use stages similar to those for the can opener to create sketches, models, and drawings for the locking pliers shown below.
RE Locking Pliers 2. Create solid models for the locking pliers parts (shown on the next page). Use dial calipers, a micrometer, or machinist scales to make measurements from your pliers. Consider the mating features and alignment that make the locking plier mechanism function. If assigned, make an assembly skeleton as represented below and assemble your completed parts onto it.
RE Locking Pliers 3. Ensure your parts will fit and function in the assembly. Perform a fit study on the completed assembly to identify any interference issues in your model.
RE Locking Pliers 4. Make part drawings as assigned by your instructor.