
13
Biometric Systems Applied To Mobile Communications
13.1 Introduction
Many modern electronic services and systems require a reliable knowledge of the identity of the current user, as an integral part of their security protection [1]. Examples include secure access to automated banking services, access to media services, access to confidential or classified information in the workplace, and security of information within handheld devices. The results of a breach of security can be costly both to the customer and the providers of services or systems. For wireless devices to take on significant roles in these security-conscious applications, the devices must provide the mechanisms needed for reliable user identification. Among the applications of reliable user identification, wireless or handheld devices present a unique challenge due to limited size, power and memory constraints. Furthermore, the nature of the challenge grows when we consider the scope of mobile device penetration into the worldwide marketplace, where the user identification system must function reliably for a huge number of people with a wide range of user demographics and in widely diverse operational environments.
At its core, security in information and communication systems encompasses those processes that: (1) determine what commands the current user may issue to the system and (2) guarantee the integrity of both the commands and the subsequent system responses as they propagate through the system.
Reliable user identity recognition is the necessary first step in determining what commands can be issued to the system by the current user. It involves collecting enough personal data about the current user to confidently link him to a specific set of system permissions and privileges. In current systems, that linkage is often made in the form of a unique user ID (e.g. name, username, account number, social security number, etc.).
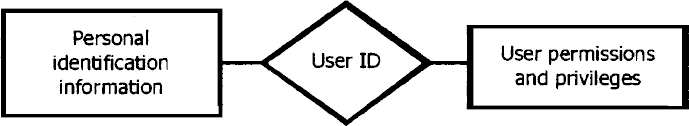
Figure 13.1 Data related to the user ID
Figure 13.1 illustrates this relationship from an information structure viewpoint. Identity recognition deals with the left half of the relationship illustrated in Figure 13.1. As human beings, we typically identify a person using three classes of personal identification information:
- Something he/she has – a badge, ID card, letter of introduction, etc.
- Something he/she knows – a password, code word, mother's maiden name, etc.
- Physical characteristics – height, weight, eye color, voice, face, fingerprint, etc. These are sometimes called biometrics.
The identity recognition process collects these types of data about the current user and compares them to data about users that have been previously collected and stored. The process generally takes one of two forms: (1) Verification, where the user enters a specific user ID and the system simply corroborates or denies the claimed identity by comparing the live data to that stored for the specific claimed identity, and (2) identification, where the system collects live data and searches its entire stored collection of data for all users to find the identity of the current user. Verification is a simpler process computationally than identification and is preferred when the operational requirements permit. Identification is used where user convenience is paramount, or when the user cannot be trusted to enter the correct user ID. Both of these forms are discussed in this chapter.
A variety of different means exist to provide the information needed to establish and confirm the person's identity. Each method has its own strengths and weaknesses. A much used method involves assigning each user a unique account number, which provides the claimed identity, and either assigning or allowing a user to specify a Personal Identification Number (PIN) which provides the confirmation of the identity. The drawback of using a PIN is that once knowledge of the PIN is compromised, it becomes an immediate and ongoing breach of security. Further, each separate account a user accesses requires memorizing a separate PIN, resulting in a proliferation of PINs. Those who use many different automated services will find it difficult to remember several different PINs. Systems based on biometric data can avoid the use of passwords and PINs entirely. Automated systems that can avoid passwords and PINS will be more secure and easier to use.
In this chapter we describe in detail two popular biometric user verification/identification technologies, speaker verification and fingerprint verification/identification. These techniques were chosen because of their feasibility and their suitability for the mobile handset environment. Other technologies, such as signature analysis and retinal scan may be inconvenient for a small handheld device and are hence not discussed. In general, the type of biometric measure used will depend on the level of security needed and ability to sample the characteristics.
13.2 The Speaker Verification Task
To solve the above-mentioned problems, ideally one desires a system that verifies a person's identity based upon unique characteristics that each individual possesses. The use of a person's voice for verification provides an attractive biometric measure. Talking is perceived as a natural means of communicating information. The only equipment needed in proximity to the person is a microphone to provide the voice information. This equipment is inexpensive and, for many wireless and personal devices, the microphone and A/D front end are already in place.
The weaknesses of using speech to verify a person's identity include the ability of an impostor to make repeated attempts to gain access, or recording of the user's voice. However, recording of a user's voice can be remedied by prompting the user to say different phrases each time a system performs verification. Even then, we observe that some people “sound alike” and so it is possible at times for voice verification to fail. It is extremely important to design the voice verification system to address the unique challenges and maximize performance.
There are two major challenges in the use of voice verification, both dealing with the random nature of the audio signal. The first challenge is the variation of the speech signal. A speaker's voice obviously varies based upon the words spoken. The way a speaker says a word also varies. The rate of speech for each word is subject to systematic change (for example, the speaker may be in a hurry). The acoustics of speech for each word also vary naturally, due to context, health of the speaker, or emotional state. Additionally, acoustics are systematically changed by the characteristics of the transducer and channel used during collection of the speech. This is especially true in the case of equipment in which the transducer may change between verification attempts. The second challenge is contamination of the speech signal by additive background noise. Since the environment in which the voice verification system will be used is not known beforehand, algorithms must be able to cope with the corruption of the speech signal by unknown noise sources.
In addition to the technical challenges provided by the signal, there are practical design issues that must be addressed. Embedded applications must be concerned with the amount of speaker verification measurement data that must be collected and stored for each user. As the amount of user-specific data stored increases, the verification performance increases. Further, if the embedded application is to be accessed by multiple users, the amount of speaker-specific data that must be stored to represent all speakers will obviously increase. Since the amount of data stored must be kept to a minimum, there will of necessity be a trade-off between performance and resource requirements. This will impact on the selection of the type of verification methodology used. Therefore, the efficiency of the speaker verification measures is important. An identity verification system needs a compact representation of the user-specific voice information for efficient storage and rapid retrieval.
13.2.1 Speaker Verification Processing Overview
The processing of speaker verification involves two steps. These are illustrated in Figure 13.2.
The first step, enrollment, is shown in the upper part of the figure. It consists of gathering speech from a known speaker and using the speech to extract characteristics that are unique to the speaker. These characteristics are stored by the system along with the speaker's identity for later use during verification. The technical challenge presented during enrollment is to find features of speech that are applicable to the voice verification task, minimize the amount of storage necessary for each speaker, and provide robust performance in the intended environment.
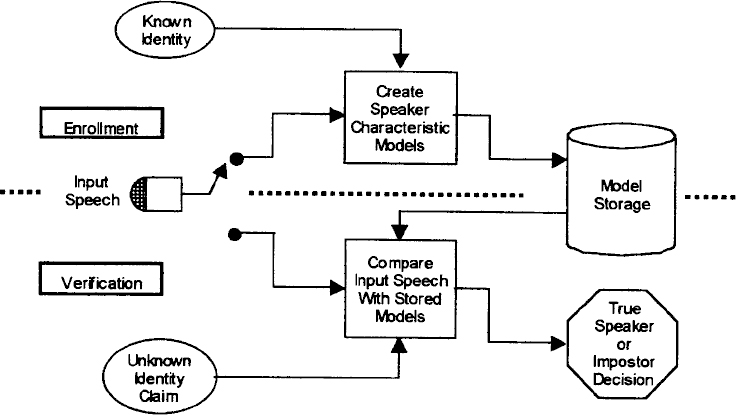
Figure 13.2 Speaker verification block diagram
The second step is the actual verification process. In this step, shown at the bottom of the figure, the system first requests that the speaker claim an identity. This may be performed by many different means, including entering the ID by keypad, or by voice. The system then confirms that it has stored speech characteristics corresponding to the claimed identity. If stored information is available, the system prompts the speaker to say a verification utterance, and then uses the speech to decide if the identity of the speaker is the same as the claimed identity. The challenge presented by verification is to define a metric to be used in a pattern matching process that provides an accurate measure of the likelihood that the verification utterance came from the claimed identity.
13.2.1.1 Types of Voice Verification Processing
There are basically two types of voice verification processing, text-independent and text-dependent voice verification. Text-independent voice verification attempts to verify the claimed identity of speakers from a sample of their voice in which they are free to say whatever they desire. Text-dependent verification, on the other hand, requires that each speaker say a known utterance, often from a restricted vocabulary. Text-dependent verification may also include verification in which the system prompts the speaker to say a specific word or phrase.
Text-dependent verification provides valuable a priori information of the expected acoustic signal that may be exploited to optimize performance. The most important benefit (also an added requirement) of a text-dependent verification system is that one may model the utterance statistically both in terms of acoustic sounds and temporal course. The system can specify the acoustic characteristics of the utterance used for verification, thereby ensuring proper acoustic coverage of the signal to ensure the desired level of performance. In addition, text-dependent verification may be used to provide some increased security by constraining the speech to an utterance known only by the true speaker.
Text-independent verification is easier for the speaker to use, since there is no need to memorize an utterance or repeat a prompted phrase. It also can be easier to and more efficient to implement, since it is not required to keep track of the exact temporal course of the input utterance. However, it will normally be necessary to collect longer durations of speech in order to obtain the level of verification performance desired.
13.2.1.2 Measurement of Speaker Verification Performance
One of the most difficult tasks in the design of a speaker verification system is estimating performance that translates well to the intended application. Typically this is done in the laboratory using data from a speech database representing speech from a large number of speakers. The verification system enrolls models of speech specific to each speaker. Then the verification system implements a scoring procedure resulting in a set of “true speaker” likelihood measures (likelihoods in which the models used for verification and test speech come from the same speaker) and “impostor” likelihoods (likelihoods in which the models used for verification and test speech come from different speakers). Verification performance is measured by how well the method separates the sets of “true speaker” likelihoods and “impostor” likelihoods.
Verification performance may be reported in several ways [3]. A commonly used method constructs a plot of two curves. One curve, called the Type I error curve, indicates the percentage of “true speaker” likelihoods above a threshold. The second curve, called the Type II error curve, is a plot of the percentage of “impostor” likelihoods below the threshold. An example is shown in Figure 13.3A.
Often performance is quoted as a number called the Equal Error Probability Rate (EER) which is the percentage at the point where the Type I and Type II curves intersect, indicated by the dot in Figure 13.3A. A verification system operating at this point will reject the same percentage of “true speakers” as “impostors” that it accepts. Another method of reporting performance is to plot percentages of Type I performance versus Type II performance on a log-log plot [2]. This results in an operating characteristic curve as shown in Figure 13.3B. This type of curve indicates that a verification system may operate over a variety of conditions, depending on the relative costs of rejecting a true-speaker verification attempt or accepting an impostor verification attempt.
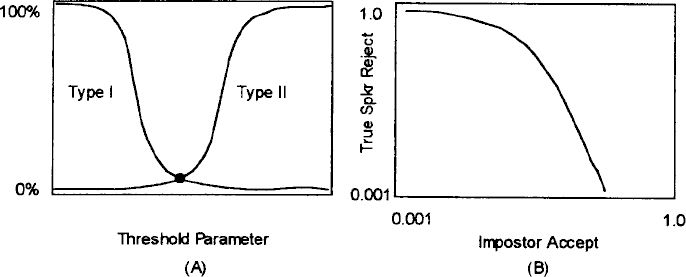
Figure 13.3 (A,B) Methods of measuring speaker verification performance
Note that these performance measures reflect the average performance over the entire population. They do not indicate speaker-specific performance, and it is possible that verification system failures may be correlated to specific speakers.
13.2.1.3 Acoustic Features for Speaker Verification
Characteristic models of the speech signal may be derived in many ways. A common and computationally tractable method of modeling speech acoustics breaks the speech signal into short segments (termed “frames”) and assumes that the speech signal is stationary during each frame [4]. Modeling methods then construct a vector of speech parameters that describe the acoustics of the speech signal contained in the frame. Many methods exist to derive vectors of parameters that describe each frame of speech. However, virtually all speech processing systems utilize some form of spectral energy measurement of the data within the frame of the speech signal as a basis for modeling. Operations applied to the spectrum of the frame result in the parameter vector for the frame. The goal of constructing the parameter vector is to capture the salient acoustic features of speech during the frame that may be useful in pattern matching metric measures, while in some way filtering out the characteristics that are unimportant. The justification for a spectral basis of the speech vector representation is found both in the mechanism of auditory reception and the mechanism of speech production [4,5].
Linear Prediction
One commonly used method of describing the spectrum of the frame of speech is linear predictive analysis [6,7]. It can be shown that the vocal tract resonances can approximately be modeled as an all-pole (autoregressive) process, in which the location of the poles describe the short-term stationary position of the vocal tract apparatus. This method is used as a starting point for many speech feature generation algorithms. The linear prediction model is given by

Here G is a gain term, H(z) is the vocal tract transfer function. The linear predictor parameters, ak, are determined by first breaking the speech signal into frames, and then calculating the autocorrelation of each frame for 10–15 lags, then applying an algorithm such as the Durbin recursion. Such calculations are efficiently performed in Digital Signal Processor (DSP) hardware. The resulting linear predictor parameters are usually used as a basis for more complex feature representations, which may use the autoregressive filter to calculate spectral energies in non-linearly spaced bandpass filter segments. Overall frame energy parameters and frame difference values may also be included, resulting in parameter sets of 20–30 elements. Since these components are correlated, there is usually some form of linear transformation of the components which is aimed at whitening the resulting feature vector, and reducing the number of parameters. Such transformations result in final feature vectors having 10–20 elements.
Cepstral Features
Another common representation is based on cepstral features [3,8]. As illustrated in Figure 13.4, this signal processing method is based on a direct measurement of the spectrum of the signal using a Fast Fourier Transform (FFT). This is followed by calculation of energy magnitudes in about 20–30 non-linearly spaced bandpass filter segments, non-linear processing by a logarithmic function, and subsequent linear transformation by the discrete cosine transform to reduce correlation of parameters. Again, energy and difference values of the components are usually added to form the final feature vector, which is typically in the range of 10–30 elements in size.
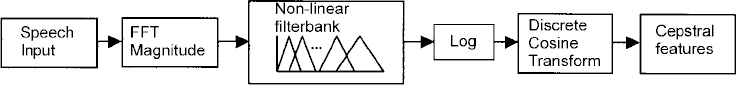
Figure 13.4 Cepstral processing
13.2.1.4 Statistical Models for Measurement of Speech Likelihood
Speaker verification is based on determining the likelihood that the observed speech feature vectors match the parameters for a given speaker. This requires a statistical model of the speech from the speaker. For text-independent speaker verification a typical model is a Gaussian mixture model [9], in which the likelihood of observing a feature vector x from speaker s is given by

In this equation N(.) is a multivariate Gaussian distribution, μs,m is the mean vector for speaker s and Gaussian mixture element m, Vs,m is the covariance matrix or variance vector, and as,m is the mixture weight for the speaker and mixture element. These parameters are estimated during enrollment, and may also be refined during verification if the confidence that the speech came from the true speaker is high enough. During verification the likelihood of all frames of speech are averaged over the duration of the utterance and the result is used to make the decision.
Text-dependent verification is more complicated since the input speech features must be matched to statistical models of the words spoken. A well-known method to do this uses Hidden Markov Models (HMMs) as a statistical model of words or sub-word units [10]. A representative HMM is shown in Figure 13.5. Here the model of speech consists of several states, illustrated by circles. Between the states are transitions, shown by lines, which have associated probabilities. Each state has an associated Gaussian mixture model, which defines the statistical properties of the state of the word or sub-word HMM model for the speaker. The transitions indicate the allowed progression through the model, and the transition probabilities indicate how likely it is that each transition will take place. Each of the parameters of the Gaussian mixture and the transition probability parameters for each state may be estimated during enrollment of the speaker.
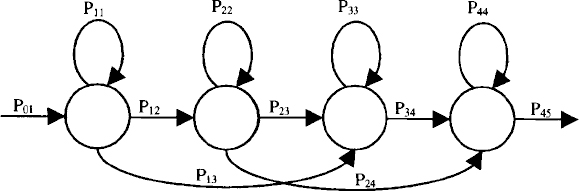
Figure 13.5 A representative HMM
Verification is performed by determining the best likelihood of the input speech data frames spoken by the speaker constrained by allowable paths through the HMMs that define the words spoken. Calculation of the likelihood uses a Viterbi search algorithm [10]. This type of processing is similar to speech recognition processing, except that the utterance is known a priori. Since the utterance is known, the resource requirements needed to implement verification are not nearly as large as those needed for speech recognition.
The likelihood measure p(x|s) may vary significantly with changes in audio hardware or environment. To minimize the impact of these effects on verification performance, some form of likelihood normalization is usually performed [11]. This involves calculating an additional likelihood of the signal x given some confusable set c, where the set c may be chosen as speakers with likelihoods close to speaker s, or as some global set of speakers. The likelihood measure used for making the true speaker or impostor decision is given by
L(s|x) = log(p(x|s)) – log(p(x|c))
13.2.2 DSP-Based Embedded Speaker Verification
Embedded implementations of speaker verification place resource constraints on the verification algorithms.
One of the restrictions is the amount of storage memory available for speaker characteristic parameters. In most verification applications there are usually limited enrollment speech data, which would be inadequate to train a large number of parameters reliably. Therefore, it is possible and necessary to reduce the number of parameters. Storage resources are often conserved by reducing the number of Gaussian mixture components to one or two. With sparse data, the variance parameters of the Gaussian mixture components are sensitive to estimation errors, and so often variance parameters are shared. A trade-off between performance and storage can also be made by reducing the size of the feature vectors representing speech. For text-dependent verification, the number of states in each HMM may be reduced. Per state transition probabilities of the HMMs are often fixed. To reduce storage of transition probabilities further, a systematic structure is often assumed. For the HMM shown in Figure 13.5, if transition probabilities are defined for returning to a state, going to the next sequential state, and skipping a state, then the number of parameters needed to represent transition probabilities for the model is reduced to three. If a text-dependent verification system contains a set of speaker-independent word HMMs that serve as the basis for allowable verification phrases, then the parameters of the speaker-independent HMMs may be used. For example, it may only be necessary to estimate the parameter μs,m while obtaining all other parameters from the speaker-independent HMMs. Other parameters, such as the variance estimates of the Gaussian mixture components may be shared within a model, or even between models. Using these simplifications, typical verification models for text-dependent embedded applications require about 100 parameters per spoken word. However, more complex signal processing algorithms have been developed that retain performance with as low as 20 parameters per spoken word [12].
Table 13.1 Verification resources example

Program memory storage necessary for speaker verification will depend on the particular speaker verification algorithm used. For a typical text-dependent application, the speaker verification code will be a small addition to the speech recognition code. Processing requirements for the front-end feature processing will be similar to the speech recognition code. Text-dependent recognition requires calculation of the maximum likelihood path through the sequence of HMMs making up the spoken phrase. However, unlike speech recognition applications, speaker verification uses the a priori knowledge of the spoken phrase. This implies that processing resources will be less than those reported for speech recognition. As an example, as shown in Table 13.1, except for front-end feature processing, the resources for text-dependent speaker verification using ten digit phrases will be about one-tenth of that reported for digit recognition as reported in Chapter 10.
13.3 Live Fingerprint Recognition Systems
13.3.1 Overview
The ability to implement fingerprint ID systems in mobile devices hinges on the confluence of two technology developments: the recent commercial availability of very small, low power, high quality fingerprint sensors and the introduction of a new generation of fast, powerful DSPs into mobile devices.
In this section we review the engineering elements of designing fingerprint systems into the next generation mobile devices. We briefly characterize the unique aspects of mobile fingerprint systems, develop the concept of operations for mobile fingerprint systems, and then examine the critical performance metrics used to control the system design and ensure its adequacy. The fingerprint system is then decomposed into its basic elements. Each of these is described along with some possible design approaches and implementation alternatives. Lastly, we describe a prototype system architecture based on the Texas Instruments' OMAP architecture, and discuss the design and implementation of a demonstration system constructed using this architecture.
13.3.2 Mobile Application Characterization
13.3.2.1 End-User Benefits
Live fingerprint recognition on mobile devices makes basic security and device personalization convenient for the user. Entering usernames, passwords, or PIN numbers into portable devices is inconvenient enough that most people today don't use the security and personalization functions in their portable devices. With live fingerprint recognition, a single touch of the sensor device is all that is required to determine the user's identity, configure the device for personal use, or authorize access to private resources.
13.3.2.2 Expected Usage Patterns
A portable device typically has a small group of between one and five users. When an authorized user picks up the device and presents his/her finger to the sensor, the device should recognize the user and immediately switch its operation to conform to his/her profile.
13.3.2.3 Unique Aspects of the Application
Mobile devices require fingerprint sensors that are significantly smaller than any previously used. This requirement propagates into two aspects of the fingerprint system design. The first challenge is to build an adequate quality sensor small and light enough for mobile devices. The second challenge comes from the fact that smaller sensors generate images of smaller sections of skin. This means less data is available for comparison than with the larger sensors typically used for fingerprint recognition. To successfully match smaller fingerprint images the sensor must generate higher quality and more consistent images, and the matcher algorithm must be designed to take advantage of the higher quality data.
Alternatively, some systems require the user to slide his finger slowly across the sensor, to increase the area of finger surface imaged. This motion is called swiping. While this approach generates imagery of a larger area of skin, it seriously distorts the skin and has significant operational and performance liabilities.
The prototype application discussed later in this chapter uses an AuthenTec AES-4000 sensor with a sensing area just under 1 cm2. Systems using even smaller sensors are under development at several fingerprint system suppliers.
13.3.3 Concept of Operations
The operational concepts underpinning most fingerprint authentication systems revolve around three classes of user events: enrollments, verifications, and identifications. Each of these event classes is described below from a high-level process view. The procedures underlying these processes are discussed later in this chapter.
13.3.3.1 Enrollment
Enrollment is the process of authorizing a new person to use the mobile device. In a typical scenario, the owner of the device authorizes a person to use the device by: authenticating himself/herself to the device as the owner, creating a new user profile with the desired privileges on the device, and then training the device to recognize the new user's fingerprints. Typically the system is trained to recognize two or three fingers for each person in case injury makes one finger unavailable.
The process of training the fingerprint system to recognize a new finger can be broken down logically into the following steps:
- Collection of system training data samples
- Feature quality analysis
- Template generation
- Template storage
Collection of Training Data Samples
The system collects several views of a finger, prompting the new user to lift and replace their finger on the fingerprint sensor several times. Each finger placement is considered as one view. Each view may consist of a sequence of image frames that taken together define a view.
13.3.3.2 Feature Quality Analysis
The collected samples (called views) are analyzed to extract the features that will be used for matching. The system then assesses the quantity and quality of matchable feature data present in the views, and estimates the probable robustness of that feature data. The results of this analysis determine whether the system can use this set of views for enrollment, or if more, or better, data are needed. If the data are insufficient, the system may request more views of the same finger or request the new user to present a different finger.
Template Generation
If the data is sufficient for enrollment, the system assembles the best of the available data and formats it into a template that will be used as the reference for subsequent matching of this finger.
Template Storage
The resulting template is then stored under an appropriate encryption scheme for recall during subsequent verification and identification operations. Templates can be stored on any media that can hold digital data. On mobile devices templates are typically stored in flash memory.
13.3.3.3. Verification (Claimed Identity Verification)
Verification is the process of authenticating a claimed user identity. A verification event occurs when: (1) a user indicates his/her identity to the system (usually by typing in a username) and (2) the system verifies the claimed identity by comparing the user's live fingerprint to the template stored for that username. This type of comparison is often called a one-to-one comparison because only one stored template is compared to the live fingerprint.
Verification processes generally require significantly less computational horsepower to perform than identification processes, and may be more reliable. However, verification is generally less convenient for the user as the username must be entered manually. Given that user convenience is a primary requirement for fingerprint systems on mobile devices, verification processes are probably inappropriate and identification processes (discussed in the next section) are preferred. In situations where only one person uses a device (which may be a significant percentage of devices) the identification process essentially devolves to a simple verification, so the performance penalty is minimal.
Data Collection
The system typically collects one view of the finger, which may consist of a sequence of image frames. For extremely small sensors, it may be necessary to collect multiple views of the finger to accumulate enough data to perform the fingerprint match.
Feature Analysis
The collected images are analyzed using various forms of pattern recognition algorithms to extract the features to be used for matching.
Matching to a Template
The data from the live finger is compared to the stored template for the claimed identity and a probability that the claimed identity is true is estimated from the match results. The system returns a binary result. The claimed identity is either true or false.
13.3.3.4 Identification (Unassisted Identification)
Identification is the process of finding the current user's identity from a list of possible identities, based solely on the user's live fingerprint. Identification processes do not require the user to enter a username or any other co-joined authentication. Instead, a single touch of the fingerprint sensor is sufficient. Identification processes typically require significantly more computational power than verification. Additionally, in identification processes both the accuracy and the latency of the process are not constant, as they are functions of the size of the reference dataset being searched.
From the process perspective, identification is similar to verification with two notable exceptions: (1) no username is entered, and (2) the system must perform an indexed search of all of the possible enrolled templates to find the matching template if it exists in the dataset. The result of the process is either the selected ID or an indication that the presented finger is not in the dataset.
The identification process, with its one-step usage paradigm, is significantly better suited to convenient personalization than the verification process.
13.3.4 Critical Performance Metrics
13.3.4.1 Biometric Performance
Biometric performance measures evaluate how well the system does the job of recognizing and differentiating people. At the system level, there are two generally accepted classes of problems to be avoided in these recognition systems. The first class of problems occurs when the system cannot acquire a reasonable quality image of the finger. These usability problems are mostly associated with the sensor itself, and are called “failure to acquire” errors. In some systems available today, acquisition failure errors dominate the behavior of the system. The second class of problems occurs when the system has adequate imagery but makes an error in performing the pattern recognition. This second class of problems is more generally associated with the pattern matching software, and can be categorized in classical terms as false accept errors (Type 2) and false reject errors (Type 1).
Usability – Ability to Acquire
Mobile communication devices are rapidly becoming a ubiquitous part of our everyday environment. As such, the fingerprint systems will have to work for everyone's fingers. Failure to operate with fingers that fall outside of a norm – such as elderly, sweaty or dry fingers – will not be acceptable. The systems will have to work in a wide range of environments; not just the office and the car, but also the tennis court, the garage, and the ski lodge. Many fingerprint sensors are extremely sensitive to the condition of the finger skin that they must image. Some sensors available today successfully image young healthy fingers, but are unable to image elderly fingers or fingers with dry skin. Some are unable to function in environments more demanding than a clean office. And yet, some sensors can adequately handle all of these conditions.
The Ability-to-Acquire metric measures a system's ability to capture usable fingerprint images over the range of population demographics, usage patterns, and environmental conditions appropriate for that intended application. It can be represented as the expected percentage of successful finger imaging events over the ranges appropriate for a particular application.
For general-purpose mobile communications and information devices we believe that the fingerprint system's ability to acquire fingerprints should be in the range of 99.99%, over a population demographic that represents the entire world population and includes both clean and slightly contaminated fingers, and over a wide range of both indoor and outdoor environments.
Identification/Verification Accuracy
Identification and verification accuracies are usually represented as the percentage of identification/verification events in which the system delivers an inappropriate response; either incorrectly rejecting a finger that should match (false reject), or incorrectly accepting a finger that should not match (false accept). Identification accuracy and verification accuracy (while using the same type of error metrics) are best treated for this discussion as two different kinds of specifications that are associated with two different implementations of fingerprint authentication systems, as discussed earlier in this chapter.
Verification Accuracy
There are two classes of measurement traditionally used to quantify identification/verification accuracy. These are the False Accept Rates (FARs) and the False Reject Rates (FRRs). We believe that mobile communications device applications when used in verification mode require FARs of 0.1% or less (which is sometimes considered similar to the probability of someone intelligently guessing a user-selected four-digit PIN).
For this type of live fingerprint recognizer, false reject errors come in two varieties. Sometimes a valid user will place his finger on the sensor and be initially rejected, but will immediately try again, repositioning the finger on the sensor, and be accepted. This is called a nuisance reject. It is a special case that only occurs in live fingerprint systems, where the user can retry immediately. Our informal experience suggests that nuisance reject rates exceeding the 5–7% range can degrade the user experience and should be avoided. The second and far more serious type of false reject is the denial-of-service event. In this type of event, the system fails to accept a valid user's fingers even after several retry attempts. Clearly, for user satisfaction reasons, the denial-of-service reject should be avoided. We believe that denial-of-service FRRs of 0.1% or less will be required for ubiquitous deployment.
Identification Accuracy
False Accept Errors
When a system performs an identification event, it must in essence compare the live fingerprint to all of the templates that are considered possible matches for that live finger. For comparison, when an non-enrolled finger is presented to the system, a verification function compares the finger to only one template. Hence it has only one opportunity to make a false accept error. In contrast, when an identification system faces that same non-enrolled finger, it must compare the finger to all of the templates in the dataset. Hence it has as many opportunities to make a false accept error as there are templates in the dataset. It is customary to treat the verification FAR as the base metric for a biometric system. The identification FAR can then be estimated for practical systems with small databases as the product of the verification FAR and the size of the template database.
For a mobile information device, let's assume that five users enroll two fingers each for a total of ten templates. If the verification FAR of the system is in the range of 0.1–0.01% then the identification FAR will be in the range of 1–0.1%.
Confused ID Errors
Systems that perform unassisted identification may mistakenly match enrolled person A's finger to enrolled person B's template. This is a special case of a false accept error that is sometimes called a confused ID error. In systems like mobile communication devices where convenient personalization is a key aspect of the application, confused ID errors may be more problematic than other forms of false accept errors. This is because confused ID errors can occur anytime the device is used, while false accept of a non-enrolled person can only occur when an unauthorized person tries to use the device. Confused ID errors also differ significantly from false accept of non-enrolled fingers in that confused ID errors are effectively denial-of-service events to a valid user.
Confused ID error rates as discussed here are specified as the probability that the system will ever generate a confused ID error based upon a specific dataset size. This is in contrast to the FAR and FRR that are specified on a percentage-of-events basis.
Figure 13.6 shows an order of magnitude estimate of the relationship between template set size and the probability of a confused ID error for unassisted identify systems built using matching subsystems with three different verification FARs: 0.1, 0.01, and 0.001%. A matcher having approximately a 1 in 10,000 verification FAR will have approximately a 1 in 10,000 probability of confusing someone's fingerprint at some point if four people enroll one finger each.
False Reject Errors
When a system is constructed to perform real-time identification against a dataset of more than just a couple templates, it is often not practical to completely compare the live finger to each template in the dataset. It takes too long and/or requires too much processing horsepower. Practical systems use indexes and filters to select a small list of probable match candidates from the larger dataset. The full matching process is performed only on these selected candidates. The indexing and filtering processes are another source of error since they may mistakenly prevent the correct template from being evaluated – leading to a false reject error. Hence the FRRs of identification functions are usually significantly greater than those of verification systems even if they are using the same final match algorithm.
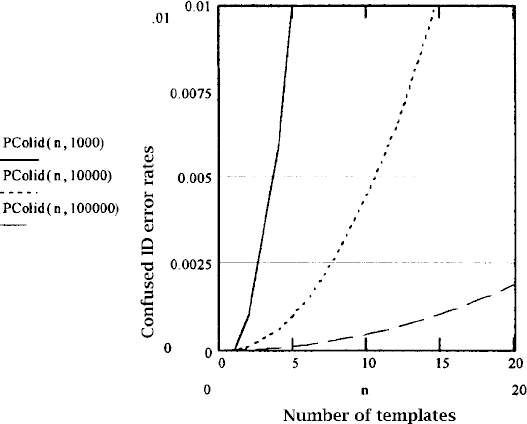
Figure 13.6 Confused ID error rates vs. template dataset size
There is no rule of thumb that can be used to predict the identification FRR from the verification false reject rate because the performance depends on the quality of the indexing and filtering implementation, and the degree of latency reduction that the indexing and filtering attempt to achieve.
13.3.4.2 Measuring Biometric Performance and Understanding Test Results
Given the importance of biometric performance to the success of fingerprint recognition applications, it would be useful to have standardized test methods and specification data that could be used by engineers to predict the biometric performance they could expect of a particular product in the field. While progress is being made, it is unfortunately not yet practical to characterize biometric systems in this general way. This section discusses the problems involved in biometric testing, and some things to watch for when interpreting and using biometric test results.
Some systems are designed to work well in specific types of environments and applications (like offices or banks). Others are designed to be adjusted so they can function in a wide range of conditions. The best sensors and systems automatically adapt to the situation presented and work well in all situations. Many systems fall somewhere in between. To ensure that a planned system will be appropriate to its user demographics and its environment, it is best to collect test data across the full range of conditions that the expected application will experience.
Sensitivity to the Population Demographics
The demographics of the user population that will use a biometric device can have a huge effect on the biometric performance of the system. User characteristics such as age, gender, occupation, ethnicity, and general health all can have a major impact on the biometric performance of a fingerprint system. Too many underlying factors contribute to these dependencies to allow a detailed discussion here. However, we can note that the error rates of some fingerprint systems can vary by factors of 10 depending on the demographics of the test population.
Sensitivity to the External Environment
Many fingerprint systems are sensitive to the weather and climate – especially the temperature and humidity trends. Systems that work well in Florida during January may fail miserably in Maine during January, and may also fail in Florida during July. Most of this sensitivity is due to climate-induced changes in the users' skin. Testing must be performed across the full range of weather and climate conditions that the device's users will encounter during use. Since it is the reaction of the human skin to long-term exposure to climate that drives the variations seen, it is difficult to use simulated climates for testing of these effects. To reliably assess the effects of weather and climate requires testing at multiple locations and during several seasons.
Sensitivity to Finger Skin Condition and Contamination
Mobile applications of fingerprint systems are very likely to encounter fingers that are not completely clean. Even if the user wipes his finger off before using the fingerprint device, the finger skin often remains contaminated with residues of many different substances. Typical finger contaminants include: cooking oil, sugar, dust, soil, magic marker, chalk, powder, moisture, sweat, etc. It is not reasonable to require a user to wash his hands before using the mobile device; therefore the fingerprint system must be able to read through these types of finger contamination.
Many fingerprint readers suffer severe performance degradation when presented with slightly contaminated fingers. Optical fingerprint readers are particularly degraded by finger contamination and because of this may be inappropriate for mobile applications.
Sensitivity to the Application Environment and User Experience
The performance of fingerprint systems is also sensitive to several aspects of the application environment. The mounting and presentation of the sensor determines how accurately and repeatable the user will be able to place his finger on the sensor. A poorly presented sensing surface will degrade the systems biometric performance significantly.
Systems that allow users to practice placing their finger on the sensor (and give feedback to help improve the placement) before the finger is actually enrolled have been shown to perform better than systems that do not offer this kind of training.
Response Time
Given the expected usage patterns described earlier, fingerprint system must typically complete the authentication task within 1–3 s from the time the user presents their finger.
13.3.4.3 Security and Spoof Prevention
The fingerprint system is one aspect of the overall security system built into the mobile device and its infrastructure. The fingerprint system is responsible for authenticating the user and delivering that data securely to the rest of the system. In mobile devices, the most significant threat likely to be posed against the fingerprint system is spoofing the sensor with a fake finger.
Spoofing is the use of a mechanical structure (that can be placed on the fingerprint sensor) to fool the sensor into thinking that a real finger having the desired fingerprint pattern has been placed on the sensor.
The principal objective of fingerprint authentication systems on mobile devices is to allow the user to conveniently achieve low to medium security levels. The fingerprint systems in these devices would be like the locks on a typical home. Most residential door locks and home security systems make it more difficult for the average person to break into a home, but in fact can be defeated by skilled professional thieves. The advantage of these residential systems is that they are inexpensive and not too difficult to use, while making break-ins significantly more difficult. Fingerprint systems should follow the same paradigm. It should be inexpensive and simple to use, while making inappropriate use of the protected device significantly more difficult. One simple way to quantify this basic concept is to require the cost of defeating the fingerprint system to exceed the value realized by the unauthorized person who defeats it. Looking at the issue from a different perspective; if the mobile device of the future is used to perform financial transactions, its security should be at least equivalent to that of the four-digit PIN used in today's debit card systems.
RF E-field sensors such as AuthenTec TruePrint sensors are not fooled by typical latex or silicon rubber fakes. This type of sensor can detect the complex electrical impedance of the finger skin and reject fakes that do not present the correct electrical characteristics. While these devices can be spoofed, it is extremely difficult.
13.3.5 Basic Elements of the Fingerprint System
13.3.5.1 Overview and Architecture
At an overview level, fully realized biometric user identification functionality on a mobile device can be viewed as containing the following subsystems: (1) fingerprint sensor hardware, (2) a computational platform host, (3) biometric software, (4) system application software, and (5) user application software. These components are illustrated in the form of a reference architecture in Figure 13.7.
The fingerprint sensor detects the presence of a finger and converts the patterns on the finger into an electrical form that can be used by subsequent information processing stages. The biometric authentication services software manages and optimizes the sensor hardware, optimizes the fingerprint image, performs feature extraction and matching, and makes decisions to accept or reject an identity based on the results of the matching. It is this layer that typically involves the heaviest computational workloads.
The system application software is the link between the biometric identification system and the host device resources and operating systems. It provides host specific user interface and user control functions to the biometric ID system. It also allows biometric identification to be used to gain access to basic system resources. It performs functions like user login, applications and data protection, and browser password replacement.
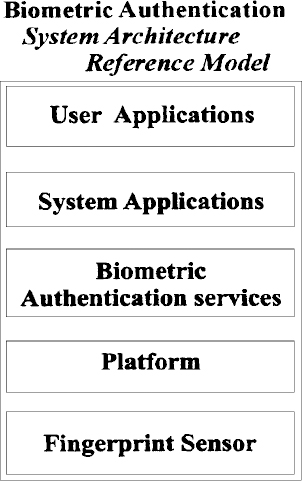
Figure 13.7 Biometric reference architecture
The user application software performs the main functions that the user desires such as voice communications, e-mail, word processing, e-commerce, etc. It uses the identification services to verify the authenticity of the user directing the actions it performs.
13.3.5.2 Fingerprint Sensor Hardware
Candidate Sensor Technologies
Several candidate technologies are currently available for measuring fingerprints within the size and power consumption constraints imposed on mobile wireless equipment. They include optical sensors, thermal sensors, capacitive sensors, and RF E-field sensors.
Optical fingerprint sensors small and thin enough for use in mobile devices can be fabricated using molded plastic fresnel optics and CMOS optical imaging arrays. Their major advantages are physical robustness and industry familiarity. Their principal disadvantages are large size, low image quality, and poor “ability to acquire” finger images in less than optimal conditions.
Thermal array sensors that detect changes in heat flux can be used for fingerprint imaging. In these sensors the finger must be in constant motion to generate a signal, hence they are used by swiping the finger across the surface. Their major advantages are very small size and low cost. Their principle disadvantages are distorted, segmented images caused by the finger swiping motion and poor “ability to acquire” finger images under less than optimal conditions.
Arrays of electronic capacitance sensors can be fabricated into silicon integrated circuits that read fingerprints by measuring differences in local fringing capacitance between pixels. The major advantages of these devices are small size and simple design. Their major disadvantages are physical delicacy, poor image quality, and poor “ability to acquire” finger images in less than optimal conditions.
Silicon fingerprint sensors can be fabricated that couple tiny RF signals into the conductive layer beneath the surface of the finger skin, and then read the shape of this conductive layer using an array of integrated RF sensors. These RF E-field sensors' major advantages are very high image quality, and a high “ability to acquire” finger images in a wide range of less than optimal conditions. Of the sensing technologies practical for mobile device, these are the only ones that read beneath the skin surface. Subsurface imaging makes these devices less sensitive to surface damage and surface contamination than surface reading devices. The major disadvantages are a degree of physical delicacy, and unique control logic that is unfamiliar to the industry.
RF E-field sensors using TruePrint™ technology from AuthenTec, Inc. were used in the prototype system discussed later in this chapter.
Sensor Implementation
Figure 13.8 illustrates the block diagram for a generic fingerprint sensor. All of the blocks may not be present in every sensor, but in most cases they are. The block diagram provides an outline for discussion and comparison of various sensors. In recent silicon sensors, most of the function blocks shown in the diagram are integrated directly onto the sensor substrate.
All sensors start out with some form of signal source that places a signal onto the finger. In optical sensors, the signal source is typically a set of LEDs and a regulated power supply. In thermal sensors the signal source is a heater. In RF E-field sensors, the signal source is a small RF signal generator.
Energy from the signal source is coupled to the finger and the finger's response to that energy is measured by an array of sensor pixels. In optical scanners the pixels are photo-sensors, in thermal systems the pixels are heat flux sensors. In RF E-field devices the pixels are metal plates that act as tiny field sensing antennas.
The signal from each pixel may be amplified and processed as necessary under pixel, and then multiplexed out of the array by scanning control logic. The result of this scan process is typically an analog signal stream of time multiplexed pixel measurements.
More elaborate signal processing can be applied to the signals once they leave the array prior to conversion from analog signals to digital signals in an A-to-D converter. The output of this converter is a digital data stream representing the sequence of pixel signal values scanned by the multiplexer.
Digital processing may be applied to the data stream to perform tasks not easily handled in the analog circuitry, and to prepare the data for transmission via the digital interface circuitry to a processor.
13.3.5.3 Fingerprint Authentication Software
Introduction
The fingerprint authentication software executes on the host device's processor(s). It operates as a service that responds to a request for fingerprint authentication from a system-level program or an application program.
After receiving a program request the software:
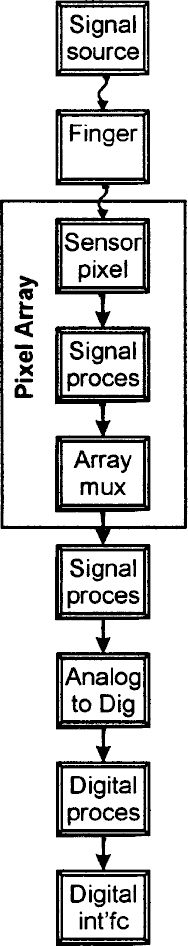
Figure 13.8 Sensor block diagram
- activates the sensor and detects when a finger is placed on the sensor
- collects images from the sensor and manages the user interaction with the sensor
- optimizes the images using various approaches discussed below
- estimates the probability that the live image comes from the same finger as previously stored image data
- determines if the data presented offers sufficient match confidence to declare a verified user identity
The Processing/Accuracy/Latency Trade-Off
Figure 13.9 illustrates a rough rule of thumb for order-of-magnitude estimates of the accuracies and latencies that can be expected from processors of various capabilities.
These plots represent averages of the range of systems that have seen real commercial deployment from 1997 to 2000. (Note: while specific implementations can vary, these graphs on average appear to remain true for 2001.) The accuracy metric used here is the Equal Error Crossover Rate (EER).

Figure 13.9 CPU accuracy/latency trade-off
Sensor Control and Image Optimization
Requirements
Different kinds of sensors require different approaches to sensor control and image optimization. Optical fingerprint sensors generally only offer a single operational parameter that can be controlled – the light intensity. These sensors are very simple to control, but cannot adapt to unusual fingers or environmental conditions. Adaptive sensors like the AuthenTec TruePrint based sensors are widely adaptable, but require more complex sensor control logic to utilize that flexibility. Strip sensors that are used with a swiping finger motion have very special sensor control and image reconstruction needs that require much more complicated logic than stationary finger sensors.
Sensor Adjustment vs. Post Capture Processing
The performance trade-offs illustrated in the above rule of thumb assume a system architecture built around a simple or non-adaptive sensor, which generates large volumes of data that must be optimized through image processing methods before the pattern matching can begin. Industry experience over the last 5 years indicates that several alternative architectures can be built around more flexible adaptable sensors that can generate better quality image data than what has been previously achievable using traditional non-adaptive sensor architectures. The AuthenTec TruePrint™ technology based sensors used in the prototype system fall into this second category of adaptive sensors. These sensors can be adjusted over a wide range of operating points across multiple operational dimensions and operating modes. Systems using these sensors are designed as active closed loop control systems. In these systems, when a finger is placed on the sensor, the image stream is analyzed and the sensor's operating points adjusted on the fly. For each frame, the image quality is analyzed, and the sensor's operating point adjusted toward optimum quality. The result is a better quality image than can typically be acquired from a simple sensor and extensive image processing. From a processor utilization perspective the adaptive sensor systems move some of the processing load from the back end image-processing phase into the real-time sensor control loop. The net result is typically a slightly lower overall computational demand.
These adaptive systems can have somewhat lower CPU utilization than traditional systems for most fingers, but most importantly they can generate high quality images of many fingers that cannot be imaged adequately by traditional systems. This characteristic makes adaptive sensor systems more appropriate for applications that must maintain a very low failure rate across a wide population range and across a wide range of environmental conditions.
Implementation Alternatives
This section will focus on automatic adaptive sensor systems, since they are more appropriate for mobile devices that must work for everyone in a wide variety of environments. The section will discuss the types of logic that can be used for sensor image optimization, as well as their advantages and disadvantages. Also discussed is where the sensor control logic best fits into the overall architecture of a mobile device.
As an example of a highly adaptable sensor, the AuthenTec AES-4000 used in the prototype system (discussed later in this chapter) was used in that system in a configuration that allowed effectively five degrees of freedom in the operating point. The adjustments can be represented as receiver gain, receiver offset, finger excitation voltage, finger excitation frequency, and demodulation phase shift. The first two parameters, gain and offset, allow classic gray-scale normalization of the images directly at the sensor. Each of these first two degrees of freedom has both coarse and fine adjustment capability on the sensor. The latter three parameters are used to adapt to the wide range of electrical behavior seen in human finger skin.
There are several approaches to optimizing the image from a sensor with a wide range of operating points. The choice of approaches is determined by the range of conditions that the system must operate in, the kind of matcher to be used (and the nature of its sensitivities), and the capabilities of the control processor used.
Three of the most common methods of optimization used with flexible fingerprint sensors are:
- Try a fixed sequence of pre-selected operating points
- Use static binary search procedures to find the best operating points
- Use dynamic feedback control regulators to find and track the best operating points
Each of these will be discussed below.
A second aspect arises in characterizing fingerprint sensor control systems. In sensors with multiple configurable operating point control parameters, several approaches can be used to deal with the interactions between control parameters that typically occur in these devices. At one extreme, the interactions between control variables can be ignored, and the controls can be optimized independently by treating them sequentially in time. At the other extreme, the interactions can be modeled and incorporated into a multivariable control algorithm. In this case the system recognizes the control interdependencies and performs simultaneous optimization on the interacting variables. The trade-off here is significantly improved accuracy and repeatability from simultaneous optimization at the price of significantly more complex control logic.
Fixed Sequence of Pre-selected Operating Points
In this optimization strategy a small number of sensor operating points (typically 2–5 points) are pre-selected to span the range of user population and environmental conditions in which the sensor must operate. The control system tries each of these operating points in series until the image quality criterion is reached. In verify and identify operations with local matching, the image quality criterion can be a successful match – the system tries each operating point until a match is achieved. If after trying all operating points no match has been achieved the match attempt is declared false (finger does not match template). When the matching process results cannot be used as a quality criterion (such as during the enroll process, or if the matcher executes remotely from the sensor, or if the matcher is too processing intensive) image quality estimators must be used to identify usable operating points. Estimates of image contrast, brightness, gray scale dispersion, and contrast uniformity have been used as simple image quality estimators.
The advantage of the sequence of pre-selected operating points approach is its simplicity. The disadvantages are low image quality when the small number of operating points selected cannot adequately span the required range of fingers and conditions, and inconsistent images because the system cannot fine-tune itself to specific images.
Static Binary Search Procedures
Static binary search procedures can tune the sensor more accurately to the finger than fixed sequence procedures can. The result is more consistent images over a wider operating range. In this optimization strategy, the image quality is described by a set of measured and/or computed process variables. The control system finds sensor operating parameter values that generate appropriate process variable values using a static binary search of the sensor operating space. The operating point reached at the end of the binary search is used to generate the image used for the biometric processing.
Since binary search procedures assume that the data being searched is stationary, this approach assumes that the finger's imaging characteristics do not change during the period of time the finger is on the sensor and the search is being executed. Unfortunately this assumption is not true in many cases. When a finger is placed on the fingerprint sensor the skin settles slowly onto the sensor surface by slowly changing its shape to match flat sensor surface. The behavior of the skin differs markedly from that of an elastic body, taking on some properties of a viscous fluid. This is sometimes called the finger settling effect. The time it takes the finger skin to settle down onto the sensor surface can vary widely depending on the user's age, degree of callousness, skin moisture content, skin temperature, and finger pressure. This time constant typically ranges from 0.3 to 4 s, and occasionally approaches 10 s for fingers with certain medical conditions. A second non-stationary effect is the accumulation of sweat under the sweat glands during the time the finger is on the sensor. During several seconds of contact, sweat accumulation can significantly change the characteristics of the finger. The non-stationary aspects of finger skin behavior can make binary search techniques less effective and cause wide variations in the quality of the images generated by binary search.
The advantages of binary search procedures include: better quality images – much more finely tuned images than can be achieved with pre-selected operating points, operational simplicity, low computational overhead, and widespread programmer familiarity with binary search procedures. The chief disadvantages are inconsistent image quality resulting from non-stationary finger behavior, and difficulty in adapting binary search to sensors with multiple degrees of freedom.
Dynamic Feedback Control Regulators
The dynamic feedback control regulators approach is similar in some respects to the binary search approach in its use of process variables. However, it applies different, more flexible, methods of selecting the next operating point. The image quality is again described by a set of measured and/or computed process variables. The control system finds sensor operating points that optimize the process variable values using classical analog error regulator algorithms. The system determines the process variable error as the difference between the desired process variable value and its current actual value. Then, using knowledge of the sensor's response to changes in its operating point, the system estimates the value of the operating point parameter that would generate minimum process variable error, and establishes that as the new operating point value. The process is repeated for each image frame, with the regulators constantly readjusting the sensor operating points to adapt to the continuously changing finger characteristics. In these systems several image frames are typically submitted to the matcher until the finger has settled to the point where it matches the template. If no match is achieved after a reasonable period of time (typically 2–4 s) a “does-not-match” result is declared.
Simultaneous Multivariable Control
The most flexible sensors available today adapt to wide ranges of conditions by offering several degrees of freedom within their operating space. Using regulator style controls, several interdependent process variables can be optimized simultaneously using well-understood multivariable control methods. These methods can produce more repeatable image optimization than sequential optimization of individual process variables, and will generally converge faster.
The principle advantages of using regulator style controls are: best quality optimized images, most repeatable images, and operation in wider ranges of conditions by taking advantage of sensors with multiple degrees of freedom. The major disadvantages are the somewhat higher computational loads imposed by regulator systems, more complex control logic, and less programmer familiarity with multivariate analog control design.
Integrating the Sensor Controls into the Architecture
Architecturally there are three places where the intelligence that optimizes the sensor operating point can reside: (1) image analysis and optimization logic can be built into the sensor, (2) an independent processor can be dedicated to sensor image optimization, or (3) the host system's processor can perform the optimization logic.
The logic to implement a control strategy based on several pre-selected operating points (as well as the image quality estimation that goes along with it) could be implemented directly in the sensor silicon at very little extra cost. Unfortunately these simple control strategies cannot supply adequate image quality across the wide range of user demographics and environmental conditions needed by consumer mobile devices. We believe that fingerprint systems in mobile devices will need full-scale dynamic feedback regulator systems to succeed as ubiquitous commercial devices. This type of system needs the resources of a reasonable sized processor. As a result, it appears to be more cost effective to use the existing host processor for image optimization rather than build a processor into the sensor silicon or incorporate a dedicated processor into the system design for sensor control.
Pattern Matching Algorithms
Input Data
The input data to the pattern matching algorithms is generally in the form of bitmap images. The bitmaps may represent skin areas from less than 1 cm2 (for the smaller RF E-field devices) to 4 cm2 (for the smaller types of optical devices).
Approaches
Fingerprint images contain a wealth of information, some of which is stable over time and some of which is less stable. A wide variety of approaches can be used to algorithmically extract the stable information from the images and compare this information across different finger presentations. Different algorithms have different capabilities and accuracies and require different amounts of computational horsepower to achieve those accuracies. An introduction to the most common classes of these algorithms is included in this section.
Algorithms that determine how closely two fingerprint images match can be grouped according to the specific type of information that they use for the comparison. The following discussion will use this grouping to discuss the algorithms. Also included will be an assessment of the characteristics of these approaches when implemented in computerized matching systems for the new generation of fingerprint sensors.
A Shift in Focus
The recent appearance of high-quality sensors capable of producing highly repeatable fingerprint images (such as the AuthenTec TruePrint™ sensors) are opening up a new era in fingerprint matching algorithm approaches.
Algorithms for the previous generation of live fingerprint sensors had to devote large amounts of computing horsepower to filtering and conditioning the raw image, and to attempting to reconstruct the real fingerprint pattern from the often weak and incomplete image data provided by the sensors.
The use of moving-finger placement strategies for image acquisition (rolled finger for law enforcement cards, or swiped finger for strip sensors) introduced large elastic distortions in the images that further complicated the matching process. The matching methods focused on estimating the probability that this weak data in the enrolled templates and in the current image could be mapped back to the same finger. The use of a stationary finger placement on the sensor rather than a rolled placement or swiped placement has eliminated the need to compensate for the large elastic distortions that these acquisition methods introduced. Hence the most recent algorithms focus on accurately matching reliable repeatable images rather than on estimating probable matches from unreliable data.
A Rule of Thumb
One rule of thumb for assessing the value of algorithmic approaches to computerized fingerprint matching is to estimate the amount of differentiation achieved by a method divided by the amount of computation required by the method:
Value = Differentiation/Computation
The following discussion uses an informal, qualitative form of this metric to compare some of the various algorithmic approaches.
Classical Classification
This group of approaches is based on traditional manual methods. It includes approaches such as the Henry system that classifies fingerprints into several types based on the visual patterns created by the ridges in a finger. The types include whorls, arches, loops, tented arches, etc. The human visual perception system performs the complex computations involved in this type of analysis very efficiently.
Classical methods like the Henry system are not often used in computerized matching today because, lacking the efficiencies of the human visual perception system, the differentiation-to-computation ratio of typical implementations is rather low.
Ridge Minutia
Many computerized fingerprint-matching systems identify features in the image called minutia points. Classical minutia points are those locations where either a single ridge line splits (bifurcates) into two ridges, or a ridge line terminates. Ridge minutia have been used in manual fingerprint matching for many years and are well understood. The specific location of the minutia points in fingerprint images has very little correlation with genetic heritage. Even in identical twins, the minutia patterns are different. Figure 13.10 illustrates ridge minutia in a fingerprint.
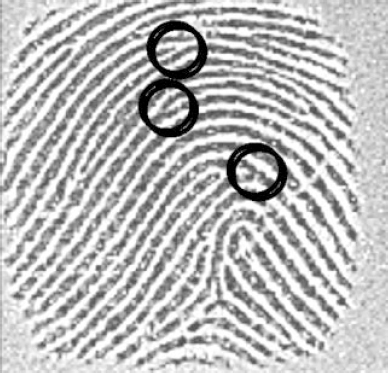
Figure 13.10 Ridge minutia in a fingerprint image
In computerized systems, these minutia points can be identified within a fingerprint image using several different image analysis techniques. They are then located spatially with respect to each other using physical measurements – e.g. (x, y) coordinates – or using topographic references, e.g. number of ridge transitions between the minutia. The result of this minutia extraction process is a list of minutia points and their spatial relationships for the image under analysis. A comparison is made between two images and a degree of similarity computed by comparing the two minutia lists.
Ridge minutia algorithms have been common in computerized fingerprint matching since the early 1980s. They provide a high degree of differentiation when given full finger images, but require a fairly large amount of computation to extract the minutia points from the image. In minutia systems, the processor workload is not evenly split between the extraction and matching processes. The matching process is much faster than the extraction process. This makes minutia systems useful as an early step in one-to-many matching systems.
Since ridge minutia are small, localized features, small amounts of noise or distortion in the images may hide minutia or simulate minutia, causing false conclusions. Minutia systems are difficult to use by themselves in systems that work with smaller image sizes, because some fingers have such low minutia densities that only a few minutia are seen in the smaller images.
Ridge Flow Direction Vectors
The directional properties of the fingerprint ridges constitute a feature set that can be used for matching. A two-dimensional matrix of vectors representing the ridge direction at various points in the image is called a ridge flow map. Ridge flow maps (Figure 13.11) can be more useful matching features in mobile device systems than they have been in the law enforcement systems of the past.
Ridge flow maps have only limited utility when evaluating images acquired from rolled finger presentations (such as produced for law enforcement using ink and cards) due to the high level of shape distortion produced by rolling the finger across the card. Hence ridge flow maps are not matched directly in most law enforcement systems. However, many modern electronic fingerprint scanners use a slap style of acquisition where the finger is simply placed stationary on the sensor. This method of acquisition minimizes shape distortion and allows the ridge flow map to be used as a reasonable feature set for image matching. (Note that the linear swipe style of the fingerprint sensor does not generate low distortion images and cannot take advantage of this type of ridge flow matching algorithm.)

Figure 13.11 Ridge flow vector matrix superimposed on the fingerprint image
Ridge flow matching algorithms can generate a moderate degree of differentiation with a moderate amount of computation. For lower accuracy applications, the differentiation-to-computation ratio can be more favorable in ridge flow matching algorithms than in many others. Since the ridge flow direction is a fairly large feature these algorithms are not as susceptible to small amounts of noise as minutia algorithms. However, severely broken images or images with large amounts of twisting or pulling distortion often cannot be accurately matched.
Specific Ridge Pattern
The specific ridge pattern itself can be used for matching directly. Systems that look at the ridge pattern extract the pattern information by removing the fine structure such as ridge width variations, pores, and other small-scale features. The resulting ridge lines can be directly compared using image cross correlation techniques – hence these matchers are often called image correlation matchers. Figure 13.12 is an illustration of a ridge pattern map. Note that the fine detail has been removed to enhance accurate representation of the pattern of the ridges. Ridge pattern correlators can be extremely accurate if they are combined with well-constrained distortion mapping algorithms. The distortion analyzer is needed because even slap prints often exhibit distortion in excess of one ridge width over a 1/4–1/2 inch distance. The distortion analyzer must be very careful to restrict the distortion to that which is physically probable to avoid warping one fingerprint to falsely match another.

Figure 13.12 Normalized ridge pattern map – as used in image correlation matching
Ridge pattern correlation is another technique that benefits from the low distortion achieved by modern slap sensors when compared to rolled finger sensors and swipe sensors.
Ridge pattern correlators can generate a very high degree of differentiation between fingerprints but require a very large amount of computational energy to do so. These processing intensive algorithms are well suited to performing one-to-one matches in situations that can afford powerful DSPs or Pentium III class processors.
Fine Structure
The previously described approaches to matching fingerprints are all based on large-scale attributes of the ridge structure. Typically these systems attempt to remove small-scale fluctuation from the images before matching the features. When smaller sensors are used, more information must be extracted from smaller areas of skin to provide enough data for differentiation of fingerprints. As a result, methods of using smaller features called fine structure are of considerable interest for use on mobile devices. Two types of fine structure information have been used successfully to aid differentiation in fingerprint matching: pores, and detailed ridge shape. These will be discussed briefly below. These methods require higher image quality and more detailed repeatability from the sensor in order to be useful.

Figure 13.13 (a) Image detail showing strong pore locations. Example pores are circled in violet. The sensor is an AuthenTec AFS-2 250 ppi resolution. (b) Image detail showing areas of strong detail structure near minutia points
Pores
Pores are the termination of the sweat ducts on the surface of the skin. They can sometimes be seen in optical images and are generally even more pronounced on sensors using electronic imaging techniques. Pores are known to be stable over time and are occasionally used in forensic fingerprint identification. Figure 13.13a shows the pores on an image taken with an AuthenTec RF E-field fingerprint sensor. Notice that strong pores are clearly visible even at 250 ppi resolution using an RF E-field sensor.
Ridge Detail Shape and Thickness Variations
Ridge detail, shape, and thickness variations are other types of fine structure that are fairly stable and can be used for differentiation in fingerprint matching. The detail structure of the area around the core, deltas, and minutia points are sometimes used because these regions are easy to locate and often contain a lot of entropy in the detail. Alternatively areas not containing large-scale structure can be compared for detail structure when a large-scale structure is not available. Figure 13.13b shows some examples of ridge detail structure.

Figure 13.14 Fingerprint authentication prototype architecture for OMAP mobile systems
Fingerprint matching systems often combine several algorithmic methods, such as those discussed above, to achieve high match accuracy. The best results are obtained when the selected methods use orthogonal features classes. Combining such statistically independent matching algorithms may increase confidence levels beyond that which is practical for a single algorithmic approach.
13.3.6 Prototype Implementation
13.3.6.1 Description
A prototype implementation of fingerprint recognition in a mobile device was constructed and demonstrated at the GSM conference in February 2001. The prototype demonstrated live real-time fingerprint authentication using a very small silicon fingerprint sensor (AuthenTec AES-4000) and a combination microcontroller + DSP development board (Texas Instruments' OMAP development board). The architecture of the prototype system is illustrated in Figure 13.14.
13.3.6.2 Functions
The demo system allowed enrolled users to use their fingerprint to access website accounts that were previously secured by standard personal passwords. For each user, the system stored the user's passwords and the associated website accounts in encrypted internal storage. The data becomes available and is sent to the website when the fingerprint is successfully verified.
Table 13.2 Component operating speeds in the OMAP prototype system and in the production OMAP 3.1 integrated part
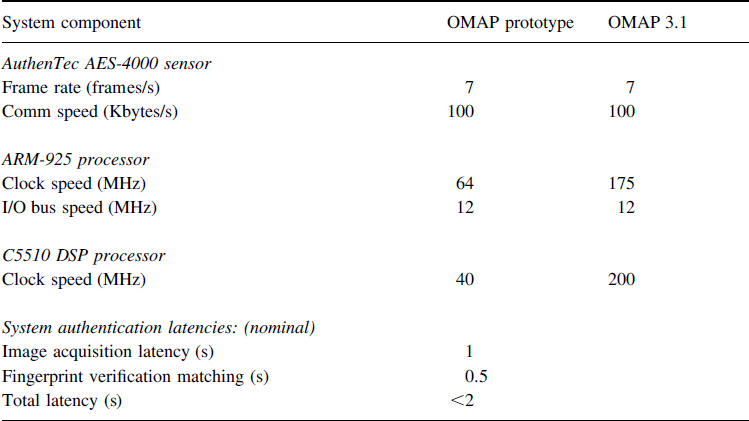
13.3.6.3 Architecture
Platform Performance
While the performance of the OMAP system was limited by its board level implementation of the interprocessor bridge, it was sufficient to demonstrate the basic functionality of system.
Component operating speeds in the OMAP prototype system and in the production OMAP 3.1 integrated part are shown in Table 13.2.
13.3.7 Prototype System Processing
13.3.7.1 Sensor Control and Image Optimization
Sensor Scanning and Data Acquisition
Most fingerprint readers have some form of an array of sensitive spots built into a silicon substrate that receives energy from the section of the finger placed over them. These spots called pixels serve as energy transducers; converting light, heat, or electric fields into electrical signals. Scanning a fingerprint requires that each of these transducers be read and the resulting signals measured and converted to digital form for use by a computer. The AuthenTec AES-4000 sensor used in the prototype has over 8000 of these pixels.
Sensor scanning is primarily controlled by logic internal to the AuthenTec AES-4000 sensor. The sensor detects the presence of a finger and begins image streaming. Array scanning logic and timing are internal to the sensor as well as all the timing and sequencing for the RF demodulation, analog data acquisition, and digital-to-analog conversion.
When using sensors that do not have internal scan control logic, the host CPU would control and sequence the detailed scanning and data acquisition process.
Gray Scale Normalization
Gray scale normalization is the process of adjusting the image so that the features of interest can be easily discerned, by positioning the information about those features uniformly across the gray scale range of the image. It is like adjusting the aperture and shutter speed of an optical camera, or the contrast and brightness of a CRT.
In the AuthenTec AES-4000 sensor the gray scale normalization task is split between the on-sensor logic and the host CPU.
Histogram Processing
While scanning the image, the sensor is also accumulating a gray scale histogram of that image. To reduce the time required for gray scale optimization the sensor initially sends only the histogram to the host without the image. The host analyzes the histogram as discussed below in AGC control, and sends the sensor new operating points to improve the gray scale. When the host determines that the histogram is close enough to optimal for use, it tells the sensor to start sending complete images along with the histograms.
AGC control
The AGC controls are implemented as software running in the ARM 925 processor. The current demo runs simplified control logic to reduce the load on the prototype board processor. In order to achieve the acquisition capabilities needed for general purpose mobile devices, implementations designed for full speed integrated OMAP processors will probably execute a more capable control system similar to the three-level hierarchical control system used in some of AuthenTec's PC based systems.
Spatial Filtering
In many systems, the fingerprint image is filtered to emphasize the features of interest and remove elements that will confuse feature recognition. The filters used vary depending on the class of features used for matching and on the type of artifacts and noise introduced by the sensor.
Edge Sharpening and Baseline Variation Removal
Edge sharpening and baseline variation removal are generally performed using some form of two-dimensional spatial bandpass filter. The AuthenTec sensor used in the prototype performs this function on-sensor using parallel processing hardware integrated into the sensor's pixel electronics. Removing undesired signal information at the sensor reduces the required channel bandwidth downstream of the sensor and reduces the processing workload of the entire system.
Sensors that do not contain integrated spatial filtering often require digital spatial filtering as an early step in the image processing thread.
Artifact Removal
Many types of sensors generate artifacts in their output images that must be removed to avoid confusing the subsequent feature extraction and pattern recognition processes.
Fixed Pattern Noise
Fixed pattern noise is spatial signal variation that is stationary with respect to time. Fixed pattern noise comes primarily in two forms in fingerprint sensors: repetitive scanning noise and random pixel noise. Repetitive scanning noise is generated by differences in the data acquisition paths taken by data from the sensor's structural grouping of the pixels. It is typically visible as row artifacts, column artifacts, or region artifacts. Random pixel noise comes from random variation in the characteristics of the individual pixels. Removal of random pixel noise usually entails construction and maintenance of a detailed pixel performance map for each individual sensor.
For the prototype system using the AuthenTec AES-4000 sensor, no fixed pattern noise removal was necessary. Some of AuthenTec's higher performance PC based fingerprint systems use a scan noise reduction filter to clarify the images from extremely dry fingers. Similar filters may be used for the high performance systems envisioned for mobile devices.
Data Skew from Finger Movement
Sensors that require finger movement (such as swiping) during scanning must compensate for varying shift in finger position during the scan process. If the sensor is a narrow strip, multiple one-dimensional image strips must be collected. If their data is to be used collectively, spatial relationships between the strips must be established and the strips integrated into a single image. This partial image integration process is sometime called stitching.
The AuthenTec AES-4000 sensor uses a slap presentation rather than a swipe. No finger movement occurs during the scan hence it does not require data skew compensation or image stitching.
Sensors may exhibit time varying noise for a wide variety of reasons. In single image snapshot systems little can be done to correct this. The same is generally true for swipe systems. Multiple image frames from streaming systems like the AuthenTec AES-4000 can be time-integrated to reduce the effects of time varying noise.
The prototype system did not require integration at the image frame level to reduce noise. This type of processing may become more important with lower voltage sensors that operate closer to their noise floor.
Image Feature Optimization
Sensors with very flexible operating characteristics can be adjusted to optimize the clarity of the specific feature type the matcher uses. This behavior can allow the sensor to acquire images of very unusual fingers that require operating points far removed from the typical norm. This type of adaptation requires that the feature extractor provide an estimate of the clarity of the features it is using, and that the sensor has an adjustment mechanism that affects the imaging of those features.
The AuthenTec TruePrint sensor technology offers several patented adaptive mechanisms for clarifying fingerprint ridges. Two of the most useful of these are the demodulation phase adjustment and the excitation signal frequency and amplitude adjustments.
Excitation Signal and Demodulation Phase Shift
The dead skin through which the signals pass in TruePrint sensors is an extremely complicated electrical structure. When presented with an AC excitation signal, both real and imaginary currents can flow, and minute pockets of trapped saline may exhibit electrical-field saturation and hysteresis effects. These characteristics make different fingers respond differently to different excitation frequencies and amplitudes. Optimizing the frequency and amplitude of the excitation signal for best feature clarity can significantly improve the systems ability to acquire unusual fingers.
Synchronous demodulation schemes such as employed in the AuthenTec sensors allow those systems to differentiate the real and imaginary component of the measured signal by shifting the phase of the demodulation clock with respect to the excitation signal. This capability can be used to suppress the effects of surface perspiration on the clarity of the image.
The prototype system implemented a binary search through the demodulation phase shift space to clarify the images of sweaty fingers. The prototype enhanced very dry finger acquisition by adjusting the excitation frequency. It used two excitation frequencies, trying one first and if sufficient image quality could not be obtained trying the second.
13.3.7.1 Pattern Matching Algorithm
The pattern matching algorithm on the prototype system was limited to a single stage, single feature-type algorithm because of the limited computational performance of the OMAP concept demonstration board.
The monolithic silicon implementation of the OMAP architecture is expected to be capable of executing accurate multi-stage, multiple feature-type matching algorithms, that have demonstrated (on other computing platforms) the biometric performance levels we believe are required for mobile communications and information devices.
13.4 Conclusions
In this chapter we have presented two of the most promising techniques for user authentication within mobile handsets. Both speech and fingerprint techniques now exist and can be implemented using compute power that is presently available on modern DSPs. This chapter discussed the technical challenges faced by each method, and the engineering trade-off decisions that must be made in order to obtain the desired level of performance. The use of such technology is now dependent on our ability to integrate it into the handset in a user friendly and efficient manner
Reliable user identification capabilities working together with secure communications capabilities can allow the mobile wireless device to become a highly capable and secure personal controller for the electronic systems that serve us. Whole new classes of applications programs on the mobile device platform can now perform secure remote control of everything from our investment portfolios to the locks on our homes and cars.
References
[1] Jain, A., Hong, L. and Pankanti, S., ‘Biometric Identification’, Communications of the ACM, Vol. 43, No. 2, February 2000, pp. 90–98.
[2] Naik, J.M., ‘Speaker Verification: A Tutorial’, IEEE Communications Magazine, Vol. 28, January 1990, pp. 42–48.
[3] Furui, S., Digital Speech Processing, Synthesis, and Recognition, Marcel Dekker, New York, 2001.
[4] Rabiner, L. and Schafer, R.W., Digital Processing of Speech Signals, Prentice-Hall, Englewood Cliffs, NJ, 1978.
[5] Allen, J.B., ‘Cochlear Modeling’, IEEE ASSP Magazine, Vol. 2, January 1985, pp. 3–29.
[6] Markel, J.D. and Gray Jr., A.H., Linear Prediction of Speech, Springer-Verlag, New York, 1976.
[7] Mammone, R.J., Zhang, X. and Ramachandran, R. ‘Robust Speaker Recognition’, IEEE Signal Processing Magazine, Vol. 13, September 1996, pp. 58–71.
[8] Furui, S., ‘Cepstral Analysis Technique for Automatic Speaker Verification’, IEEE Transactions on Acoustics, Speech, and Signal Processing, Vol. 29, April 1981, pp. 254–272.
[9] Reynolds, D., ‘Speaker Identification and Verification using Gaussian Mixture Speaker Models”, 1994 ESCA Workshop on Automatic Speaker Recognition, Identification, and Verification, pp. 27–30.
[10] Rabiner, L.R. and Juang, B.H., Fundamentals of Automatic Speech Recognition, Prentice Hall, Englewood Cliffs, NJ, 1993.
[11] Liu, C.S., Wang, H.C. and Lee, C.H., ‘Speaker Verification using Normalized Log-Likelihood Score’, IEEE Transactions on Speech and Audio Processing, Vol. 4, January 1996,, pp. 56–60.
[12] Netsch, L.P. and Rao, K.R., ‘Robust Speaker Verification using Model Decorrelation and Neural Network PostProcessing’, Proceedings of ISPACS '98, Melbourne, Australia, November 1998.