
Chapter 3
The Volatility Framework
The Volatility Framework is a completely open collection of tools, implemented in Python under the GNU General Public License 2. Analysts use Volatility for the extraction of digital artifacts from volatile memory (RAM) samples. Because Volatility is open source and free to use, you can download the framework and begin performing advanced analysis without paying a penny. Furthermore, when it comes down to understanding how your tool works beneath the hood, nothing stands between you and the source code—you can explore and learn to your fullest potential.
This chapter covers the basic information you need to install Volatility, configure your environment, and work with the analysis plugins. It also introduces you to the benefits of using Volatility and describes some of the internal components that make the tool a true framework. Also, keep in mind that software evolves over time. Thus, the framework’s capabilities, plugins, installation considerations, and other factors may change in the future.
Why Volatility?
Before you start using Volatility, you should understand some of its unique features. As previously mentioned, Volatility is not the only memory forensics application—it was specifically designed to be different. Here are some of the reasons why it quickly became our tool of choice:
- A single, cohesive framework. Volatility analyzes memory from 32- and 64-bit Windows, Linux, Mac systems (and 32-bit Android). Volatility’s modular design allows it to easily support new operating systems and architectures as they are released.
- It is Open Source GPLv2. This means you can read the source code, learn from it, and extend it. By learning how Volatility works, you will become a more effective analyst.
- It is written in Python. Python is an established forensic and reverse engineering language with loads of libraries that can easily integrate into Volatility.
- Runs on Windows, Linux, or Mac analysis systems. Volatility runs anywhere Python can be installed—a refreshing break from other memory analysis tools that run only on Windows.
- Extensible and scriptable application programming interface (API). Volatility gives you the power to go beyond and continue innovating. For example, you can use Volatility to drive your malware sandbox, perform virtual machine (VM) introspection, or just explore kernel memory in an automated fashion.
- Unparalleled feature sets. Capabilities have been built into the framework based on reverse engineering and specialized research. Volatility provides functionality that even Microsoft’s own kernel debugger doesn’t support.
- Comprehensive coverage of file formats. Volatility can analyze raw dumps, crash dumps, hibernation files, and various other formats (see Chapter 4). You can even convert back and forth between these formats.
- Fast and efficient algorithms. This lets you analyze RAM dumps from large systems in a fraction of the time it takes other tools, and without unnecessary memory consumption.
- Serious and powerful community. Volatility brings together contributors from commercial companies, law enforcement, and academic institutions around the world. Volatility is also being built on by a number of large organizations, such as Google, National DoD Laboratories, DC3, and many antivirus and security shops.
- Focused on forensics, incident response, and malware. Although Volatility and Windbg share some functionality, they were designed with different primary purposes in mind. Several aspects are often very important to forensics analysts but not as important to a person debugging a kernel driver (such as unallocated storage, indirect artifacts, and so on).
What Volatility Is Not
Volatility is a lot of things, but there are a few categories in which it does not fit. These categories are:
- It is not a memory acquisition tool: Volatility does not acquire memory from target systems. You acquire memory with one of the tools mentioned in Chapter 4 and then analyze it with Volatility. An exception is when you connect to a live machine over Firewire and use Volatility’s
imagecopyplugin to dump the RAM to a file. In this case, you are essentially acquiring memory. - It is not a GUI: Volatility is a command line tool and a Python library that you can import from your own applications, but it does not include a front-end. In the past, various members of the forensics community developed GUIs for Volatility, but these are currently unsupported by the official development team.
- It is not bug-free: Memory forensics can be fragile and sensitive in nature. Supporting RAM dumps from multiple versions of most major operating systems (that are usually running obscure third-party software) comes with a cost: It can lead to complex conditions and difficult-to-reproduce problems. Although the development team makes every effort to be bug free, sometimes it’s just not possible.
Installation
With every major release, Volatility is distributed in several formats, including a standalone Windows executable, a Windows Python module installer, and source code packages in both zip and gzip/tarball archives. Users typically choose which format to download based on the host operating system (in which they intend to run Volatility) and the types of activities they intend to perform with the framework, such as simply using it to analyze memory dumps or for development and integration with external tools. You can find a description of the formats in the following sections.
Standalone Windows Executable
Using the executable is the quickest and easiest way to start using Volatility on a Windows analysis machine. The executable includes a Python 2.7 interpreter and all Volatility’s dependencies. No installation is required; just launch the executable from a command prompt, as shown in the following example:
C:>volatility-2.4.exe --help
Volatility Foundation Volatility Framework 2.4
Usage: Volatility - A memory forensics analysis platform.
Options:
     -h, --help   list all available options and their default values.
                  Default values may be set in the configuration file
                  (/etc/volatilityrc)
[snip]You can run the executable directly from removable media such as a USB drive, which turns Volatility into a portable utility that you can take with you on remote investigations (where you may not be allowed to bring your own laptop). In the past, many people have also written scripts to automate the collection of data from the standalone executable by redirecting its output to text files.
Windows Python Module Installer
Choose this package if your preferred analysis system is Windows and you plan to examine or modify the Volatility source code—whether it’s for debugging, for educational purposes, or to build tools on top of the framework. In this case, you must also install a Python 2.7 interpreter and the dependencies (a complete listing is provided later in the chapter).
By default, the source files are copied to C:PythonXXLibsite-packagesvolatility (where XX is your Python version), and the main vol.py script is copied to C:PythonXXScripts. Thus, you can use the framework in the following manner:
C:>python C:Python27Scriptsvol.py --help
Volatility Foundation Volatility Framework 2.4
Usage: Volatility - A memory forensics analysis platform.
Options:
     -h, --help   list all available options and their default values.
                  Default values may be set in the configuration file
                  (/etc/volatilityrc)
[snip]
Source Code Packages
This is the most versatile format—you can use it on Windows, Linux, or Mac, provided you already have a working Python 2.7 interpreter and the required dependencies. It is important to note, however, that you have two options for installing the code in these packages once you extract them. Each method has its advantages:
- Method 1 (using setup.py): Extract the archive and run
python setup.py install. You may need administrator privileges to complete the installation. This takes care of copying files to the right locations on your disk so that the Volatility namespace is accessible to other Python scripts. If you do not plan on importing Volatility as a library for development projects, consider using method 2 instead. The downside of method 1 is that it is difficult to upgrade or uninstall. - Method 2: (not using setup.py): Extract the archive to a directory of your choice. When you want to use Volatility, just run
python /PATH/TO/vol.py. This method is often seen as cleaner because no files are ever moved outside of your chosen directory, so it also does not require admin privileges. If you use this method, you can easily have multiple versions of Volatility available at the same time by just keeping them in separate directories. To uninstall, just delete the directory.
Development Branch (Code Repository)
Volatility is currently hosted on Github. This is where you can find the most recent bleeding-edge code, including any patches to fix bugs that were identified after a release and also any major new features that are being tested before they reach the mainstream. Thus, this code is for people who are less interested in a stable release and more interested in what’s coming next.
By default, the source control utilities are built into recent Mac operating systems and they are available through the package managers of most Linux distributions. For example, you can type apt-get install git on Debian/Ubuntu or yum install git-core on Centos/Red Hat. For Windows, you can download mysysGit (http://msysgit.github.io) or use the GitHub application (https://windows.github.com). Once you have the tools installed, you can check out the Volatility source code. Here’s an example of cloning the repository on Linux or Mac:
$ git clone https://github.com/volatilityfoundation/volatility.git
Cloning into 'volatility'...
remote: Counting objects: 10202, done.
remote: Compressing objects: 100% (2402/2402), done.
remote: Total 10202 (delta 7756), reused 10182 (delta 7736)
Receiving objects: 100% (10202/10202), 12.11 MiB | 343.00 KiB/s, done.
Resolving deltas: 100% (7756/7756), done.
Checking connectivity... done.

$ python volatility/vol.py --help
Volatility Foundation Volatility Framework 2.4
Usage: Volatility - A memory forensics analysis platform.
Options:
     -h, --help   list all available options and their default values.
                  Default values may be set in the configuration file
                  (/etc/volatilityrc)
[snip]
After developers commit patches or changes to the source code, you can sync by simply typing git pull, as opposed to waiting for a new release. In this case, you transfer only files that were changed since your last update.
Dependencies
As previously mentioned, if you’re working with the standalone Windows executable, you do not need to worry about dependencies. In all other cases, you may need to install extra packages depending on the Volatility plugins that you intend to run. A majority of core functionality will work without any additional dependencies (aside from the standard Python interpreter). The listing that follows identifies the third-party modules that Volatility can leverage and the specific plugins that utilize them.
- Distorm3: A powerful disassembler library for x86/AMD64 (http://code.google.com/p/distorm). Volatility plugins
apihooks,callbacks,impscan,volshell, linux_volshell, mac_volshell, andlinux_check_syscalldepend on this library. - Yara: A malware identification and classification tool (http://code.google.com/p/yara-project). Volatility plugins
yarascan,mac_yarascan, andlinux_yarascandepend on this library. - PyCrypto: The Python Cryptography Toolkit (https://www.dlitz.net/software/pycrypto). Volatility plugins
lsadumpandhashdumpdepend on this library. - PIL: The Python Imaging Library (http://www.pythonware.com/products/pil). The
screenshotplugin depends on this library. - OpenPyxl: A Python library to read and write Excel files (https://bitbucket.org/ericgazoni/openpyxl/wiki/Home). The
timelinerplugin, when used in the xlsx output mode, depends on this plugin.
For details on how to install the dependencies, you should read the documentation provided by the project maintainers. In most cases, you will just be running python setup.py install or using a package manager. If the dependencies ever change, you can always find a current list on the Volatility wiki.
The Framework
The Volatility Framework consists of several subsystems that work together to provide a robust set of features. Over the next few pages, we will introduce the key components in a concise but thorough manner. Although some of the components are geared toward developers rather than users of the framework, the terms and concepts that you learn here will be extremely valuable to understanding how memory forensics tools operate, and they will be mentioned throughout the rest of the book.
VTypes
This is Volatility’s structure definition and parsing language. If you recall from Chapter 2, most operating systems and applications that run on those operating systems are written in C, with abundant use of data structures to organize related variables and attributes. Because Volatility is written in Python, you need a way to represent C data structures in Python source files. VTypes enable you to do exactly that. You can define structures whose member names, offsets, and types all match the ones used by the operating system you’re analyzing, so that when you find an instance of the structure in a memory dump, Volatility knows how to treat the underlying data (i.e., as an integer, string, or pointer).
For the upcoming example, assume that you are dealing with C data structure like this:
struct process {
    int pid;
    int parent_pid;
    char name[10];
    char * command_line;
    void * ptv;
};
The structure has five members: two integers, a character array, a pointer to a string, and a void pointer (more about this in the upcoming “Overlays” section). The equivalent structure in the VType language is as follows:
'process' : [ 26, {
    'pid' : [ 0, ['int']],
    'parent_pid' : [ 4, ['int']],
    'name' : [ 8, ['array', 10, ['char']]],
    'command_line' : [ 18, ['pointer', ['char']]],
    'ptv' : [ 22, ['pointer', ['void']]],
}]
At first glance, the syntax may appear slightly complex, but it is just a series of Python dictionaries and lists. The name of the structure, process, is the first dictionary key, and it is followed by the total size of the structure, 26. You then have each member, along with their corresponding offsets from the base of the structure and their types. For example, name is at offset 8 and it is an array of 10 characters. As you get familiar with the syntax and begin modeling more elaborate structures, you will notice the VType language supports just as many data types as C provides. For example, you can define pointers, bit fields, enumerations, and unions, to name a few.
The following example shows an _EPROCESS structure from a Windows 7 x64 system. The total size in bytes of the structure is 0x4d0, and it begins with a member named Pcb, which is actually another structure of type _KPROCESS. Notice that there are three different members at offset 0x1f8: ExceptionPortData, ExceptionPortValue, and ExceptionPortState. This is an example of how a union appears in the VType language. As you may know, the size of a union is dictated by the largest element that it contains, which is 8 bytes in this case (an unsigned long long). Although ExceptionPortState is within this union, it is defined as a BitField that consists of the least significant three bits (starts at 0 and ends at 3) of the 8-byte value.
'_EPROCESS' : [ 0x4d0, {
'Pcb' : [ 0x0, ['_KPROCESS']],
    'ProcessLock' : [ 0x160, ['_EX_PUSH_LOCK']],
    'CreateTime' : [ 0x168, ['_LARGE_INTEGER']],
    'ExitTime' : [ 0x170, ['_LARGE_INTEGER']],
    'RundownProtect' : [ 0x178, ['_EX_RUNDOWN_REF']],
    'UniqueProcessId' : [ 0x180, ['pointer64', ['void']]],
    'ActiveProcessLinks' : [ 0x188, ['_LIST_ENTRY']],
    'ProcessQuotaUsage' : [ 0x198, ['array', 2, ['unsigned long long']]],
    'ProcessQuotaPeak' : [ 0x1a8, ['array', 2, ['unsigned long long']]],
    'CommitCharge' : [ 0x1b8, ['unsigned long long']],
    'QuotaBlock' : [ 0x1c0, ['pointer64', ['_EPROCESS_QUOTA_BLOCK']]],
    'CpuQuotaBlock' : [ 0x1c8, ['pointer64', ['_PS_CPU_QUOTA_BLOCK']]],
    'PeakVirtualSize' : [ 0x1d0, ['unsigned long long']],
    'VirtualSize' : [ 0x1d8, ['unsigned long long']],
    'SessionProcessLinks' : [ 0x1e0, ['_LIST_ENTRY']],
    'DebugPort' : [ 0x1f0, ['pointer64', ['void']]],
'ExceptionPortData' : [ 0x1f8, ['pointer64', ['void']]],
    'ExceptionPortValue' : [ 0x1f8, ['unsigned long long']],
    'ExceptionPortState' : [ 0x1f8, ['BitField', dict(start_bit = 0, end_bit = 3,
          native_type='unsigned long long')]],
    'ObjectTable' : [ 0x200, ['pointer64', ['_HANDLE_TABLE']]],
[snip]
Generating VTypes
Despite the fact that working with VType syntax can be a fairly simple task once you practice, the sheer number of structures that an operating system or application uses makes it highly impractical to generate them all by hand. Furthermore, the structures can change drastically with each new version of an operating system, or even with just a new service pack or security update. To deal with these complexities, Brendan Dolan-Gavitt (http://www.cc.gatech.edu/grads/b/brendan/) designed a method of automatically generating VTypes from Microsoft’s debugging symbols (PDB files). In particular, he wrote a library named pdbparse (https://code.google.com/p/pdbparse) that can convert the proprietary, binary PDB file format into the open VType language that Volatility can understand.
Generally, you can find the core data structures that Volatility needs to support a Microsoft Windows release in the debugging symbols of the NT kernel module (ntoskrnl.exe, ntkrnlpa.exe, and so on). However, it is important to note that Microsoft does not divulge all the structures that its operating system needs—only the ones that could reasonably be seen to assist with debugging efforts. This excludes thousands of the structures involved in password management, security mechanisms, and other features of the system that are better left undocumented for fear that attackers would use the information in nefarious ways (i.e., to design exploits). In these cases, the generation of VTypes falls back into the manual realm: Developers or researchers must reverse engineer components of the operating system and create their own structure definitions that can be used with Volatility.
Overlays
Overlays enable you to fix up, or patch, the automatically generated structure definitions. This is an important aspect of memory forensics because operating system code often makes heavy use of void pointers (void *) in their structures. A void pointer is a pointer to data whose type is unknown or arbitrary at the time of the allocation. Unfortunately, debugging symbols don’t contain enough information to derive the types automatically, and you may need to follow, or dereference, these pointers during an analysis. Assuming that you determined the type for a given structure member (usually through reverse engineering or trial and error), you can apply an overlay, which will override the automated VType definition.
In the previous section, you had a structure named process with a void * ptv member. If you know that ptv is actually a pointer to another process structure, you could construct an overlay that looks like this:
'process' : [ None, {
    'ptv' : [ None, ['pointer', ['process']]],
}
Notice the two values of None, which are in the positions normally used to store the size of the structure and member offsets. The value of None indicates that no change is to be made to those parts of the definition. The only thing that this overlay is changing is the type of ptv from void * to process *. After applying such an overlay, when you access ptv in your Volatility plugins, the framework will know that you’re referencing a process structure.
Aside from providing the ability to make structure definitions more accurate, overlays also come in handy for convenience and consistency purposes. For example, Windows stores many of its timestamps in a structure called _LARGE_INTEGER. The structure contains two 32-bit integers (a low part and high part), which are combined to form a 64-bit timestamp value. The value of 1325230153, when translated, means 2011-12-30 07:29:13 UTC+0000. Many Volatility plugins need to report timestamps in this human-readable format. Thus, it makes sense to globally change structures that use _LARGE_INTEGER to store timestamp values into a special type that translates the value automatically.
Objects and Classes
A Volatility object (or just object for short) is an instance of a structure that exists at a specific address within an address space (AS). You won’t learn about ASs until later, so for now just consider an AS as an interface into your memory dump file (similar to a file handle). For example, you may create an object by instantiating an _EPROCESS structure at address 0x80dc1a70 of your memory dump. Once you create the object, usually through a call to Volatility’s obj.Object() API, you can access any of the underlying structure’s members to print their values, perform calculations based on their values, and so on.
An object class enables you to extend the functionality of an object. In other words, you can attach methods or properties to an object that then become accessible to all instances of the object. This is a great way to share code between plugins and it also facilitates the use of APIs within the framework. For example, if various plugins create _EPROCESS objects and they all commonly need to determine whether the process is suspicious, based on several factors, you can use an object class to add such logic. A simple example is shown in the following code:
import volatility.obj as obj

class _EPROCESS(obj.CType):
    """An object class for _EPROCESS"""

    def is_suspicious(self):
        """Determine if a process is suspicious
        based on several factors.

        :returns <bool>
        """

        # check the process name
        if self.ImageFileName == "fakeav.exe":
            return True

        # check the process ID
        if self.UniqueProcessId == 0x31337:
            return True

        # check the process path
        if "temp" in str(self.Peb.ProcessParameters.ImagePathName):
            return True

        return False
The displayed method checks a few different characteristics of the process—whether its name is fakeav.exe, its PID is 0x31337, or its full path on disk contains the temp substring. Although this is hardly a full audit of the process (you will learn more ways to analyze processes throughout the book), it at least shows you the general idea of attaching APIs to objects. Anywhere a process object is used in Volatility plugins, you can call process.is_suspicious() to invoke the check.
Profiles
A profile is a collection of the VTypes, overlays, and object classes for a specific operating system version and hardware architecture (x86, x64, ARM). In addition to these components, a profile also includes the following:
- Metadata: Data such as the operating system’s name (i.e., “windows”, “mac”, or “linux”), the kernel version, and build numbers
- System call information: Indexes and names of system calls
- Constant values: Global variables that can be found at hard-coded addresses in some operating systems
- Native types: Low-level types for native languages (usually C), including the sizes for integers, longs, and so on
- System map: Addresses of critical global variables and functions (Linux and Mac only)
Each profile has a unique name, which is usually derived from the operating system’s name, version, service pack, and architecture. For example, Win7SP1x64 is the name of the profile for a 64-bit Windows 7 Service Pack 1 system. Likewise, Win2012SP0x64 corresponds to 64-bit Windows Server 2012. The upcoming “Using Volatility” section tells you how to generate a full list of the supported profile names for your Volatility installation.
In addition to Windows, Volatility supports memory dumps from Linux, Mac, and Android. More information on how to build and integrate profiles for these systems can be found in Part III, “Linux Memory Forensics,” and Part IV, “Mac Memory Forensics.”
Address Spaces
An address space (AS) is an interface that provides flexible and consistent access to data in RAM, handles virtual-to-physical-address translation when necessary, and transparently accounts for differences in memory dump file formats (for example, the proprietary headers added to Microsoft crash dumps or the compression schemes used in hibernation files). Thus, an AS must have an intimate knowledge of memory layouts and storage methods in order to reconstruct the same “view” of memory that applications on a running machine would encounter.
Virtual/Paged Address Spaces
These ASs provide support for reconstructing virtual memory. They use many of the same algorithms that Intel and AMD processors use for address translation (see Chapter 1), so it’s possible to find data in an offline manner, independent from the target operating system from which the memory dump was acquired. An important aspect regarding virtual ASs is that they deal only with memory that is both allocated and accessible (i.e., not swapped to disk). A virtual AS contains the subset of memory that programs on a system can “see” at the time of the acquisition without producing a page fault to read swapped data back into RAM.
The virtual/paged category can further be broken down into kernel and process ASs. A kernel space provides a view of the memory that is allocated and accessible to device drivers and modules running in kernel mode. Alternately, a process AS provides a view of memory from the perspective of a specific process. As you learned in Chapter 1, because processes have private ASs, each process has its own view of user mode memory. Mapping back data found in a memory dump to the processes that were currently accessing it is a common investigative technique.
Physical Address Spaces
These ASs mainly deal with the various file formats that memory acquisition tools use to store physical memory. The simplest format is just a raw memory dump (which has neither proprietary headers nor compression). However, this category also includes crash dumps, hibernation files, and VM snapshots (such as VMware saved state and VirtualBox core dumps) that may in fact store vendor-specific metadata along with the actual memory from the target machine. In contrast with the virtual ASs, the physical ones often contain memory ranges that the operating system has marked as freed or de-allocated, allowing you to find residual (or historical) artifacts of behaviors that executed sometime in the past.
Address Space Stacking
The few different categories of ASs that you have learned about so far are most often used together in support of each other. To help you visualize this interaction, take a look at Figure 3-1. This diagram shows how ASs automatically stack over each other to support the wide range of file types and hardware architectures that Volatility can work with.
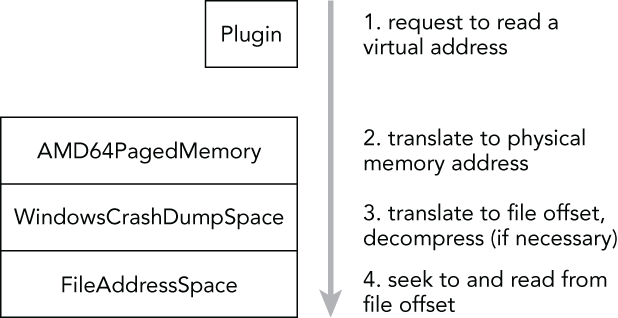
Figure 3-1: Volatility uses a stacked AS
In this example, you are dealing with a crash dump from a 64-bit Windows system. When a Volatility plugin requests to read a virtual address, the address is first passed to the AMD64 AS, which performs the virtual-to-physical-address translation. The result is an offset in physical memory in which the desired data can be found. If you have a raw memory dump (with padding), this offset is the same as an offset into the memory dump file. However, because a crash dump file contains various headers and may also divide noncontiguous memory ranges into “runs,” an offset into physical memory is not the same as an offset into a crash dump file. This is where the crash dump AS comes into play. The crash dump AS knows how big its headers are and can parse the information related to where the memory ranges are stored, which allows it to piece back together the original view of physical memory. Thus, the crash dump AS can easily find the requested offset in the underlying file.
Plugin System
Plugins enable you to expand upon the existing Volatility Framework. For example, an address space plugin can introduce support for operating systems that run on new CPU chipsets. Analysis plugins are written to find and analyze specific components of the operating system, user applications, or even malicious code samples. Regardless of which type of plugin you write, there are APIs and templates provided by the framework that make it relatively easy to design and integrate your ideas.
To develop an analysis plugin, you create a Python class that inherits from commands.Command and overrides a few of the base methods. Specifically, the two main functions you’ll customize are calculate (where the bulk of your plugin’s work goes) and render_text (where you format the results for text-based output). In short, the code in calculate is responsible for finding and analyzing objects in memory. The results of the calculation are passed to render_text for display on the terminal. The following code shows the bare minimum analysis plugin, which just prints the names of all processes on the system. The name of this plugin is derived from the name of the class (ExamplePlugin).
import volatility.utils as utils
import volatility.commands as commands
import volatility.win32.tasks as tasks

class ExamplePlugin(commands.Command):
    """This is an example plugin"""

    def calculate(self):
        """This method performs the work"""

        addr_space = utils.load_as(self._config)
        for proc in tasks.pslist(addr_space):
            yield proc

    def render_text(self, outfd, data):
        """This method formats output to the terminal.

        :param outfd    | <file>
               data     | <generator>
        """
        for proc in data:
            outfd.write("Process: {0}
".format(proc.ImageFileName))
To execute the plugin, move the Python file containing this code into the volatility/plugins directory (or any subdirectory therein) and it’s automatically picked up and registered by the plugin system.
Core Plugins
The core Volatility Framework includes over 200 analysis plugins. For the sake of brevity, we won’t list them all here, but it is important that you skim over the names and descriptions so you will know from a birds-eye view which capabilities you might want to start exploring once you dive in. You can also list the available plugins in your version of Volatility any time by using the vol.py --info command.
Using Volatility
Now that you know a bit about Volatility, you can begin to explore the command line usage. In this section, you’ll learn the basic structure of a command, how to display help, and how to fine-tune your environment.
Basic Commands
The most basic Volatility command is constructed as follows. You execute the main Python script (vol.py) and then pass it the path to your memory dump file, the name of the profile, and the plugin to execute (and optionally plugin-specific parameters):
$ python vol.py –f <FILENAME> --profile=<PROFILE> <PLUGIN> [ARGS]Here’s an example:
$ python vol.py –f /home/mike/memory.dmp --profile=Win7SP1x64 pslistIf you use the standalone Windows executable, the syntax would look like this instead:
C:>volatlity-2.4.exe –f C:UsersMikememory.dmp --profile=Win7SP1x64 pslistThere are a few exceptions to the basic command shown, such as when you call Volatility with -h/--help (to see global options), with --info (to see all available ASs, plugins, and profiles), or if you don’t yet know what profile to use.
Displaying Help
Several command line options are global in scope (i.e., they apply to all plugins). If you are new to Volatility or if you just want to become more familiar with what preferences you can tweak, make sure to read this section carefully.
To display the main help menu, pass –h/--help on the command line. It shows the global options (including default values, if applicable) and lists the plugins available to the currently specified profile. If you do not specify a profile, you’ll be working with the default, WinXPSP2x86, so you’ll see only plugins that are valid for that operating system and architecture (for example, you won’t see Linux plugins or Windows plugins that work only on Vista). Here is an example:
$ python vol.py --help
Volatility Foundation Volatility Framework 2.4
Usage: Volatility - A memory forensics analysis platform.

Options:
  -h, --help            list all available options and their default values.
                        Default values may be set in the configuration file
                        (/etc/volatilityrc)
  --conf-file=/Users/michaelligh/.volatilityrc
                        User based configuration file
  -d, --debug           Debug volatility
  --plugins=PLUGINS     Additional plugin directories to use (colon separated)
  --info                Print information about all registered objects
  --cache-directory=/Users/michaelligh/.cache/volatility
                        Directory where cache files are stored
  --cache               Use caching
  --tz=TZ               Sets the timezone for displaying timestamps
  -f FILENAME, --filename=FILENAME
                        Filename to use when opening an image
  --profile=WinXPSP2x86
                        Name of the profile to load
  -l LOCATION, --location=LOCATION
                        A URN location from which to load an address space
  -w, --write           Enable write support
  --dtb=DTB             DTB Address
  --output=text         Output in this format (format support is module
                        specific)
  --output-file=OUTPUT_FILE
                        write output in this file
  -v, --verbose         Verbose information
  --shift=SHIFT         Mac KASLR shift address
  -g KDBG, --kdbg=KDBG  Specify a specific KDBG virtual address
  -k KPCR, --kpcr=KPCR  Specify a specific KPCR address

        Supported Plugin Commands:

               apihooks     Detect API hooks in process and kernel memory
               atoms        Print session and window station atom tables
               atomscan     Pool scanner for _RTL_ATOM_TABLE
        [snip]
Volatility plugins can also register their own options, which you can view by supplying both the plugin name and -h/--help. The following command shows the options for the handles plugin:
$ python vol.py handles --help
Volatility Foundation Volatility Framework 2.4
Usage: Volatility - A memory forensics analysis platform.

[snip]

  -o OFFSET, --offset=OFFSET
                        EPROCESS offset (in hex) in the physical address space
  -p PID, --pid=PID     Operate on these Process IDs (comma-separated)
  -P, --physical-offset
                        Physical Offset
  -t OBJECT_TYPE, --object-type=OBJECT_TYPE
                        Show these object types (comma-separated)
  -s, --silent          Suppress less meaningful results

---------------------------------
Module Handles
---------------------------------
Print list of open handles for each process
Selecting a Profile
One of the options from the global help menu that you will use most frequently is --profile. This option tells Volatility what type of system your memory dump came from, so it knows which data structures, algorithms, and symbols to use. A default profile of WinXPSP2x86 is set internally, so if you’re analyzing a Windows XP SP2 x86 memory dump, you do not need to supply --profile at all. Otherwise, you must specify the proper profile name.
In some cases, you won’t know the profile ahead of time; for example, another investigator might acquire memory and not tell you the operating system version. Volatility includes two plugins that can help you determine the proper profile if that happens. The first is imageinfo, which provides a high-level summary of the memory sample you’re analyzing. An example of this command follows:
$ python vol.py -f memory.raw imageinfo
Volatility Foundation Volatility Framework 2.4
Determining profile based on KDBG search...

          Suggested Profile(s) : Win7SP0x64, Win7SP1x64, Win2008R2SP0x64
                     AS Layer1 : AMD64PagedMemory (Kernel AS)
                     AS Layer2 : FileAddressSpace (/Users/Michael/Desktop/memory.raw)
                      PAE type : PAE
                           DTB : 0x187000L
                          KDBG : 0xf80002803070
          Number of Processors : 1
     Image Type (Service Pack) : 0
                KPCR for CPU 0 : 0xfffff80002804d00L
             KUSER_SHARED_DATA : 0xfffff78000000000L
           Image date and time : 2012-02-22 11:29:02 UTC+0000
Image local date and time : 2012-02-22 03:29:02 -0800You may notice that multiple profiles are suggested because the identified operating systems share many features that can make them appear very similar. The logic that imageinfo uses to guess profiles is actually based on the functionality provided by the second plugin, kdbgscan. The name of the plugin gives you an idea of how the potential profiles are guessed: It finds and analyzes characteristics of the kernel debugger data block (_KDDEBUGGER_DATA64).
The debugger data structure is typically located inside the NT kernel module (nt!KdDebuggerDataBlock). It contains a build string such as 3790.srv03_sp2_rtm.070216-1710, numerical values that indicate the major and minor build numbers, and the service pack level for the target operating system. An example of this plugin’s output follows:
$ python vol.py -f memory.raw kdbgscan
Volatility Foundation Volatility Framework 2.4
**************************************************
Offset (V)                    : 0xf80002803070
Offset (P)                    : 0x2803070
KDBG owner tag check          : True
Profile suggestion (KDBGHeader): Win7SP0x64
Version64                     : 0xf80002803030 (Major: 15, Minor: 7600)
Service Pack (CmNtCSDVersion) : 0
Build string (NtBuildLab)     : 7600.16385.amd64fre.win7_rtm.090
PsActiveProcessHead           : 0xfffff80002839b30 (32 processes)
PsLoadedModuleList            : 0xfffff80002857e50 (133 modules)
KernelBase                    : 0xfffff8000261a000 (Matches MZ: True)
Major (OptionalHeader)        : 6
Minor (OptionalHeader)        : 1
KPCR                          : 0xfffff80002804d00 (CPU 0)
As you can see, all signs seem to indicate that this memory.raw file is from a 64-bit Windows 7 Service Pack 0 machine. Thus, you can now supply --profile=Win7SP0x64 when running other plugins. Because the debugger data block also contains pointers to the start of the active process and loaded module lists, the kdbgscan plugin can tell you how many items are in each list. In this case, there are 32 processes and 133 modules. These values can help you distinguish between cases where a “stale” debugger data block is found (discussed next in the issues section).
Issues with Profile Selection
Volatility scans for the _KDDEBUGGER_DATA64 by looking for constant values embedded in the structure, including the hard-coded 4-byte signature of KDBG. These signatures are not critical for the operating system to function properly, thus malware running in the kernel can overwrite them in attempt to throw off tools that rely on finding the signature. Other memory forensics tools look at the compile date/time in the NT kernel module’s PE header, which is also nonessential and subject to malicious tampering. This is why Volatility provides a --profile option in the first place: If automated OS detection fails (due to intentional or accidental modifications), you can manually override.
Additionally, in some cases there may be more than one _KDDEBUGGER_DATA64 structure resident in physical memory. This can happen if the target system hasn’t rebooted since applying a hot patch that updated some kernel files, or if the machine rebooted so quickly that the entire contents of RAM was not flushed (thus you pick up residual structures, similar to how a cold book attack works). Finding multiple debugger data structures can lead to incorrect process and module listings, so it is important to be aware of this possibility.
Notice in the following command that kdbgscan picks up two structures:
- An invalid one (with 0 processes and 0 modules) found at address
0xf80001172cb0 - A valid one (with 37 processes and 116 modules) found at address
0xf80001175cf0$ python vol.py -f Win2K3SP2x64.vmem --profile=Win2003SP2x64 kdbgscan Volatility Foundation Volatility Framework 2.4 ************************************************** Instantiating KDBG using: Kernel AS Win2003SP2x64 (5.2.3791 64bit) Offset (V) : 0xf80001172cb0 Offset (P) : 0x1172cb0 KDBG owner tag check : True Profile suggestion (KDBGHeader): Win2003SP2x64 Version64 : 0xf80001172c70 (Major: 15, Minor: 3790) Service Pack (CmNtCSDVersion) : 0 Build string (NtBuildLab) : T? PsActiveProcessHead : 0xfffff800011947f0 (0 processes) PsLoadedModuleList : 0xfffff80001197ac0 (0 modules) KernelBase : 0xfffff80001000000 (Matches MZ: True) Major (OptionalHeader) : 5 Minor (OptionalHeader) : 2 ************************************************** Instantiating KDBG using: Kernel AS Win2003SP2x64 (5.2.3791 64bit) Offset (V) : 0xf80001175cf0 Offset (P) : 0x1175cf0 KDBG owner tag check : True Profile suggestion (KDBGHeader): Win2003SP2x64 Version64 : 0xf80001175cb0 (Major: 15, Minor: 3790) Service Pack (CmNtCSDVersion) : 2 Build string (NtBuildLab) : 3790.srv03_sp2_rtm.070216-1710 PsActiveProcessHead : 0xfffff800011977f0 (37 processes) PsLoadedModuleList : 0xfffff8000119aae0 (116 modules) KernelBase : 0xfffff80001000000 (Matches MZ: True) Major (OptionalHeader) : 5 Minor (OptionalHeader) : 2 KPCR : 0xfffff80001177000 (CPU 0)
As previously mentioned, many Volatility plugins rely on finding the debugger data block and then walking the active process and loaded module lists. By default, these plugins accept the first debugger structure they find via scanning; however, as you just witnessed, the first choice is not always the best choice. In these cases, after manually verifying the more accurate value with kdbgscan, you can set the global option --kdbg=0xf80001175cf0. This not only ensures that Volatility uses the correct value but it also saves you time when executing multiple commands because there is no longer a need to perform a scan.
Alternatives to Command-Line Options
If you’re about to enter a lengthy engagement and don’t want to type the path to your memory dump, the profile name, and other options each time, you can take a few shortcuts. Volatility can search environment variables and configuration files (in that order) for options if they are not supplied on the command line. That means you can set options once and reuse them throughout an investigation, which is a big time-saver.
On a Linux or Mac analysis system, you can set options by exporting them in your shell, as shown here:
$ export VOLATILITY_PROFILE=Win7SP0x86
$ export VOLATILITY_LOCATION=file:///tmp/myimage.img
$ python vol.py pslist
$ python vol.py files
A few important points you should note about setting options this way:
- Naming convention: You should name your environment variables according to the original option, but prefixed with
VOLATILITY. For example, instead of setting--profileon the command line, the equivalent environment variable isVOLATILITY_PROFILE. - Location versus filename: When setting the path to your memory dump file, use
VOLATILITY_LOCATIONand be sure to prefix the path withfile:///(even if you’re performing the analysis on a Windows machine). - Persistence: The environment variables you set this way are valid only while your current shell is open. Once you close it, or if you open another shell, you must reset the variables. Alternately, you can add the variables to your
~/.bashrcfile or/etc/profile(this may vary depending on your OS) so they can initialize with each shell.
Using configuration files is equally as easy. By default, Volatility looks for a file named .volatilityrc in the current directory or ~/.volatilityrc (in your user’s home directory), or in a path specified using the --conf-file option. The configuration file uses the standard INI format. Make sure that you have a section named DEFAULT, followed by the options you want to set. The options in this case are not prefixed with VOLATILITY.
[DEFAULT]
PROFILE=Win7SP0x86
LOCATION=file:///tmp/myimage.img
Once you set these options using either method described in this section, you can use Volatility plugins such as python vol.py pslist, and you do not have to worry about typing the rest of the options.
Controlling Plugin Output
By default, plugins generate text-based results and write them to standard output, which is usually your terminal. However, some plugins can generate very verbose output, making it difficult for you to scan back through the results—especially if they scroll fast and your terminal saves only the last 50 or 100 lines. Thus, redirecting output to a text file that you can review at a later time is a common practice. There are a few ways to do this, as shown by the following commands:
$ python vol.py pslist > pslist.txt
$ python vol.py pslist --output-file=pslist.txt
The first command simply uses the terminal’s redirection capability, and the second one uses Volatility’s --output-file option. Both generate a text file with the results from the pslist plugin. The only reason we mention both techniques is because it leads to the discussion of requesting output in a format different from a text-based format. You can do this on a per-plugin basis, provided that the plugins support other output modes. For example, the mftparser plugin can show results in the popular body format (http://wiki.sleuthkit.org/index.php?title=Body_file) if you call it with the --output=body option. Another example is the impscan plugin, which you can call with --output=idc to generate output in the IDA Pro scripting language. In the future, plugins may globally support outputting data in JSON, XML, CSV, HTML, or other formats.
Summary
The Volatility Framework is the result of years worth of research and development from tens, if not hundreds, of members of the open source forensics community. The framework provides the capabilities to solve complex digital crimes involving malware, intelligent threat actors, and the typical white- and blue-collar offenses. Now that you know how to install and configure Volatility, you’re ready to begin capturing memory samples and analyzing them. The advanced analysis techniques and implementations presented later in the book will allow you to use the software to your full potential. If the need arises, you also have gained a familiarity with the Volatility internals (such as profiles, plugins, and address spaces), which will help you to develop your own extensions and customizations.