
Chapter 4
Memory Acquisition
Memory acquisition (i.e., capturing, dumping, sampling) involves copying the contents of volatile memory to non-volatile storage. This is arguably one of the most important and precarious steps in the memory forensics process. Unfortunately, many analysts blindly trust acquisition tools without stopping to consider how those tools work or the types of problems they might encounter. As a result, they end up with corrupt memory images, destroyed evidence, and limited, if any, analysis capabilities. Although this chapter focuses on Windows memory acquisition, many of the concepts apply to other operating systems. You’ll also find Linux and Mac OS X–specific discussions in their respective chapters.
Preserving the Digital Environment
Although the main focus of this book is analyzing the data stored in volatile memory, the success of that analysis often depends at the outset on the acquisition phase of the investigation. During this phase, the investigator must make important decisions about which data to collect and the best method for collecting that data. Fundamentally, memory acquisition is the procedure of copying the contents of physical memory to another storage device for preservation. This chapter highlights the important issues associated with accessing the data stored in physical memory and the considerations associated with writing the data to its destination. The particular methods and tools you use often depends on the goals of the investigation and the characteristics of the system you are investigating.
A digital investigator seeks to preserve the state of the digital environment in a manner that allows the investigator to reach reliable inferences through analysis. The data stored on disk and in RAM provide two of the most important components of that environment. Traditional views of digital investigation focused on the assumption that the reliability of the inferences was entirely dependent on acquiring evidence without changing its state. For example, the commonly accepted evidence handling procedures involved powering off a system and making a duplicate copy (imaging) of the data on the disk storage device for offline analysis. These acquisition processes and procedures focused on minimizing the distortion to the file system data at the expense of destroying the other data sources (i.e., RAM, device memory), which also help compose the digital environment.
As the digital investigation field has evolved, it has become obvious that the selective preservation of some evidence at the expense of other equally important evidence may also impact the reliability of the derived inferences. This is particularly important when malicious actors seek to exploit the limitations of traditional digital forensic evidence-gathering techniques. By correlating data from multiple sources (disk, network, memory, etc.) within the digital environment, you can often get a better understanding of what happened on the system than the limited perspective that the contents of disk storage provides alone. In order to include these alternate sources, you must accept that all acquisition methods, including traditional disk acquisition procedures, will result in some distortion to the digital environment. Investigators must be aware of how those distortions could impact their analysis and the order that they must collect the data to reduce that impact. The course of action is often prioritized based on the order of decreasing volatility (i.e., evidence that changes more rapidly is acquired before evidence that is more stable). As a practical matter, this means that volatile memory evidence needs to be acquired first.
For example, in most situations you cannot create a conventional notion of an “image” of physical memory if the runtime state of the machine changes while you acquire memory. A more appropriate description of “imaging memory” is a sampling of the state of physical memory at a given point in time. Theoretically, it might be possible to refer to the acquisition of discrete units of memory (pages), as “imaging” those pages but the state of physical memory as a whole cannot be directly measured and must be inferred from the state of these individual samples. Although the process of acquiring a sample of physical memory may add uncertainty in the collection phase, the additional information it yields might result in greater confidence in the investigator’s analysis and less distortion of the actual facts of the investigation.
Acquisition Overview
As previously mentioned, memory acquisition is not a trivial task. You’ll need a versatile tool set and the ability to adapt your techniques based on the specifics of each case and the environments that you encounter. Figure 4-1 shows a relatively simplistic decision tree based on some, but certainly not all, of the common factors you’ll encounter in the field. For example, one of the first questions you’ll need to ask is whether the target system(s) is a virtual machine (VM). This can have a huge impact on your methodologies, because if the target is a VM, you may have options for acquiring memory-using capabilities that the hypervisor provides for pausing, suspending, taking a snapshot, or using introspection. However, it is important to be familiar with the different virtualization platforms and their respective capabilities because some products require special steps and store VM memory in proprietary formats.

Figure 4-1: A diagram of some of the initial factors you’ll need to consider before acquiring memory
If the target system is “bare metal,” such as a laptop, desktop, or server, you need to determine whether it is currently running (remember that the machine might not always be in your physical possession). If it’s hibernating or powered down, the current state of memory is not volatile. But, in many cases, recent volatile data may have been written to more persistent storage devices such as the hard disk. These alternate sources of data include hibernation files, page files, and crash dumps. Acquiring memory from non-volatile sources entails booting the target system(s) with a live CD/DVD/USB to access its disk or making a forensic duplication of the disk image and mounting it (read-only) from your analysis workstation.
A running system provides the opportunity to acquire the current state of volatile memory but you’ll need administrator-level privileges. If a suspect or victim is already logged on with an admin account, or if they’re cooperating with your investigation (such as to provide the proper credentials) you’re in luck. You also might have admin access due to your status as an investigator (credentials were provided to you by the backing corporation). In these scenarios, you can use a software-based utility, which we’ll describe shortly. Otherwise, the options are not so straightforward. It might be possible to gain admin access through a privilege escalation exploit (an offensive tactic that may invalidate the forensic soundness of your evidence) or by brute force password guessing.
Another option is hardware-assisted acquisition. In this case, you do not need credentials for the target system(s)—physical access suffices. You’ll rely on Direct Memory Access (DMA) using a technology such as Firewire, Thunderbolt, ExpressCard, or PCI. The downside to this method is that unless the target machine is already equipped with a device (or if it supports hot swapping devices), you have to power down the target system to install the required hardware adaptors (and doing so destroys your volatile evidence). Other disadvantages include the fact that Firewire only permits acquisition of the first 4GB of RAM, which can severely limit your success for large-memory systems. Additionally, PCI devices for memory acquisition are extremely rare, so they’re also quite expensive. In fact, we currently know only one product that’s commercially available and costs about $8,000 USD (WindowsSCOPE).
When the factors lead you in the direction of software-based acquisition, you still have many decisions to make. Consider the following points:
- Remote versus local: Do you (or a fellow investigator) have physical access to the target system(s)? A case can quickly become complicated if the computer is located in another state or country. Also, you might encounter situations in which the target is a server with no keyboard or monitor attached, sitting in a security or network operations center. In these situations, remote acquisition (over the network) might be your only option.
- Cost: Do you have budgetary restrictions on the acquisition software you can buy? Obviously, the restriction will affect which tools are available to you.
- Format: Do you require memory in a specific file format? Later in the chapter, we’ll describe how many analysis tools have limitations on the formats they support. However, you can always convert between formats if you initially capture memory in a format that’s incompatible with your desired analysis tool(s).
- CLI versus GUI: Do you prefer command-line or graphical user interface (GUI) tools? There is a common bias that GUI tools leave a larger footprint on the target and have a larger attack surface area, so they’re bad for forensic acquisitions. However, a well-written GUI produces far less noise than a poorly written command-line tool. Also, you might not have console access or Virtual Network Computing (VNC)/Remote Desktop Protocol (RDP) services on which to run GUI applications.
- Acquisition versus runtime interrogation: Do you need a full physical memory dump or just the ability to determine the running processes, network connections, and so on? Do you need to continuously poll the system for changes? In corporate environments with hundreds or thousands of systems, it’s not practical to acquire full memory dumps just to check for the existence of a particular indicator. Instead, you can perform a quick sweep throughout the enterprise, checking a few specific areas of memory on each machine.
We’re often asked this question—what tool should I use for acquiring memory? There’s really no clear-cut answer. The right tool for a particular job depends on the job. After you determine the specifics of the case, you can focus on selecting a tool that best supports your goals. Later in the chapter we present some specific precautions you should take when performing acquisitions.
The Risk of Acquisition
Before you acquire physical memory from a suspect system, you should always consider the associated risk. Because most OSs do not provide a supported native mechanism for acquiring physical memory, you’ll use the system in a manner that might leave it in an unexpected state. In addition, a system with poorly written malware can be unstable and may behave in an unpredictable way. The decision to acquire physical memory requires you to balance the benefit of acquiring the data against the inherent risk(s) associated with the acquisition procedure. For example, if the target is a mission-critical system that can be shut down or rebooted only in extreme circumstances, you must be prepared to justify why acquiring memory is vital to your investigation. There may even be circumstances in which the consequences (i.e., death, environmental damage) of destabilizing a system are never worth the risk.
The following sections describe some of the major reasons why memory acquisition can lead to system instabilities and evidence corruption. It is important to note that although we use Microsoft Windows in the following examples, the problems are not specific to any OS—they are functions of the processor and hardware architecture.
Atomicity
An atomic operation is one that appears (to the rest of the system) to complete instantaneously, without interruption from concurrent processes. Memory acquisition is not an atomic operation, because the contents of RAM are constantly changing, even on an idle system and especially during the acquisition process. As Dan Farmer and Wietse Venema wrote “Memory […] can change so rapidly that recording even the bulk of those fluctuations in an accurate and timely fashion is not possible without dramatically disturbing the operation of a typical computer system” (see Forensic Discovery). Thus, it’s inevitable that your acquisition tool will alter the system (in ways that should be documented). During acquisition, other processes are writing memory, the kernel is adding/removing linked-list elements, network connections are being initiated or torn down, and so on.
In the best case, you’ll acquire evidence that can help you infer the current state of the system, and to some degree the past activities that were performed recently. Note, however, that the current state could be the time when the acquisition started, when it ended, or at any moment in between—depending on the order in which the physical memory pages, containing the data in question, were collected. In the worst case, you’ll end up with a corrupted memory dump that analysis tools cannot process, because the capture of particular page(s) occurred after a critical operation began but before it finished.
Device Memory
Physical memory is a logical addressing scheme that permits disparate motherboard resources to be accessed (or “addressed”) in a uniform manner. On x86/x64–based computers, the firmware (BIOS) provides a physical memory map to the OS with different regions marked as reserved for use by the firmware, by the ISA or PCI busses, or by various motherboard devices. These regions are henceforth referred to as device-memory regions.
Figure 4-2 shows a simplified diagram of the physical memory layout, when you consider these “holes” that exist due to device-memory regions. On 32-bit systems with less than 4GB of memory, the “holes” cause the total amount of memory available to the OS to be slightly less than the advertised capacity of the RAM chips (this is known as the “32–bit client effective memory limit”). For more information, see Pushing the Limits of Windows: Physical Memory by Mark Russinovich (http://blogs.technet.com/b/markrussinovich/archive/2008/07/21/3092070.aspx). Notice how the MmGetPhysicalMemoryRanges function omits the ranges of physical memory that are reserved by devices. In other words, using this API avoids the device-memory regions.
Inadvertently reading from one of these reserved regions can be dangerous. Depending on the nature of the device you access, reading from a physical address within the region may obtain data stored at that location or alter the state of the device you’re accessing. There are, for example, physical addresses that are mapped to device registers that change the state of the device each time the physical location is read. This change might confuse device drivers or firmware that depend on the values in those registers, ultimately causing the system to freeze. This freezing or hanging is especially common when addresses occupied by the video chipset, High Precision Event Timer (HPET), or obscure, legacy PCI devices are read. As an additional challenge, most of these devices are not designed to accommodate simultaneous access from more than one processor at a time.
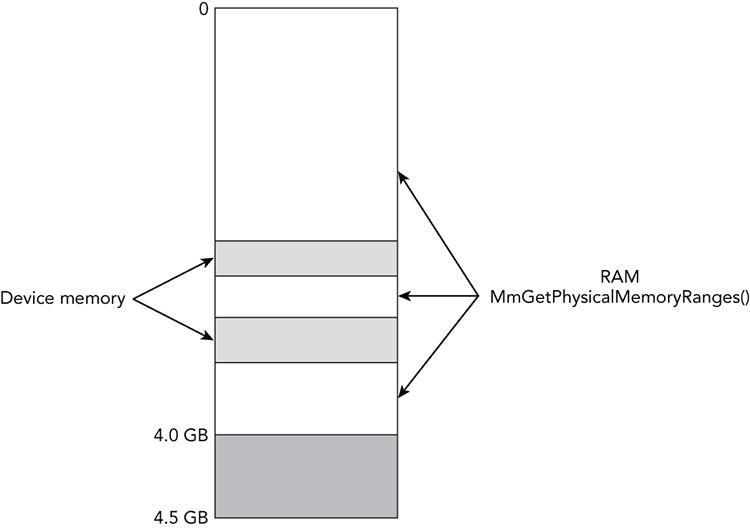
Figure 4-2: The physical memory layout for an x86/x64 compatible system shows various holes due to device-memory regions
Despite the risk involved in acquiring device-memory regions, doing so can yield evidence with high forensic value. For example, data in these regions might contain the real mode interrupt vector table (IVT) with artifacts left by firmware-based rootkits. You can also find evidence of BIOS rootkits that inject code at the top of real mode memory. Additionally, you can use the CMOS region to change the boot order and the IOAPIC indirect access registers to re-route interrupts. Of the software-based memory acquisition tools discussed later in the chapter, only KnTDD from GMG Systems can acquire these regions with a reasonable level of reliability and accuracy.
Cache Coherency
Modern processors are designed with one or more internal memory caches to improve performance. A page table entry may be programmed with different memory cache attributes (non-cached, cached, write-combined) that determine the way in which the processor accesses a physical memory page. These processors have a documented design limitation: They are not designed to accommodate the simultaneous mapping of the same physical address with multiple cache attributes. Doing so might lead to undefined behavior on the part of the processor, including but not limited to translation lookaside buffer (TLB) corruption and corruption of the data at the specified memory address. Thus, a poorly written acquisition tool can easily invalidate the very memory being acquired. See Intel® 64 and IA-32 Architectures Developer’s Manual, Vol. 3A § 11.12.4.
Cache coherency is one of the major reasons why Microsoft cautions Windows driver developers not to map physical pages unless their driver has directly allocated the memory through an API that guarantees no other system component has mapped the same memory range with a different caching type (http://msdn.microsoft.com/en-us/library/windows/hardware/ff566481%28v=vs.85%29.aspx). A common misconception is that acquisition tools are protected against cache conflicts if they use ZwMapViewOfSection to map physical pages from DevicePhysicalMemory. Although this might be true for some versions of Windows, it doesn’t apply to all releases; nor does it prevent cache conflicts when mapping memory pages that are not currently allocated.
In Windows 2000, the API allowed conflicting cache attributes to be specified (see http://ntsecurity.nu/onmymind/2006/2006-06-01.html). Starting with Windows XP, the API performs a comparison of the requested and existing attributes and fails harmlessly by returning a STATUS_CONFLICTING_ADDRESSES error if there is a mismatch. However, starting with Windows 7 and 2008 R2, this error is no longer generated. Current versions of Windows silently substitute the cache attributes that are stored in the PFN database, even if the target page is not currently allocated and values in the corresponding PFN database entry are no longer valid.
When to Acquire Memory
Choosing the proper time to gather physical memory evidence depends on a number of factors. The following points are merely suggestions, not rules. For example, if you are collecting evidence from a suspect’s computer you might want to plan your acquisition so that the suspect is online (or at least logged in) at the time, which can give you access to the suspect’s logon session, information about cloud services or remote storage to which they might have access, and any encrypted documents that the suspect might have been viewing. On the other hand, if you are gathering evidence from a victim’s computer, you might want to time your acquisition when the suspect is not active to avoid tipping off the suspect. Collecting network session data to and from the victim computer for some time prior to the acquisition can help you make this determination.
Remember that, in most cases, you are collecting evidence from a running computer system. Increasing the amount of change that occurs while you collect memory evidence might increase the number of anomalies you encounter when you analyze the evidence. If possible, avoid collecting memory evidence during periods of dramatic change such as during system startup, shutdown, or while system maintenance tasks are running (i.e., disk defragmentation, full virus scans, system backups). It is also recommended to limit your interaction with the machine until the acquisition has completed.
How to Acquire Memory
After you determined an opportune time to acquire memory, you still have a number of important precautions to consider. This section focuses on the most common-use cases and their associated caveats, which can quickly turn into major blowbacks if you’re not careful.
Local Acquisition to Removable Media
In this case, you’re dumping memory to an external USB, ESATA, or Firewire drive connected to the target system. It is never recommended to dump memory to the target system’s local drives, such as the C: partition, because this will overwrite a significant amount of evidence that may be relevant to your case (i.e., slack space). Due to the size of RAM on modern computers, you’ll want to ensure the destination drive is formatted with NTFS or other high-performance file system. Also, be aware that malware often spreads by infecting external media. The following points provide additional advice for local acquisitions:
- Never attach the same removable media to more than one possibly infected computer to avoid spreading the infection while you are gathering evidence.
- Do not plug possibly infected removable media directly into your forensic workstation. Connect the media to an intermediate “sacrificial” system and inspect it. Then copy the evidence to your forensic workstation over a small, isolated network (e.g., across a hub or non-managed switch).
- Always forensically “sterilize” (securely erase) removable media before using (or re-using) it to acquire evidence.
Remote Acquisition
In a primitive remote acquisition scenario, you typically push tools over the network to the target machine via PsExec (http://technet.microsoft.com/en-us/sysinternals/bb897553.aspx) or by copying them to a C$ or ADMIN$ share via Server Message Block (SMB). You can then schedule a task or install a service on the target system that runs the tool(s) and sends the contents of physical memory back to you via a netcat listener or other connect-back protocol. The major issues with this method are the exposure of administrator credentials and the contents of the target system’s RAM being sent in plain text over the network. Main computer memory contains a lot of sensitive information that might be disclosed when acquired in plain text over an open network.
In domain or enterprise environments, domain admin credentials provide a convenient way to access the target system; however, if the target computer is already compromised, the attackers may recover the generated authentication tokens from memory for use in Pass the Hash attacks (http://www.microsoft.com/security/sir/strategy/default.aspx#!password_hashes). A better solution is to create a temporary admin account that only permits access to the target system. Then, disable the temporary admin account after acquisition is complete and audit subsequent attempts to use the credentials. You can also look into blocking connections from the target machine in the firewall or router (except to/from the systems involved in the remote acquisition). This prevents any malware or attackers from using the stolen credentials to further infiltrate the network.
Acquisition to a network share should be used only as a last resort but may be necessary in some limited cases. Starting with SMB 3.0 (Windows Server 2012), end-to-end encryption is supported. Also, some tools (e.g., CryptCat, KnTDD, F-Response Enterprise) support acquisition of evidence over the network using SSL/TLS. You might also consider compressing the evidence before transferring it over the network to reduce the required time and bandwidth. Remember to compute integrity hashes before and after the transfer, to ensure your evidence didn’t change during the transmission.
Runtime Interrogation
Runtime interrogation enables you to quickly sweep across an entire enterprise and check for specific indicators in physical memory (instead of capturing a full memory dump from each system). You typically execute this type of analysis in an automated capacity. Various commercial suites provide enterprise-level capabilities for interrogating physical memory, such as F-Response, AccessData Enterprise, and EnCase Enterprise.
Hardware Acquisition
Due to the limitations mentioned earlier, this book doesn’t cover hardware-based acquisitions in depth. However, it’s worth mentioning that Volatility does support acquisition and interrogation of memory over Firewire. You’ll need the libforensic1394 library (https://freddie.witherden.org/tools/libforensic1394), the JuJu Firewire stack, and a special invocation of Volatility. Note the -l instead of -f parameter:
$ python vol.py –l firewire://forensic1394/<devno> plugin [options]The <devno> is the device number (typically 0 if you’re only connected to one Firewire device). Use the imagecopy plugin to acquire memory or any other analysis plugin to interrogate the running system, but be aware of the 4GB limit discussed previously.
Another use case for hardware-based memory analysis includes unlocking workstations. For example, the Inception tool by Carsten Maartmann-Moe (http://www.breaknenter.org/projects/inception) finds and patches instructions that allow you to log into password-protected Windows, Linux, and Mac OS X computers even without the credentials. However, as stated on the tool’s website, if the required instructions aren’t found in the lower 4GB of memory, it might not work reliably.
Software Tools
All software-based acquisition tools follow a similar protocol to acquire memory. In particular, these tools work by loading a kernel module that maps the desired physical addresses into the virtual address space of a task running on the system. At this point, they can access the data from the virtual address space and write it to the requested non-volatile storage. Acquisition software has two ways to make this virtual-to-physical address mapping occur:
- The approach that most, if not all, commercially available tools utilize involves using an operating system API to create a page table entry. The typical functions include:
ZwMapViewOfSection(onDevicePhysicalMemory),MmMapIoSpace,MmMapLockedPagesSpecifyCache, andMmMapMemoryDumpMdl. - A second possible approach uses other OS APIs to allocate an empty page table entry and manually encode the desired physical page into the page table entry.
There are substantial risks associated with either approach. For example, the aforementioned APIs for mapping physical to virtual memory all have a common limitation in that none of them are intended for mapping pages that a driver does not own. In other words, an acquisition tool isn’t more stable than others just because it uses MmMapIoSpace instead of MmMapMemoryDumpMdl (for example). One difference of memory management APIs is that certain APIs (e.g., ZwMapViewOfSection) map the specified physical address into the user mode address space of the acquisition application (where it might be accessed by other user mode code), whereas other APIs map the physical address into the kernel mode address space.
Acquisition tools also differ in the way that they identify the physical addresses to include or exclude in the capture. Some tools start at physical address 0 and increment the counter by the nominal page size until the expected (which is another factor in the equation) limit of physical memory is reached. Most, if not all, tools are designed to skip the device memory regions shown in Figure 4-2. This precaution makes the acquisition process more stable, but misses a good deal of memory evidence that might contain artifacts of sophisticated rootkits. On the other hand, some applications provide options for acquiring all physical addresses from page 0 to the perceived end of the physical address space. This is more risky, particularly on systems that are equipped with more than 4GB of memory, but has the potential to produce a more complete representation of the target system’s memory. Ideally, you would use a tool that knows how to acquire relevant data from device-memory regions without freezing or crashing the system. For example, if the acquisition tool can identify the device that occupies the particular physical memory region, the tool can use a method appropriate for that device.
Tool Evaluation
Unlike disk-imaging tools, formal specifications have not been developed nor have evaluations been conducted of memory-acquisition tools. In fact, it is still an area of open research and a topic of heated debates. One of the major challenges of evaluating memory acquisition tools is that they might perform differently depending on the version of the OS, the configuration of the operating system, and the hardware that is installed. It is also important to emphasize that virtualization platforms are often far more predictable and homogenous than real hardware, which means they might not provide a good indication of how a tool will perform in the heterogeneous world of real hardware. Some promising research is being done. For example, in 2013, Stefan Voemel and Johannes Stüttgen published a research paper in which they presented An evaluation platform for forensic memory acquisition software (http://www.dfrws.org/2013/proceedings/DFRWS2013-11.pdf). In addition, GMG Systems, Inc., offers its customers a methodology for testing the accuracy and completeness of its memory acquisition tools (MAUT).
From an operational perspective, the basic attributes of a trusted forensic acquisition tool are that it must acquire evidence in a manner that is accurate, complete, documented, and with robust error logging. A major problem among many current acquisition tools is that when they fail (either altogether or while reading one or more pages) they often silently fail. This problem prevents investigators from realizing that a problem even exists until they reach the analysis phase (i.e., Volatility cannot list processes), at which point it’s frequently too late to go back and acquire another memory image from the target system. No evidence gathering technique is free from error. However, if an acquisition tool reliably logs errors, then the analyst (or trier of fact) can decide how to deal with the error. From an operational or evidentiary perspective, the worst scenario is not to know what you have once you’ve completed evidence gathering.
Also keep in mind that just because a tool didn’t crash or freeze the target machine, that doesn’t mean it produced an accurate and complete memory “image.” On Microsoft Windows systems, you can use the Microsoft driver verifier (https://support.microsoft.com/kb/244617) to determine whether or not the tool vendor has exercised reasonable care in the development of the tool. Aside from this, your best line of defense is testing the tool on systems that resemble (as closely as possible) the systems on which you’ll use them in the field. Unfortunately this is not always feasible due to the various combinations of hardware and software that exist.
Tool Selection
The following list shows commonly used memory acquisition tools, in no particular order. This section is also not intended to give an exhaustive list of the features that respective tools provide. Furthermore, we have not validated the claims nor had the opportunity to use every feature described. So do not interpret this information as an evaluation or endorsement of any particular product.
- GMG Systems, Inc., KnTTools: This tool’s highlights include remote deployment modules, cryptographic integrity checks, evidence collection over SSL, output compression, optional bandwidth throttling, automatic collection of live user state data for cross-referencing, pagefile capture, robust error logging, and rigorous testing and documentation. It can also acquire ROM/EEPROM/NVRAM from the BIOS and peripheral device memory (PCI, video card, network adapter).
- F-Response: The suite of products from F-Response introduced a groundbreaking new capability in memory forensics—the ability to interrogate live systems from a remote location over a read-only iSCSI connection. F-Response presents a vendor- and OS-agnostic view of the target system’s physical memory and hard disks, which means you can access them from Windows, Mac OS X, or Linux analysis stations and process them with any tool.
- Mandiant Memoryze: A tool you can easily run from removable media and that supports acquisition from most popular versions of Microsoft Windows. You can import the XML output of Memoryze into Mandiant Redline for graphical analysis of objects in physical memory.
- HBGary FastDump: A tool that claims to leave the smallest footprint possible, the ability to acquire page files and physical memory into a single output file (HPAK), and the ability to probe process memory (a potentially invasive operation that forces swapped pages to be read back into RAM before acquisition).
- MoonSols Windows Memory Toolkit: The MWMT family includes win32dd, win64dd, and the most recent version of DumpIt—a utility that combines the 32- and 64-bit memory dumping acquisition tools into an executable that requires just a single click to operate. No further interaction is required. However, if you do need more advanced options, such as choosing between output format types, enabling RC4 encryption, or scripting the execution across multiple machines, you can do that as well.
- AccessData FTK Imager: This tool supports acquisition of many types of data, including RAM. AccessData also sells a pre-configured live response USB toolkit that acquires physical memory in addition to chat logs, network connections, and so on.
- EnCase/WinEn: The acquisition tool from Guidance Software can dump memory in compressed format and record metadata in the headers (such as the case name, analyst, etc.). The Enterprise version of EnCase leverages similar code in its agent that allows remote interrogation of live systems (see http://volatility-labs.blogspot.com/2013/10/sampling-ram-across-encase-enterprise.html).
- Belkasoft Live RAM Capturer: A utility that advertises the ability to dump memory even when aggressive anti-debugging and anti-dumping mechanisms are present. It supports all the major 32- and 64-bit Windows versions and can be run from a USB thumb drive.
- ATC-NY Windows Memory Reader: This tool can save memory in raw or crash dump formats and includes a variety of integrity hashing options. When used from a UNIX-like environment such as MinGW or Cygwin, you can easily send the output to a remote
netcatlistener or over an encrypted SSH tunnel. - Winpmem: The only open-source memory acquisition tool for Windows. It includes the capability to output files in raw or crash dump format, choose between various acquisition methods (including the highly experimental PTE remapping technique), and expose physical memory through a device for live analysis of a local system.
Memory Acquisition with KnTDD
KnTDD is a component of the KnTTools package available from GMG Systems, Inc. (http://www.gmgsystemsinc.com/knttools). An earlier version of this software won the 2005 Digital Forensics Research Conference’s (DFRWS) Forensics Challenge (http://www.dfrws.org/2005/challenge/kntlist.shtml) and has since been regarded as one of the most robust, fully featured, and well-documented memory acquisition and analysis packages. KnTTools is available in Basic and Enterprise Editions. Paraphrased from the tool’s website, the Basic Edition includes the following:
- Acquisition of physical memory (main computer memory) from systems running most versions of Windows from XP Service Pack 3 to Windows 8.1 and Server 2012 R2 (see the website for an exact list)
- Acquisition to removable media; includes pre-configured but customizable
autorun.infscripts for automation - Acquisition to the network (to a custom encrypted
netcatlistener) with or without bandwidth throttling - Cryptographic integrity checks (MD5, SHA1, SHA256, SHA512) and robust audit logging
- Output compression using zlib, gzip, bzip, lznt1, and others
- Conversion of the binary memory image to Microsoft crash dump format
- Bulk encryption of output using X509/PKCS#7 certificates
- Acquisition of certain system-state information, including active processes, loaded modules and listening endpoints using user mode APIs (for later use in cross-view detection algorithms)
- On Windows 2003 and later, NVRAM, standard CMOS, IOAPIC table, MBR boot sector, and VBR are acquired
- Collection of the system page file(s)
- Integration with KnTList for analysis and cross-view analysis
Additionally, the Enterprise Edition supports the following:
- Evidence acquisition over an SSL/TLS tunnel
- Evidence acquisition to a WebDAV-enabled web server
- Evidence acquisition to an anonymous FTP server
- A remotely deployable version that runs as a system service (KnTDDSvc)
- A remote deployment module (KnTDeploy) that can pull and deploy encrypted evidence collection “packages” from an SSL-enabled web server or push the packages out to a remote Admin$ share on the “suspect” machine
- Supports the
\.VideoMemory,\.NetXtremeMemory, and\.NicMemorypseudo-devices for acquiring RAM or SRAM from select video and network controllers
An Example of KnTDD in Action
The following steps show you how to deploy KnTTools from removable media. Specifically, we will demonstrate acquisition of physical memory and the page file(s) in an encrypted, compressed format.
- Create an X509/PKCS#7 digital certificate if you don’t have one. For creation, you can use
makecert.exe, a tool distributed with Microsoft Visual Studio and other Microsoft software development packages, including the free Visual Studio Express. The following command generates a self-signed certificate namedmichael.ligh.cer:C:Analyst>makecert.exe -r -pe -n "[email protected]" -sky exchange -ss my -a sha1 -len 2048 -b 05/06/2014 -e 05/06/2014 michael.ligh.cer Succeeded - Execute KnTDD from the removable media (
G:in this case) once it’s connected to the target system. The options request SHA512 hashes, encryption with the self-signed certificate, LZNT1 compression, and page file collection. Note that the components of the tool set are disguised with the “covert” naming convention (i.e.,kntdd.exewas renamed tocovert.exe). The renaming prevents simple anti-forensics attacks based on names of common acquisition tools. Also, the device and symbolic link names are randomized.G:deploycovert.amd64>covert.exe -v -o memory.bin --log --cryptsum sha_512 --pagefiles --force_pagefiles --4gplus --comp lznt1 --cert michael.ligh.cer --case case001 KnTTools, 2.3.0.2898 kntdd physical memory forensic acquisition utility, 2.3.0.2898 Copyright (C) 2006-2013 GMG Systems, Inc. Current User: WIN-948O8I1DO91Valor Fully-qualified DNS Name: WIN-948O8I1DO91 NetBIOS Name: WIN-948O8I1DO91 Fully-qualified physical DNS Name: WIN-948O8I1DO91 Uptime: 0 days 7:39:4.987 Physical memory modules installed on the system: 0x80000000 Physical memory visible to the operating system: 0x7ff7e000 Highest physical page plus 4096 bytes: 0x80000000 PAE is enabled! [snip] Installing driver covertdrv from image path G:deploycovert.amd64amd64covertdrv.sys Starting driver as DeviceLNk2OwGwN Driver symbolic link name: DosDevicesXPBM8vLS Driver started. Binding to symbolic link \.Vpa1CSE6zN Symbolic link is bound. Total bytes copied: 0x80000000 The loaded OS kernel name is C:Windowssystem32 toskrnl.exe [snip] Reading standard Cmos data...Ok! Reading standard IOAPIC data...Ok! Reading disk boot sector... ArcPath: multi(0)disk(0)rdisk(0)partition(1)->\.PhysicalDrive0 OK! Reading volume boot records... ArcPath: multi(0)disk(0)rdisk(0)partition(1)->\.PhysicalDrive0 OK: 1 volume boot records read. [snip] Copying pagefiles... C:pagefile.sys Pid: 0x4 Handle: 0xffffffff800001e0 Object: 0xfffffa8002ca7390 LogicalFileSize: 0x72d33000 Directory: No Compressed: No Encrypted: No PagingFile: Yes Start: 0x0 ExtentSize: 0x72d33000 LogicalOffset: 0x251508000 Copying pagefiles completed successfully. [snip] - Transfer the acquired evidence to your forensic workstation using the best practices described in the “Local Acquisition to Removable Media” section. Listing the evidence directory shows the compressed and encrypted (
lznt1.kpgextension) physical memory dump, page file(s), acquisition log, user system state, and hashes. The critical OS files (ntoskrnl.exe,tcpip.sys,ndis.sys, etc.) are also captured for later analysis—they will appear in theWINDOWSsubdirectory.C:Analyst>dir "{DC04DB43-AC21-4060-8954-17D0AD3166DC}" Directory of C:Analyst{DC04DB43-AC21-4060-8954-17D0AD3166DC} 05/06/2014 09:14 PM <DIR> . 05/06/2014 09:14 PM <DIR> .. 05/06/2014 09:14 PM 1,524 memory.bin.dumpheader.lznt1.kpg 05/06/2014 09:14 PM 933,585,748 memory.bin.lznt1.kpg 05/06/2014 09:14 PM 4,116 memory.log.lznt1.kpg 05/06/2014 09:14 PM 51,067,636 memory.Pagedump_C!! pagefile!sys.DMP.lznt1.kpg 05/06/2014 09:14 PM 293,348 memory.user_system_state.xml.lznt1.kpg 05/06/2014 09:14 PM 4,068 memory.xml.lznt1.kpg 05/06/2014 09:14 PM <DIR> WINDOWS 6 File(s) 984,956,440 bytes 3 Dir(s) 901,435,392 bytes free - Use the
kntencrypt.exeutility to decrypt the files using your certificate. This command generates new files with anlznt1extension, to indicate they are still compressed.C:AnalystKnTTools.amd64>kntencrypt.exe --cert michael.ligh.cer -d -v "{DC04DB43-AC21-4060-8954-17D0AD3166DC}/*" KnTTools, 2.3.0.2898 KnTTools encryption utility., 2.3.0.2898 Copyright (C) 2006-2013 GMG Systems, Inc. 07/05/2014 02:31:41 (UTC) 06/05/2014 21:31:41 (local time) Current User: WIN-948O8I1DO91Valor C:AnalystKnTTools.amd64{DC04DB43-AC21-4060-8954- 17D0AD3166DC}memory.bin.dumpheader.lznt1.kpg-->C:AnalystKnTTools.amd64 {DC04DB43-AC21-4060-8954-17D0AD3166DC}memory.bin.dumpheader.lznt1... OK.percent complete C:AnalystKnTTools.amd64{DC04DB43-AC21-4060-8954-17D0AD3166DC} memory.bin.lznt1.kpg-->C:AnalystKnTTools.amd64{DC04DB43-AC21-4060 -8954-17D0AD3166DC}memory.bin.lznt1... OK.percent complete [snip] - Use the custom version of
dd.exeprovided with KnTTools to decompress the evidence files into an output directory. We also use the--sparseoption so the files are recompressed using NTFS file compression (which results in the evidence files taking up a lot less space on disk and they are generally faster to read).C:AnalystKnTTools.amd64>dd.exe -v if="{DC04DB43-AC21-4060-8954-17D0AD3166DC}/*.lznt1" of=decompressed --decomp lznt1 --sparse –localwrt Forensic Acquisition Utilities, 1.4.0.2464 dd, 5.4.0.2464 Copyright (C) 2007-2013 GMG Systems, Inc. C:AnalystKnTTools.amd64decompressedmemory.user_system_state.xml 327680/1008180 bytes (compressed/uncompressed) 0+1 records in 0+1 records out 1008180 bytes written [snip]
Figure 4-3 shows an example of the evidence directory after decryption and decompression. The memory.bin file is the main memory sample and the user state is collected in memory.user_system_state.xml. As shown in the figure, this XML file contains details on the current state of the machine from the operating system’s perspective (i.e., its APIs). You can parse the XML to compare data with what you find in the physical memory sample (this is what KnTList does).
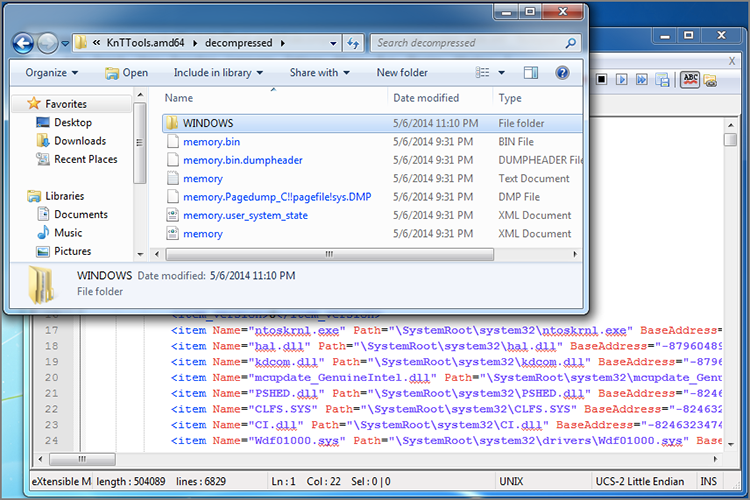
Figure 4-3: An example of the evidence gathered by KnTDD, including the physical memory, page file, XML user state, and OS kernel files.
Remote Acquisition
We demonstrate one of the remote acquisition options available with KnTDD here. On the server-side (the machine you’ll use to receive data), we executed the command that follows. The -L option listens for multiple connections, because the memory sample is transmitted over a different port than the log file, XML user state, and so on. Our server IP is 192.168.228.143 (acquiring over the local subnet).
F:KnTTools.amd64> nc --verbose -L --port 8000
     --source 192.168.228.143
     -O memory.bin --localwrt

Forensic Acquisition Utilities, 3.4.0.2464
Netcat network data redirector., 1.11.2.2464
Copyright (C) 2002-2013 GMG Systems, Inc.

Windows 8 Enterprise 6.2.9200 Multiprocessor Free(, 9200.win8_rtm.120725-1247)
4/28/2014 19:21:52 PM (UTC)
4/28/2014 12:21:52 PM (local time)
Current User: uglyTest
Current Locale: English_United States.437
User Default Locale Language: 0x0409
The VistaFirewall Firewall is active with exceptions.
Listening on TCP: ugly.localdomain: 8000.
On the target system (the one from which we are acquiring memory), the following command was used:
F:KnTTools.amd64> kntdd.exe --verbose --out 192.168.228.143
       --iport 8000 --4gplus
       --cryptsum sha_512 --pagefiles --force_pagefiles
       --log --case "Case002"
       --comp lznt1
       --cert michael.ligh.cer

100 percent complete
The loaded OS kernel name is C:Windowssystem32
toskrnl.exe
If needed, you can control the peak bandwidth and Quality of Service (QoS) using additional command-line options (for example, if you don’t want to saturate a client’s network while acquiring memory).
Runtime Interrogation with F-Response
F-Response (https://www.f-response.com) by Agile Risk Management provides read-only access to a remote computer’s physical storage media, including physical memory. The F-Response agent implements a modified version of the iSCSI protocol that blocks write operations to the target media, preventing accidental changes during acquisition and analysis. F-Response is designed for compatibility with any forensic software that provides disk or memory-analysis capabilities. For example, you could use F-Response to mount a target system’s drives over the network and then use The Sleuth Kit, X-Ways, EnCase, or FTK on your analysis machine to inspect the target machine for malicious activity.
Most important, you can use F-Response to mount RAM over the network and then examine it from your analysis machine. In a presentation titled Upping the ‘Anti’: Using Memory Analysis to Fight Malware (http://www.4tphi.net/fatkit/papers/Walters_2008_SANS.pdf) Matt Shannon (F-Response principal) and AAron Walters, (Volatility founder) introduced a tool called Voltage, which couples the power of F-Response and Volatility. This allows detection of changes to memory in real time across all computers in an enterprise without having to reboot, power down, visit them physically, or worry about accidentally writing changes back to the target system’s memory.
General Steps for Using F-Response
The steps for using F-Response are different depending on which edition of the software you purchase, but the concepts are the same. The following example is based on the Field Kit Edition. Since the time we first wrote about F-Response in the Malware Analyst’s Cookbook, the team has drastically expanded their entire family of products. You can now deploy covert agents (i.e., no GUI) to target systems, enable 256-bit AES encryption for data that is transmitted over the wire, and connect to cloud-based storage systems.
Figure 4-4 shows an image of the agent that you would run on a target machine using the Field Kit Edition of F-Response. Once you enter the requested options, you connect to the target machine (192.168.1.129 on TCP port 3260 in this case) from your analysis station using Microsoft’s iSCSI initiator. The target machine’s physical disk(s) and memory then become available to your analysis machine over the network. For example, you might see the target machine’s C: drive mounted as F: on your analysis station, and the target machine’s memory mounted as G:. Then you can launch your desired forensic software from your analysis station and aim them at your F: or G: drive.
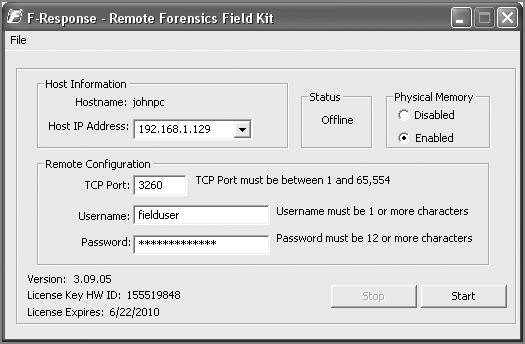
Figure 4-4: Configuring the F-Response GUI agent on a target system
Connecting from Mac OS X and Linux
You can also connect to the target from a Mac OS X or Linux system using Open-iSCSI (http://www.open-iscsi.org). Once installed, you can manually leverage the iscsiadm command-line utility or by embedding it in a script to automatically connect and mount a remote system’s drives. Students in our training class experiment with the latter method by using a script called remotemem.py that we designed for exactly this purpose. Here’s how to run it:
$ sudo python remotemem.py
      --host=192.168.1.129
      --port=3260
      --user=fielduser
      --password=YOURPASSWORD

===================================================
Memory node: /dev/sdb, Disk node: /dev/sdc

To acquire a full RAM dump, open a new tab in your
terminal and type the following command:

$ sudo dd if=/dev/sdb of=~/mem.dmp bs=512

To "interrogate" memory (i.e. examine RAM w/o a full acquisition)
simply point Volatility to the memory node. For example:

$ sudo python vol.py -f /dev/sdb --profile=PROFILE pslist

[snip]

NOTE: you must run the commands as sudo/root to access the unix
devices (i.e. /dev/sdX).

Press enter to disconnect and logout...
In the output, the script takes care of all the administrative tasks and simply tells you where to find the remote system’s RAM and hard drive (/dev/sdb and /dev/sdc, respectively). The connection stays alive until you press ENTER into the terminal to dismiss the script. We typically instruct investigators to either acquire memory over the remote channel (by using a typical dd command) or perform runtime interrogation by directly running Volatility plugins against the /dev/sdb device.
The major benefit of interrogation is getting a list of processes, kernel modules, or network connections in a matter of seconds by transferring only 5-10KB of data per machine.
MoonSols Windows Memory Toolkit
MoonSols Windows Memory Toolkit (http://www.moonsols.com/windows-memory-toolkit) by Matthieu Suiche supports memory acquisition from 32-bit and 64-bit versions of Windows XP, 2003, 2008, Vista, 2008 R2, 7, and 8. Version 1.4 of the software is free. At the time of this writing, the most recent version is 2.0, which is available in Consultant, Enterprise, and Enterprise Plus licensing schemes. Here are a few of the features of the 2.0 toolkit:
- It supports hashing with
MD5,SHA-1, andSHA-256. - It includes a server component so you can transmit memory dumps across the network, with optional RC4 encryption and/or LZNT1 compression.
- It can map memory in three different ways, including the well-known use of
DevicePhysicalMemory. - It can convert full memory dumps to Microsoft crash dumps, which you can then analyze using one of the Microsoft debuggers.
- It can convert hibernation files and crash dumps into raw memory dumps.
DumpIt.execombineswin32dd.exeandwin64dd.exeto provide memory dumps in a single-click. You can still control options via command-line if you desire.
Local Collection
You can create a memory dump by double-clicking the DumpIt.exe icon or executing it on the command line without any options. However, we highly recommend at least displaying the possible options first, just to make sure you know what the defaults are (and that they’re suitable for your case).
F:DFIR> DumpIt.exe /?
  DumpIt - v2.1.0.20140115 - One click memory memory dumper
  Copyright (c) 2007 - 2014, Matthieu Suiche <http://www.msuiche.net>
  Copyright (c) 2012 - 2014, MoonSols Limited <http://www.moonsols.com>

Usage: DumpIt [options]
  Option       Description
  ------       -----------
  /j <log>     Log file destination.
  /f <file>    File destination.
  /r           Create a Raw memory dump file. (default)
  /d           Create a Microsoft memory crash dump file.
              (WinDbg compliant, XP and later only)
  /c <value>   Memory content.
                  0 - Full physical address space.
                  1 - Memory manager physical memory block. (default)
                  2 - Memory manager physical memory block + Very First PFNs.
  /m <value>   Mapping method for either /d or /r option.
                  0 - MmMapIoSpace().
                  1 - \Device\PhysicalMemory.
                  2 - PFN Mapping. (default)
  /k           Create a Microsoft memory crash dump file (BSOD).
               (local only, reboot)
  /lznt1        Use LZNT1 compression.
  /rc4 <key>    USE RC4 encryption.
  /unpack <input> <output>   Unpack a file who had been previously encoded
                or compressed via MoonSols DumpIt.
  /s <value>   Hash function to use. (Only on sender/local machine)
                  0 - No hashing algorithm. (default)
                  1 - SHA1 algorithm.
                  2 - MD5 algorithm.
                  3 - SHA-256 algorithm.
  /y <value>   Speed level.
                  0 - Normal.
                  1 - Fast.
                  2 - Sonic.
                  3 - Hyper sonic. (default)
  /t <addr>    Remote host or address IP.
  /p <port>    Port, can be used with both /t and /l options. (default: 1337)
  /l           Server mode to receive memory dump remotely.
  /i            Interactive mode.
  /a           Answer "yes" to all questions. Must be used for piped-report.
  /?           Display this help.

Samples:
  DumpIt /d /f physmem.dmp               - Standard Microsoft crash dump.
  DumpIt /m 0 /r /f F:physmem.bin       - Raw dump using MmMapIoSpace() method.
  DumpIt /l /f F:msuiche.bin            - Waiting for a local connexion on
                                           port 1337.
  DumpIt /t sample.foo.com /d /c 0       - Send remotely a Microsoft
                                           full crash dump.
  DumpIt /d /f \smb_server
emote.dmp   - Send remotely on a SMB server.
The following output shows an example of running DumpIt.exe with all the default options. To automatically answer “yes” to all questions, use the /a option (for scripted acquisition). The results from this command show details about the computer’s memory configuration, including the total address space size, the size of an individual memory page, and the number of seconds that elapsed during the memory acquisition. The memory dump is saved in the directory containing DumpIt.exe (preferably a removable drive).
F:DFIR> DumpIt.exe
  DumpIt - v2.1.0.20140115 - One click memory memory dumper
  Copyright (c) 2007 - 2014, Matthieu Suiche <http://www.msuiche.net>
  Copyright (c) 2012 - 2014, MoonSols Limited <http://www.moonsols.com>

    Address space size:        7365197824 bytes (   7024 Mb)
    Free space size:          38171750400 bytes (  36403 Mb)

    * Destination path:           ??F:DFIRBC44-20140426-221920.dmp

    O.S. Version:               Microsoft Enterprise, 64-bit (build 9200)
    Computer name:              BC44

    Physical memory in use:         11%
    Physical memory size:       6143476 Kb (   5999 Mb)
    Physical memory available:  5411984 Kb (   5285 Mb)
    Paging file size:           10337780 Kb (  10095 Mb)
    Paging file available:      9467612 Kb (   9245 Mb)
    Virtual memory size:        2097024 Kb (   2047 Mb)
    Virtual memory available:   2054932 Kb (   2006 Mb)
    Extented memory available:        0 Kb (      0 Mb)

    Physical page size:         4096 bytes
    Minimum physical address:   0x0000000000001000
    Maximum physical address:   0x00000001B6FFF000

    Address space size:         7365197824 bytes (7192576 Kb)

    --> Are you sure you want to continue? [y/n] y
    Acquisition started at:     [26/4/2014 (DD/MM/YYYY) 22:19:52 (UTC)]
    + Processing... Done.

    Acquisition finished at:  [2014-04-26 (YYYY-MM-DD) 22:20:45 (UTC)]
    Time elapsed:             0:53 minutes:seconds (53 secs)

    Created file size:          6290927616 bytes (   5999 Mb)
Remote Collection
To save the dump directly to another machine by transferring the image across the network, you first need to start a server instance of DumpIt.exe. On the machine where you want to receive the memory dump, determine its IP address and then invoke a server instance, like this:
F:DFIR> ipconfig
     Windows IP Configuration
     Ethernet adapter Local Area Connection:
     Connection-specific DNS Suffix  . :
     IP Address. . . . . . . . . . . . : 10.211.55.5
     Subnet Mask . . . . . . . . . . . : 255.255.255.0
     Default Gateway . . . . . . . . . : 10.211.55.1

 F:DFIR> DumpIt.exe /l /f mem.raw
  DumpIt - v2.1.0.20140115 - One click memory memory dumper
  Copyright (c) 2007 - 2014, Matthieu Suiche <http://www.msuiche.net>
  Copyright (c) 2012 - 2014, MoonSols Limited <http://www.moonsols.com>

  Remote server:              0.0.0.0:1337
By default, DumpIt.exe listens on all interfaces and uses TCP port 1337. You can modify the port with the /p switch when creating the server instance. The next step is to execute DumpIt.exe on the machine whose memory is being acquired and connect to your server instance to transmit the memory dump. In this example, we use RC4 encryption by specifying a text-based key on the command line (the longer the better; ours is just an example).
F:DFIR> DumpIt.exe /t 10.211.55.5 /s 1 /rc4 MyRc4k3yNote that we opted to compute a SHA-256 hash of the memory dump, as in the first example. On your server machine, you should then decrypt the memory dump, like this:
F:DFIR> DumpIt.exe /rc4 MyRc4K3y /unpack mem.raw unpacked.raw

  DumpIt - v2.1.0.20140115 - One click memory memory dumper
  Copyright (c) 2007 - 2014, Matthieu Suiche <http://www.msuiche.net>
  Copyright (c) 2012 - 2014, MoonSols Limited <http://www.moonsols.com>

    -> Unpacking mem.raw...
       0x176f1f4ac bytes readed. 0x176f02000 bytes written.
    -> Success.
At this point, you can verify the SHA-256 hash to ensure that there were no errors in transmission over the network and that the RC4 decryption completed successfully. Note that you can use netcat to receive the memory as well, but you’d still need DumpIt.exe (or another compatible utility) to unpack it if you used compression or encryption.
Memory Dump Formats
Depending on your role in a particular case, you might not be the person in charge of acquiring memory. In fact, the person who acquires memory might not even correspond with you before capturing the evidence. Thus, you won’t get the opportunity to share best practices with them, recommend your favorite tool(s), or request the evidence in a particular format. Nevertheless, you have to deal with what you get. Luckily, Volatility uses address space voting rounds to automatically identify the file format for you. In other words, it cycles through all supported formats until it can identify the appropriate address space for the target file based on magic bytes or other patterns.
The Volatility Framework also provides several plugins, listed in Table 4-1, for exploring the metadata associated with many of the common file formats.
| Format | Plugin | Output |
| Crash dump | crashinfo | CPU registers, critical pointers and symbol locations, bug check codes, memory runs |
| Hibernation file | hibinfo | CPU registers, timestamps, OS version, memory runs |
| HPAK | hpakinfo | Memory runs, page file name, compression enabled/disabled |
| Mach-o | machoinfo | Memory runs |
| VMware | vmwareinfo | Memory runs, VMX configuration, CPU registers, PNG thumbnail screenshot |
| VirtualBox | vboxinfo | Memory runs, VirtualBox version, number of CPUs |
Raw Memory Dump
A raw memory dump is the most widely supported format among analysis tools. It does not contain any headers, metadata, or magic values for file type identification. The raw format typically includes padding for any memory ranges that were intentionally skipped (i.e., device memory) or that could not be read by the acquisition tool, which helps maintain spatial integrity (relative offsets among data).
Windows Crash Dump
The Windows crash dump file format was designed for debugging purposes. Crash dumps begin with a _DMP_HEADER or _DMP_HEADER64 structure, as shown in the following code. The Signature member contains PAGEDUMP or PAGEDU64, respectively.
>>> dt("_DMP_HEADER")
'_DMP_HEADER' (4096 bytes)
0x0   : Signature                      ['array', 4, ['unsigned char']]
0x4   : ValidDump                      ['array', 4, ['unsigned char']]
0x8   : MajorVersion                   ['unsigned long']
0xc   : MinorVersion                   ['unsigned long']
0x10  : DirectoryTableBase             ['unsigned long']
0x14  : PfnDataBase                    ['unsigned long']
0x18  : PsLoadedModuleList             ['unsigned long']
0x1c  : PsActiveProcessHead            ['unsigned long']
0x30  : MachineImageType               ['unsigned long']
0x34  : NumberProcessors               ['unsigned long']
0x38  : BugCheckCode                   ['unsigned long']
0x40  : BugCheckCodeParameter          ['array', 4, ['unsigned long long']]
0x80  : KdDebuggerDataBlock            ['unsigned long long']
0x88  : PhysicalMemoryBlockBuffer      ['_PHYSICAL_MEMORY_DESCRIPTOR']
[snip]
The header identifies the major and minor OS version, the kernel DTB (DirectoryTableBase), the addresses of the active process and loaded kernel module list heads, and information on the physical memory runs. It also shows the bug check codes, which a debugger uses to determine the cause of the crash.
The following list describes how you can create a crash dump. Please note that not all methods are suitable for forensics purposes.
- Blue Screens: You can configure a system to create a crash dump when a Blue Screen of Death (BSoD) occurs (see KB 969028). For testing purposes, you can use NotMyFault from Sysinternals (http://download.sysinternals.com/files/NotMyFault.zip), which includes an intentionally buggy driver that causes a BSoD. Of course, this method powers down the system hard, which might result in loss of other data.
- CrashOnScrollControl: Some PS/2 and USB keyboards have special key sequences that produce a crash dump (see KB 244139). On server systems that don’t have keyboards attached, you can use Non-Maskable Interrupts (see KB 927069). However, these methods typically require pre-configuration of the registry and BIOS.
- Debuggers: If you’re attached to a target system using a remote kernel debugger (WinDBG), you can use the
.crashor.dumpcommands. It is convenient for debugging, but it rarely ever applies to a forensic scenario. You can also use LiveKD (http://download.sysinternals.com/files/LiveKD.zip) if you’re debugging locally, but it typically requires pre-installing special software on the target system.
The methods we just described rely on the same facility within the kernel to generate the crash dumps. Thus, they all suffer from a few similar weaknesses. They typically don’t include device memory regions or the first physical page, which might contain a copy of the Master Boot Record (MBR) from disk and pre-boot authentication passwords. Furthermore, they can be subverted by malware that registers a bug check callback (see “Malicious Callbacks” in Chapter 13) or by disabling access to the kernel debugger. Some systems might not even be able to create complete crash dumps due to size (see http://media.blackhat.com/bh-us-10/whitepapers/Suiche/BlackHat-USA-2010-Suiche-Blue-Screen-of-the-Death-is-dead-wp.pdf).
Some forensic memory acquisition tools such as MoonSols MWMT provide the option to create a crash dump file. In these cases, the tool(s) construct their own crash dump header and then write physical memory runs into the output file. In other words, they generate a crash dump file compatible with the WinDBG debugger (and thus Volatility), but do not use the same kernel facility that the other techniques use. Thus, many of the disadvantages such as the missing first page, subversion via callbacks, and size limitations are avoided. Volatility and KnTDD can also convert raw memory dumps into crash dumps, as you’ll learn later in the chapter.
Windows Hibernation File
A hibernation file (hiberfil.sys) contains a compressed copy of memory that the system dumps to disk during the hibernation process. In 2008, Matthieu Suiche (MoonSols) developed the first tool, Sandman, for analyzing these files for forensic purposes. You can read about his initial research in Windows Hibernation File For Fun ‘N’ Profit (http://sebug.net/paper/Meeting-Documents/BlackHat-USA2008/BH_US_08_Suiche_Windows_hibernation.pdf).
Hibernation files consist of a standard header (PO_MEMORY_IMAGE), a set of kernel contexts and registers such as CR3, and several arrays of compressed data blocks. The compression format used was basic Xpress (http://msdn.microsoft.com/en-us/library/hh554002.aspx). However, starting in Windows 8 and Server 2012, Microsoft started using the Xpress algorithm along with Huffman and LZ encoding. Here’s an example of the hibernation file header:
>>> dt("PO_MEMORY_IMAGE")
'PO_MEMORY_IMAGE' (168 bytes)
0x0   : Signature                      ['String', {'length': 4}]
0x4   : Version                        ['unsigned long']
0x8   : CheckSum                       ['unsigned long']
0xc   : LengthSelf                     ['unsigned long']
0x10  : PageSelf                       ['unsigned long']
0x14  : PageSize                       ['unsigned long']
0x18  : ImageType                      ['unsigned long']
0x20  : SystemTime                     ['WinTimeStamp', {}]
[snip]
The Signature member usually contains hibr, HIBR, wake, or WAKE. However in some cases, the entire PO_MEMORY_IMAGE header is zeroed out (this happens when the system resumes), which can prevent analysis of the hibernation file in most tools. In those cases, Volatility uses a brute force algorithm to locate the data it needs. When performing an analysis of the hibernation file with Volatility, remember that every time you run a command, you need to decompress certain segments. As a general time saver, we recommend decompressing the entire memory dump once (using the imagecopy command, which we describe shortly). The decompression converts the hibernation file into a raw memory dump that you can analyze without on-the-fly decompression.
As explained in Microsoft KB 920730, to create a hibernation file, first enable hibernation in the kernel (powercfg.exe /hibernate on) and then issue a shutdown /h command to hibernate. Depending on your OS version, you may also accomplish it by clicking from the Start menu (Start ⇒ Hibernate or Start ⇒ Shutdown ⇒ Hibernate). In most forensic cases, however, you’ll receive a laptop that has already been hibernated or you’ll get a forensic disk image from a system that has a hibernation file available. In this case, you’ll have to copy off the C:hiberfil.sys file by mounting the disk from an analysis machine (or by using a live CD/DVD).
Expert Witness Format (EWF)
Memory acquired by EnCase is stored in Expert Witness Format (EWF). This is a very common format due to the popularity of EnCase in forensic investigations. Thus, you should be familiar with the following methods of analyzing the EWF memory dumps:
- EWFAddressSpace: Volatility includes an address space that can work with EWF files, but it requires that you install
libewf(https://code.google.com/p/libewf). At the time of this writing,libewfadvertises full supports of the EWF files used by EnCase v6 and prior versions, but the newer EWF2-EX01 introduced with EnCase v7 is experimental only. - Mounting with EnCase: You can mount an EWF file with EnCase and then run Volatility over the exposed device. This also works in a networked environment that allows sampling (see Sampling RAM Across the EnCase Enterprise at http://volatility-labs.blogspot.com/2013/10/sampling-ram-across-encase-enterprise.html). This method also avoids the
libewfdependency and supports EnCase v7 files. - Mounting with FTK Imager: Another alternative is to mount the EWF file as “Physical & Logical” and then run Volatility against the unallocated space portion of the volume (for example,
E:unallocated spaceif the file is mounted on theE:drive letter).
HPAK Format
Designed by HBGary, HPAK allows a target system’s physical memory and page file(s) to embed in the same output file. This is a proprietary format, so the only tool capable of creating an HPAK file is FastDump. Specifically, with this tool, you must use the -hpak command-line option. Otherwise, the memory dump is created in the default format (raw), which doesn’t include the page file(s). You can optionally supply the -compress option to compress the data with zlib. The resulting file has an .hpak extension.
In response to several Volatility users who had unexpectedly received HPAK files for analysis, we created an address space for handling them. Remember, if you don’t perform the acquisition, you have to deal with what you get. Luckily the HPAK file format is relatively simplistic. It has a 32-byte header, as shown next, of which the first four bytes are HPAK (the magic signature). The rest of the fields are currently unknown, but are inconsequential to performing memory analysis.
>>> dt("HPAK_HEADER")
'HPAK_HEADER' (32 bytes)
0x0   : Magic                          ['String', {'length': 4}]
After the header, you will find one or more HPAK_SECTION structures that look like this:
>>> dt("HPAK_SECTION")
'HPAK_SECTION' (224 bytes)
0x0   : Header                         ['String', {'length': 32}]
0x8c  : Compressed                     ['unsigned int']
0x98  : Length                         ['unsigned long long']
0xa8  : Offset                         ['unsigned long long']
0xb0  : NextSection                    ['unsigned long long']
0xd4  : Name                           ['String', {'length': 12}]
The Header value is a string such as HPAKSECTHPAK_SECTION_PHYSDUMP for the section containing physical memory. Likewise, it becomes HPAKSECTHPAK_SECTION_PAGEDUMP for the section containing the target system’s page file. The Offset and Length members tell you exactly where the corresponding data exists in the HPAK file. If Compressed is non-zero, then the section’s data is compressed with the zlib algorithm.
As shown in the following command, you can use hpakinfo to explore the contents of an HPAK file:
$ python vol.py -f memdump.hpak hpakinfo
Header:     HPAKSECTHPAK_SECTION_PHYSDUMP
Length:     0x20000000
Offset:     0x4f8
NextOffset: 0x200004f8
Name:       memdump.bin
Compressed: 0

Header:     HPAKSECTHPAK_SECTION_PAGEDUMP
Length:     0x30000000
Offset:     0x200009d0
NextOffset: 0x500009d0
Name:       dumpfile.sys
Compressed: 0
The output tells you that this HPAK contains physical memory and one paging file. The physical memory section starts at offset 0x4f8 of the memdump.hpak file and consists of 0x20000000 bytes (512MB). Neither section is compressed. You can either run Volatility plugins directly against memdump.hpak, or you can extract the physical memory section to a separate file using the hpakextract plugin. By extracting it, you’re left with a raw memory dump that is compatible with nearly all analysis frameworks.
Virtual Machine Memory
To acquire memory from a VM, you can run one of the aforementioned software tools within the guest OS (VM) or you can perform the acquisition from the hypervisor. This section focuses on VM memory collected from the hypervisor. This technique is typically less invasive (when you perform it without pausing or suspending the VM), because it’s harder for malicious code lurking on the VM to detect your presence. At the end of this section, we’ll also discuss Actaeon, which allows you to perform memory forensics of the actual hypervisor (i.e., analyzing a guest OS directly within the memory of the host).
VMware
If you’re using a desktop product such as VMware Workstation, Player, or Fusion, you just need to suspend/pause or create a snapshot of the VM. As a result, a copy of the VM’s memory writes to a directory on the host’s file system, relative to the .vmx configuration. If you’re using VMware Server or ESX, you can do this from a vSphere GUI console or on command-line with the scriptable vmrun command (see https://www.vmware.com/pdf/vix160_vmrun_command.pdf). In a cloud environment, the memory dump will likely write to a storage area network (SAN) or Network File System (NFS) data store.
Depending on the VMware product/version and how the memory dump was created, you might need to recover more than one file for memory analysis. In some cases, the VM’s memory is entirely contained in a single.vmem file (the raw schema). In other cases, instead of a .vmem, you’ll get a .vmsn (snapshots) or .vmss (saved state), which are proprietary file formats containing memory and metadata (the combined schema). Luckily, Nir Izraeli documented the format well enough to produce an address space for Volatility (see his initial work here: http://code.google.com/p/vmsnparser).
To slightly complicate matters, Sebastian Bourne-Richard recently noticed that VMware products often create a .vmem and one of the structured metadata files (the split schema). An entirely new address space needed to be written for Volatility to support this schema, because the .vmem contains physical memory runs, but the metadata file indicates how to piece them back together to create an accurate representation of the guest’s memory. In other words, when acquiring memory from VMware systems, make sure to recover all files with .vmem, .vmsn, and .vmss extensions—because it is not easy to know beforehand which ones(s) contain the required evidence.
At offset zero of the metadata files, you will find a _VMWARE_HEADER structure that looks like this:
>>> dt("_VMWARE_HEADER")
'_VMWARE_HEADER' (12 bytes)
0x0   : Magic             ['unsigned int']
0x8   : GroupCount        ['unsigned int']
0xc   : Groups            ['array', lambda x : x.GroupCount, ['_VMWARE_GROUP']]
For the file to be considered valid, there’s a Magic value that must be 0xbed2bed0, 0xbad1bad1, 0xbed2bed2, or 0xbed3bed3. The Groups member specifies an array of _VMWARE_GROUP structures that look like this:
>>> dt("_VMWARE_GROUP")
'_VMWARE_GROUP' (80 bytes)
0x0   : Name              ['String', {'length': 64, 'encoding': 'utf8'}]
0x40  : TagsOffset        ['unsigned long long']
Each group has a Name that allows the metadata components to be categorized and a TagsOffset that specifies where you can find a list of _VMARE_TAG structures. A tag looks like this:
>>> dt("_VMWARE_TAG")
'_VMWARE_TAG' (None bytes)
0x0   : Flags        ['unsigned char']
0x1   : NameLength   ['unsigned char']
0x2   : Name         ['String',
     {'length': lambda x : x.NameLength, 'encoding': 'utf8'}]
These tag structures are the key to finding the physical memory data within the metadata file. If the VM has less than 4GB of RAM, a single physical memory run is stored in a group named “memory” and a tag named “Memory.” For systems with more than 4GB of RAM, there are multiple runs, also in a group named “memory,” but including tags named “Memory,” “regionPPN,” “regionPageNum,” and “regionSize.” The address space within Volatility (see volatility/plugins/addrspaces/vmware.py) parses these tags in order to rebuild the view of physical memory.
VirtualBox
VirtualBox does not automatically save a full RAM dump to disk when you suspend or pause a virtual machine (as other virtualization products do). Instead, you must create a memory dump using one of the following techniques:
- The
vboxmanage debugvmcommands. This method creates an ELF64 core dump binary with custom sections that represent the guest’s physical memory. For more information, see: http://www.virtualbox.org/manual/ch08.html#vboxmanage-debugvm. - Use the
--dbgswitch when starting a VM and then the.pgmphystofilecommand. This method outputs a raw memory dump. For more information, see https://www.virtualbox.org/ticket/10222. - Use the VirtualBox Python API (
vboxapi) to create your own memory dumping utility. A user also attached a Python script namedvboxdump.pyto the aforementioned ticket #10222 showing an example.
The second and third methods produce raw memory dumps, which are natively supported by Volatility. However, the first method generates an ELF64 core dump, which requires special support. Philippe Teuwen (see http://wiki.yobi.be/wiki/RAM_analysis) performed the initial research into this file format and created a Volatility address space that supported them. As a result, Cuckoo Sandbox was able to integrate the ability to save memory dumps from VirtualBox VMs in ELF64 core dump format.
The ELF64 files have several custom program header segments. One of them is a PT_NOTE (elf64_note) whose name is VBCORE. The note segment contains a DBGFCOREDESCRIPTOR structure, which is shown in the following code:
>>> dt("DBGFCOREDESCRIPTOR")
'DBGFCOREDESCRIPTOR' (24 bytes)
0x0   : u32Magic                       ['unsigned int']
0x4   : u32FmtVersion                  ['unsigned int']
0x8   : cbSelf                         ['unsigned int']
0xc   : u32VBoxVersion                 ['unsigned int']
0x10  : u32VBoxRevision                ['unsigned int']
0x14  : cCpus                          ['unsigned int']
This structure contains the VirtualBox magic signature (0xc01ac0de), the version information, and number of CPUs for the target system. If you continue to iterate through the file’s program headers, you’ll find various PT_LOAD segments (elf64_phdr). Each segment’s p_paddr member is a starting physical memory address. The p_offset member tells you where in the ELF64 file you can find the chunk of physical memory. Finally, the p_memsz tells you how big the chunk of memory is (in bytes).
QEMU
QEMU is very similar to VirtualBox in that it saves VM memory in the ELF64 core dump format. In fact, the only major difference is that the PT_NOTE name is CORE rather than VBCORE. You can create these dumps by using virsh, a command-line interface to libvirt (http://libvirt.org/index.html). There’s also a Python API, which Cuckoo Sandbox (http://www.cuckoosandbox.org/) currently uses to create memory dumps of infected QEMU VMs.
Xen/KVM
The LibVMI project (https://github.com/bdpayne/libvmi) is a VM introspection library that supports the Xen and KVM hypervisors. In other words, you can perform real-time analysis of running VMs without executing any code inside the VM. This is a powerful capability for live antivirus and rootkit scanning, as well as general system monitoring. As an added bonus, the project includes a Python API (pyvmi) and a Volatility address space (PyVmiAddressSpace) for analyzing the memory.
Microsoft Hyper-V
To acquire memory from Hyper-V VMs, you first need to save the VM’s state or create a snapshot. Then recover the .bin (physical memory chunks) and .vsv (metadata) files from the VM configuration directory. Unfortunately, Volatility does not currently support the Hyper-V memory format, so you need to use the vm2dmp.exe utility (http://archive.msdn.microsoft.com/vm2dmp) to convert the .bin and .vsv files into a Windows crash dump. You can then analyze the crash dump with WinDBG or Volatility. For more information on this process, see Analyzing Hyper-V Saved State Files in Volatility by Wyatt Roersma (http://www.wyattroersma.com/?p=77). One of Wyatt’s major observations is that vm2dmp.exe fails on any VM with more than 4GB of RAM.
Hypervisor Memory Forensics
One of the most fascinating developments in VM memory forensics is Actaeon (http://www.s3.eurecom.fr/tools/actaeon) by Mariano Graziano, Andrea Lanzi, and Davide Balzarotti. Given a physical memory dump of a host system, this tool enables analysis of guest OSs in virtualization environments using Intel VT-x technology. This includes the ability to locate memory resident hypervisors (benign or malicious) and nested virtualization. Its current implementation allows VM introspection of 32-bit Windows guests running under KVM, Xen, VMware Workstation, VirtualBox, and HyperDbg. Actaeon is implemented as a patch to Volatility and it won first place in the 2013 Volatility Plugin Contest (http://volatility-labs.blogspot.com/2013/08/results-are-in-for-1st-annual.html).
Converting Memory Dumps
With the exception of Volatility, most memory analysis frameworks only support one or two of the file formats covered in the previous section. If you receive a memory dump in a format that’s not compatible with your desired analysis tool, you should consider converting it. As previously mentioned, the raw format is the most widely supported, so that often becomes the destination format during the conversion. Here’s a list of tools that can help you with these tasks:
- MoonSols Windows Memory Toolkit (MWMT): This toolkit provides utilities to convert hibernation files and crash dumps into raw format. It also can convert hibernation files and raw files into crash dumps.
- VMware vmss2core: The
vmss2core.exeutility (https://labs.vmware.com/flings/vmss2core) can convert VMware saved state (.vmsn) or snapshot (.vmsn) files into crash dumps compatible with the Microsoft WinDBG or gdb. - Microsoft vm2dmp: As previously described, this tool can convert select Microsoft Hyper-V memory files into crash dumps (depending on the size of the memory and version of Hyper-V server).
- Volatility imagecopy: The
imagecopyplugin can copy out a raw memory dump from any of the following file formats: crash dump, hibernation file, VMware, VirtualBox, QEMU, Firewire, Mach-o, LiME, and EWF. - Volatility raw2dmp: The
raw2dmpplugin can convert a raw memory dump into a Windows crash dump for analysis with Microsoft’s WinDBG debugger.
Given the available choices, you should be well equipped to convert to or from any of the file formats you might encounter. Also, keep in mind it might be necessary to perform a two-step conversion to reach your end goal. For example, if you receive a hibernation file and need to analyze it in WinDBG (which accepts only crash dumps), then you can convert it to a raw format first and then from raw into a crash dump.
The following commands show how to use the Volatility imagecopy and raw2dmp plugins. They both take an -O/--output-image option that specifies the path to the destination file. To convert a crash dump (or any other format) into a raw memory sample, use the following:
$ python vol.py -f win7x64.dmp --profile=Win7SP0x64 imagecopy -O copy.raw
Volatility Foundation Volatility Framework 2.4
Writing data (5.00 MB chunks): |........[snip]........................|
To convert a raw memory sample into a crash dump:
$ python vol.py -f memory.raw --profile=Win8SP0x64 raw2dmp -O win8.dmp
Volatility Foundation Volatility Framework 2.4
Writing data (5.00 MB chunks): |........[snip]........................|
The amount of time it takes for conversion depends on the size of your source memory dump. You should see an indication of the progress printed on the terminal for each 5MB chunk written to the output file.
Volatile Memory on Disk
Volatile data is often written to non-volatile storage as a matter of normal system operation, such as during hibernation and paging. It’s important to be aware of these alternate sources of volatile memory, because in some cases it might be your only source (for example, if a suspect’s laptop is not running when it’s seized). In fact, even if its running and you can acquire memory from the live system, you might want to recover these alternate sources of volatile data. They might provide valuable evidence of what happened on the system during other time periods or pages of memory that were paged to secondary storage, which you can use to correlate with current activity.
The following scenario covers the technical aspects of where to locate volatile evidence on disk and how to extract it. Forensic imaging (duplication) of hard disks is beyond the scope of this book, as are the steps for maintaining proper chain of custody for the evidence. Thus, we assume that you’ve taken care to research and abide by the laws in your jurisdiction, if applicable to your investigation. Also, although there are various commercial GUI products such as EnCase and FTK that provide point-and-click methods of extracting files, we focus on using The Sleuth Kit (http://www.sleuthkit.org) because it’s open-source and available to everyone.
Recovering the Hibernation File
If available, a system’s hibernation file will exist at hiberfil.sys in the root directory of the C: partition. Assuming that you have a raw image of the disk (image.dd in the example), you first need to identify the starting sector of the NTFS partition. To do this, you can use mmls in the following manner:
$ mmls image.dd
DOS Partition Table
Offset Sector: 0
Units are in 512-byte sectors

     Slot    Start        End          Length       Description
00:  Meta    0000000000   0000000000   0000000001   Primary Table (#0)
01:  -----   0000000000   0000002047   0000002048   Unallocated
02:  00:00   0000002048   0031455231   0031453184   NTFS (0x07)
03:  -----   0031455232   0031457279   0000002048   Unallocated
As shown, the starting sector offset is 2048. You’ll provide this value as the -o parameter to other The Sleuth Kit (TSK) utilities, such as fls. Remember, different disks will have different offsets, so 2048 is just the value for our example case. In the following command, you can see how to filter the output from a file listing on the root directory of the NTFS partition.
$ fls -o 2048 image.dd | grep hiber
r/r 36218-128-1:       hiberfil.sys
The inode, or MFT number in this case, is 36218. Now all you need to do is supply the sector offset and the inode to the icat command in order to extract the file’s contents. Before doing so, make sure the destination media has enough free space to accommodate the hibernation file. The following command shows how to perform the extraction:
$ icat –o 2048 image.dd 36218 > /media/external/hiberfil.sys

$ file /media/external/hiberfil.sys
/media/external/hiberfil.sys: data
Now that you have recovered the hibernation file, you can begin to analyze it with Volatility. There is one caveat that we’ll explore next, regarding the ability to identify the proper profile.
Querying the Registry for a Profile
Often, you will receive evidence, such as a hard disk, without any details about the target system. For example, was it running 32-bit Windows 7 or 64-bit Windows Server 2012? You’ll need this information to select the proper Volatility profile. In many cases, you can simply run the kdbgscan plugin, but remember the debugger data block is nonessential and can be manipulated by attackers (see Chapter 3). If that happens, you’ll need a backup method for determining the system’s profile. In this case, you have access to the hard disk, which contains the registry hives, so you can leverage them to your advantage. The following commands show you how to extract the SYSTEM and SOFTWARE hives and then verify that you’ve recovered valid Microsoft Windows registry files.
$ fls -o 2048 -rp image.dd | grep -i config/system$
r/r 58832-128-3:      Windows/System32/config/SYSTEM

$ fls -o 2048 -rp image.dd | grep -i config/software$
r/r 58830-128-3:      Windows/System32/config/SOFTWARE

$ icat -o 2048 image.dd 58832 > /media/external/system
$ icat -o 2048 image.dd 58830 > /media/external/software

$ file /media/external/system /media/external/software
system:   MS Windows registry file, NT/2000 or above
software: MS Windows registry file, NT/2000 or above
After you dump the appropriate hive files, you can analyze them with an offline registry parser. In this case, we use reglookup (an open-source tool from: http://projects.sentinelchicken.org/reglookup). In particular, you can look for the ProductName value in the SOFTWARE hive and the PROCESSOR_ARCHITECTURE value in the SYSTEM hive, as shown here:
$ reglookup -p "Microsoft/Windows NT/CurrentVersion"
     /media/external/software | grep ProductName
/Microsoft/Windows NT/CurrentVersion/ProductName,SZ,Windows 7 Professional,

$ reglookup
    -p "ControlSet001/Control/Session Manager/Environment/PROCESSOR_ARCHITECTURE"
    /media/external/system
/ControlSet001/Control/[snip]/PROCESSOR_ARCHITECTURE,SZ,AMD64,
In the output, the target system was running Windows 7 Professional on an AMD64 processor. Thus, the profile would be Win7SP0x64 or Win7SP1x64. You could further distinguish between the service packs by querying the CSDVersion value in the registry.
Recovering the Page File(s)
We often ask students in our training class a trick question: If we asked you to recover the page file, where would you look? Almost everyone responds with C:pagefile.sys. Although this answer is not technically incorrect, it’s also not thorough because a Windows system can have up to 16 page files. Thus, you should always determine how many page files you have and where they’re located before attempting to acquire them. You can do this by querying the SYSTEM registry, as shown here:
$ reglookup -p "ControlSet001/Control/Session Manager/Memory Management"
      -t MULTI_SZ /media/external/system
PATH,TYPE,VALUE,MTIME
/ControlSet001/Control/Session Manager/Memory
Management/PagingFiles,MULTI_SZ,??C:pagefile.sys,
/ControlSet001/Control/Session Manager/Memory
Management/ExistingPageFiles,MULTI_SZ,??C:pagefile.sys,
The target system has only one page file so C:pagfile.sys happened to be the right answer in this case. The file path is shown twice, because there are two values: PagingFiles (available for use) and ExistingPageFiles (currently in use). If a system has more than one, you’ll see the full list of path names. Recovering the page file(s) from the disk image can be done like this:
$ fls -o 2048 image.dd | grep pagefile
r/r 58981-128-1:      pagefile.sys

$ icat –o 2048 image.dd 58981 > /media/external/pagefile.sys
Now that you’ve isolated the page file(s) from the disk image, you can move on to the analysis phases.
Analyzing the Page File(s)
If you recall from earlier in the chapter, some software tools that run on live systems can collect page files(s) at the time of acquisition. Whether you’ve used one of those tools or extracted the file(s) from a disk image, the options for an in-depth analysis of page file contents are relatively limited. Remember that a page file is just an unordered set of puzzle pieces—without page tables to provide the necessary context, you can’t determine how they fit into the larger picture. Acquisition and Analysis of Windows Memory by Nicholas Paul Maclean (http://www.4tphi.net/fatkit/papers/NickMaclean2006.pdf) initially described the possibility of supplementing raw memory dump analysis with data from the page file(s) to provide a more complete view of physical memory. However, for the most part, the practical implementations of this technique have been unverified or inaccessible.
HBGary Responder’s documentation states that it supports page file analysis. Also, WinDBG advertises support page file integration (see http://msdn.microsoft.com/en-us/library/windows/hardware/dn265151%28v=vs.85%29.aspx). Specifically, according to the documentation, you should be able to create a CAB file that contains a memory dump and page file(s) and analyze it with the debugger. However, a discussion on the OSR mailing list indicates that the claim is largely false (or simply outdated) (http://www.osronline.com/showthread.cfm?link=234512).
Although page file analysis is on our roadmap, at the time of this writing, you cannot perform such an analysis with Volatility. Thus, your best investigative options currently are those that do not involve context or structured analysis of the data—such as strings, antivirus scans, or Yara signatures. In fact, Michael Matonis created a tool called page_brute (see https://github.com/matonis/page_brute) that analyzes page files by splitting them into page-sized chunks and scanning each chunk with Yara rules. The default set of Yara rules distributed with the tool can discover HTTP requests and responses, SMTP message headers, FTP commands, and so on. As always, you can add to the default rules or create your own rule sets to customize the scans.
Let’s assume that you’re investigating the machine of a suspect who is accused of buying and selling controlled substances online. The suspect’s browser was configured not to cache content to disk and not to maintain a history file. Furthermore, the computer system was not running at the time of seizure, so all you have is a forensic disk image. By locating and extracting the page file(s), you hope to find some evidence of the suspect’s involvement in the alleged crime. You build the following Yara rule to assist your search:
rule drugs
{
    strings:
    $s0 = "silk road" nocase ascii wide
    $s1 = "silkroad" nocase ascii wide
    $s2 = "marijuana" nocase ascii wide
    $s3 = "bitcoin" nocase ascii wide
    $s4 = "mdma" nocase ascii wide

    condition:
    any of them
}
The rule named drugs will trigger on any page in the page file that contains one of the listed strings. The following command shows how to execute the scan:
$ python page_brute-BETA.py -r drugs.yar -f /media/external/pagefile.sys
[+] - YARA rule of File type provided for compilation: drugs.yar
..... Ruleset Compilation Successful.
[+] - PAGE_BRUTE running with the following options:
       [-] - PAGE_SIZE: 4096
       [-] - RULES TYPE: FILE
       [-] - RULE LOCATION: drugs.yar
       [-] - INVERSION SCAN: False
       [-] - WORKING DIR: PAGE_BRUTE-2014-03-24-12-49-57-RESULTS
       =================

   [snip]
        [!] FLAGGED BLOCK 58641: drugs
        [!] FLAGGED BLOCK 58642: drugs
        [!] FLAGGED BLOCK 58643: drugs
        [!] FLAGGED BLOCK 58646: drugs
        [!] FLAGGED BLOCK 58652: drugs
        [!] FLAGGED BLOCK 58663: drugs
        [!] FLAGGED BLOCK 58670: drugs
        [!] FLAGGED BLOCK 58684: drugs
        [!] FLAGGED BLOCK 58685: drugs
        [!] FLAGGED BLOCK 58686: drugs
        [!] FLAGGED BLOCK 58687: drugs
        [!] FLAGGED BLOCK 58688: drugs
        [!] FLAGGED BLOCK 58689: drugs
    [snip]
The number following the FLAGGED BLOCK message is the index of the respective page in the page file. Each page that matches a signature extracts in the working directory (PAGE_BRUTE-2014-03-24-12-49-57-RESULTS) named according to the index. You can then individually analyze the extracted blocks or, for a quick initial look at the data, just run strings against the entire directory, like this:
$ cd PAGE_BRUTE-2014-03-24-12-49-57-RESULTS/drugs
$ strings * | less

https://bitcoin.org/font/ubuntu-bi-webfont.ttf
chrome://browser/content/urlbarBindings.xml#promobox
https://coinmkt.com/js/libs/autoNumeric.js?v=0.0.0.8
Bitcoin
Getting
https://bitcoin.org/font/ubuntu-ri-webfont.svg
https://bitcoin.org/font/ubuntu-ri-webfont.woff
wallet
Z N
http://howtobuybitcoins.info/img/miniflags/us.png
http://silkroaddrugs.org/silkroad-drugs-complete-step-by-step-guide/#c-3207
Location:
you want to also check out Silk Roads biggest competitor the click
silkroad6ownowfk.onion/categories/drugs-ecstasy/items
http://silkroaddrugs.org/silkroad-drugs-complete-step-by-step-guide/#c-2587

[snip]
Despite the suspect’s attempt to minimize artifacts of his browsing history, you could still find evidence of the activity by examining the page file. The point is that it is much more difficult to hide or erase artifacts in memory as opposed to those on disk, especially when the OS transparently writes parts of the memory to disk during routine operations such as paging.
Crash Dump Files
Many systems are configured to write crash dumps to disk upon a BSOD. Thus, you might want to check for files created during previous crashes that might not have been deleted. By default, they’re saved to %SystemRoot%MEMORY.DMP; however, you can change the path by editing the CurrentControlSetControlCrashControl key within the SYSTEM registry hive. While you’re at it, also check the Windows Error Reporting (Dr. Watson) paths in the SoftwareMicrosoftWindowsWindows Error Reporting key of both HKEY_CURRENT_USER and HKEY_LOCAL_MACHINE. You’re likely to only find user-mode (rather than complete) memory dumps there, but they can still be a valuable source of volatile data during periods of system instability.
Summary
Acquiring physical memory accurately takes proper planning, robust tools, and adherence to best practices. Carefully consider your options based on the environment and specifics of each job before choosing a technique or software suite, because your analysis capabilities rely on successful acquisition. Also remember that memory evidence is often found on non-volatile media and it comes in various “shapes and sizes,” so to speak. Be aware of the different formats, how to convert between the formats (if needed), and the challenges that each type of memory sample presents.