
A P P E N D I X B
![]()
Profiling Drupal and Optimizing Performance
You don't usually need to worry about performance when developing Drupal sites and modules; instead, you should focus on clean, functional design and readability of your code. However, if your site experiences more traffic than usual or it somehow feels slow, there are ways to analyze and improve the situation.
User-Perceived Performance
When it comes to web sites, the perceived performance is key to user acceptance. In the words of Roy T. Fielding, a central figure in defining the modern web's architecture, user-perceived performance “is measured in terms of its impact on the user in front of an application. […] The primary measures for user-perceived performance are latency and completion time.”1
- Latency is the time between initiating a request on the client side and the first indication of a response.
- Completion time is the amount of time it takes for the complete request to be fulfilled.
Short latency is preferred for web browsers as they are capable of rendering the received content incrementally. The browser starts loading additional assets like images and JavaScript while parsing the incoming markup and can start rendering the page before images have finished loading. Latency is affected by the time a server needs to generate and send a response.
What Makes a Web Site Slow?
There are many reasons why a web site slows down over time; your aim should be to find the most important bottlenecks. Happily, Drupal is able to help out in common situations.
__________
1 Roy Thomas Fielding, “Architectural Styles and the Design of Network-based Software Architectures,” www.ics.uci.edu/~fielding/pubs/dissertation/top.htm, 2000.
First, you need to have a look under the skin of your beautifully designed site. Firebug allows you to analyze the bits and bytes coming from the server after hitting the return button. Look at Firebug's network tab in Figure B–1; the first row shows the request to the page you are currently viewing, and the rows below it are all additional requests automatically fired by the browser to retrieve CSS, JavaScript, images, and other resources. Hovering over a row shows a detailed breakdown of time spent on DNS lookup, connecting to the server, sending the request, waiting for the first indication of response, and receiving the data. In Figure B–1, latency is the time between “Started” and the end of “Waiting.” If that time is long, you either have a slow network connection or the server spends too much time generating the page (more on this later).
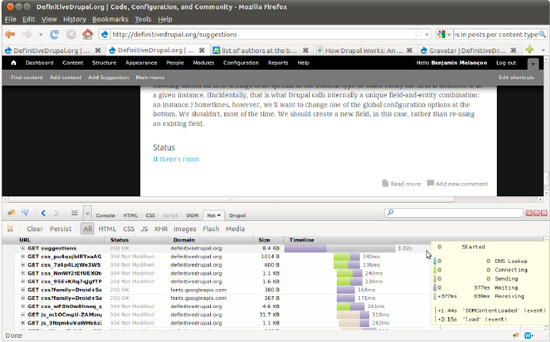
Figure B–1. Firebug net summary
Remember that rendering can start before all resources are fetched. Basically, it starts where Firebug shows the blue bar in the network timeline, which marks the point in time when the markup is completely parsed. You want this to be as close as possible to the time when your browser received the markup. Luckily, there are free tools that might give you some clues in case it is not. YSlow, a Firebug plug-in created by the engineers at Yahoo and available at developer.yahoo.com/yslow, can rate your site in different categories ranging from the number of HTTP requests to web server configuration options (see Figure B–2).
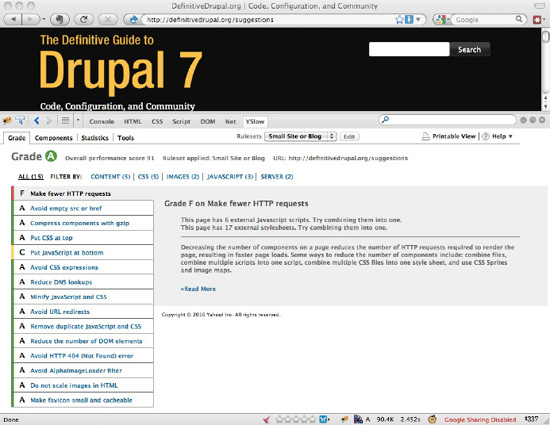
There's a wealth of information that can't be explained fully in this chapter, but here's what can be improved using vanilla Drupal: if YSlow gives you a bad grade in “Make fewer HTTP requests,” enable “Aggregate and compress CSS files” and “Aggregate JavaScript files” on the performance screen (navigate to Configuration ![]() Development
Development ![]() Performance in the administrative UI). JavaScript can't be automatically minified by Drupal, so these options make Drupal produce a few minified CSS files and a couple JavaScript files from all the CSS and JavaScript files provided by modules and your theme (and there can be dozens of each). Setting these options will earn you a better grade on the Minify CSS and JavaScript test. To learn more about these concepts, follow the Read more links to the YSlow documentation.
Performance in the administrative UI). JavaScript can't be automatically minified by Drupal, so these options make Drupal produce a few minified CSS files and a couple JavaScript files from all the CSS and JavaScript files provided by modules and your theme (and there can be dozens of each). Setting these options will earn you a better grade on the Minify CSS and JavaScript test. To learn more about these concepts, follow the Read more links to the YSlow documentation.
![]() Note Drupal does not aggregate CSS and JavaScript into one file each for a couple reasons. Primarily, this is because some files need to be included on all pages while some only need to be included on certain pages. This is an intentional change from Drupal 6, when you would see only one file per page, but might end up with a different huge aggregated file as you navigated to different pages. Now you will end up with more than two CSS files per page (aggregated every page and aggregated page specific) because Drupal creates aggregation files that respect the order in which CSS files are loaded, and divides its aggregation into groups to reduce the likelihood of requiring a different split and a new aggregation because of the addition of a conditional style. For JavaScript, header and footer output is aggregated separately, of course. To get maximum performance, you are free to change how Drupal aggregates with
Note Drupal does not aggregate CSS and JavaScript into one file each for a couple reasons. Primarily, this is because some files need to be included on all pages while some only need to be included on certain pages. This is an intentional change from Drupal 6, when you would see only one file per page, but might end up with a different huge aggregated file as you navigated to different pages. Now you will end up with more than two CSS files per page (aggregated every page and aggregated page specific) because Drupal creates aggregation files that respect the order in which CSS files are loaded, and divides its aggregation into groups to reduce the likelihood of requiring a different split and a new aggregation because of the addition of a conditional style. For JavaScript, header and footer output is aggregated separately, of course. To get maximum performance, you are free to change how Drupal aggregates with hook_css_alter() and hook_js_alter(). See also www.metaltoad.com/blog/drupal-7-taking-control-css-and-js-aggregation.
Another suggested technique is compressing page components with gzip on the server before transmitting them. This reduces download time at the expense of some overhead on the client side caused by the need to unzip the received data. Enable “Compress cached pages” only if your web server is not configured to deliver compressed HTML. Apache's mod_deflate can also be configured to compress dynamic and static content on the fly.
Real Performance
After reading all about speeding up transmission and rendering of content, you—if a PHP developer—are probably eagerly waiting for the server-related stuff where youcan thrive. The Drupal and PHP developer communities have already produced many solutions for situations of high CPU usage, a very common issue for successful Drupal sites.
Page and Block Level Caching
In Chapter 5 of his dissertation2, Fielding describes the architectural constraints of Internet applications. “Cache constraints require that the data within a response to a request be implicitly or explicitly labeled as cacheable or non-cacheable.” Drupal has improved on meeting that requirement over the last development cycle and can now provide the correct HTTP headers to support caching reverse-proxies like Varnish. Note that it still features a built-in page cache solution for those who don't have access to that kind of additional resources. In many cases, the workload of a busy server can be reduced significantly by turning on page caching or adding an intermediary cache. This is especially true if the bulk of the traffic comes from anonymous visitors. Page caching can be controlled in the Development section of the administration interface (see Figure B–3).
__________
2 Roy Thomas Fielding, “Architectural Styles and the Design of Network-based Software Architectures,” www.ics.uci.edu/~fielding/pubs/dissertation/rest_arch_style.htm, 2000.
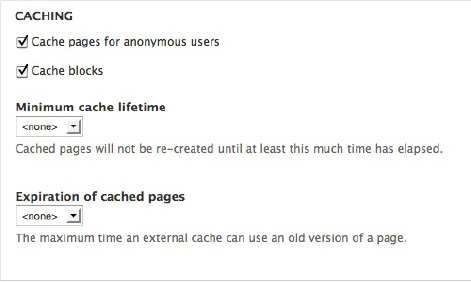
Page caching is not an option, though, for logged in users because Drupal pages contain elements that are customized to individual visitors, such as a display of their user name or their level of permissions. It still makes sense to cache the results of resource-intensive algorithms and database queries using Drupal's simple yet powerful cache API described in Chapter 27. Drupal blocks can be cached by means of the block API, which leverages the cache API. But how do you know what needs to be cached on a complex site? The first rule is: don't guess! Find out in a systematic way using adequate tools.
Profiling Drupal, a Primer
After identifying a slow page on a Drupal site, a common approach is to look at the devel query log to identify slow queries on that page. However, what do you do if devel says the following:
"Executed 39 queries in 9.66 ms. Queries exceeding 5 ms are highlighted. Page execution time was 210.19 ms"
This means that 200ms of the page generation was spent doing things in PHP, not in database queries. Drupal itself doesn't offer any clues for breaking down that 200ms, so you should consider using a code profiler. The two most common profilers used with PHP are xdebug and xhprof.
- xdebug is currently easier to install and is often enabled on local development environments already (
http://xdebug.org). - xhprof has lower overhead when enabled or profiling, plus it offers easy access to memory usage per function (
https://github.com/facebook/xhprof).
For this example, we'll use xdebug and webgrind—a free web-based GUI for examining the callgrind data available from https://github.com/jokkedk/webgrind that should work on any server with xdebug and PHP (i.e., any server that can profile a Drupal site). Note that the same information can be gained using xhprof and its own web-based GUI. You'll need to install xdebug and webgrind if you haven't already; see their web sites for documentation.
The page we'll profile is admin/configs; slow performance on this page is very unlikely to be the cause of overall site slowness, but it's a page you are likely to visit thousands of times as a Drupal user, so it makes sense for it to load reasonably quickly. For this example, I downloaded Drupal 7.0, copied the profiles/standard to profiles/foo, did a find and replace for function names, and installed using the foo profile.
Now, disable devel module and set xdebug.profiler_enable_trigger=1 in php.ini, then request the page again your browser using admin/config?XDEBUG_PROFILE=1.
If everything is set up correctly, you should see a cachegrind.out file listed in webgrind, the output of which should look like Figure B–4.
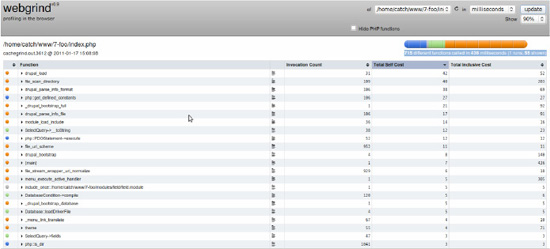
Figure B–4. Webgrind view of a profile produced by xdebug
You can see that webgrind reports 715 different functions called in 436 milliseconds (1 runs, 85 shown). Note that there is significant overhead to profiling with xdebug, so a page taking 436 milliseconds during profiling when devel just said 210ms isn't unusual.
It helps if you understand the table headings.
- Function is the function that was called.
- Invocation count is the number of times that function was called during the request.
- Total self cost is the time spent within that function, not including any functions it calls.
- Total inclusive cost is the time spent inside the function, including any functions it calls and any functions called from those functions, etc.
The default sort in webgrind is by “self” cost. At the top is drupal_load() and it takes 9.59% of the request by itself and 12% including child functions. However, the page won't load at all if modules aren't loaded, so it's unlikely this is going to be easily optimized; also, 12% of the request leaves 88% unaccounted for.
However, just below that, file_scan_directory() takes 9.21% of the request itself and 46.64% including child functions. 46% of this request is a full 200ms, so this could be the culprit!
The first thing to do after finding a likely culprit is to profile the page a second time. Often slow operations like file system scans in Drupal are cached, and if a page is slow even on a cache miss, it's usually best to optimize the uncached functions first by improving algorithms or adding caching.
In this case, though, repeated profiling of the page always shows file_scan_directory() and it's consistently just under 50% of the whole request. Note that file_scan_directory() is a low-level function, called by 18 different functions in Drupal 7 core, so it's now time to look at the function detail to see where it's being called from (see Figure B–5).
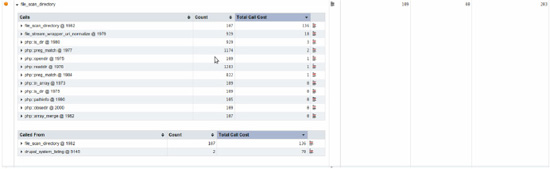
Figure B–5. Webgrind displaying a call hierarchy
From here, you can follow the chain upwards: drupal_system_listing() is called by drupal_required_modules(), which is called by install_profile_info(), which is called by system_requirements(). Note that drupal_required_modules() also calls drupal_parse_info_file() 47 times, taking 88ms on this request.
At this point, it's time to open up your favorite editor to see why we're calling install_profile_info() from system_requirements(). Here's the relevant code for Drupal 7.0:
  // Display the currently active install profile, if the site

  // is not running the default install profile.

  $profile = drupal_get_profile();

  if ($profile != 'standard') {

    $info = install_profile_info($profile);

    $requirements['install_profile'] = array(

      'title' => $t('Install profile'),

      'value' => $t('%profile_name (%profile-%version)', array(

         %profile_name' => $info['name'],

         %profile' => $profile,

         %version' =>$info['version']

    )),

      'severity' => REQUIREMENT_INFO,

      'weight' => -9

    );

  }
So in this case, we're scanning directories and parsing the install files of 47 different modules to get the name and version of the currently installed profile. Seems a bit of a waste, doesn't it!
Since this is a real performance issue in Drupal 7.0, it also has a real issue in the issue queue. Go to drupal.org/node/1014130 to see how it might be fixed.
Slow Database Queries
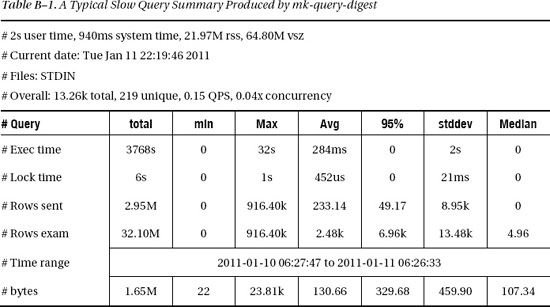
Second rule: unless you are particularly concerned about improving a limited part of your code, look at the big picture. More often than not, a high server load is caused by heavy database usage. Not all queries to the database are equal, however, and some will take much more time and resources than others. But you need to identify the troublesome queries in order to deal with them. If you are using MariaDB/MySQL or PostgreSQL, you can use the database server's slow query logging facility to write queries to a file that run for more than a configurable amount of time or that don't use indexes properly. Still, you need a statistics tool that tells you how often a slow query is executed in a given period of time and how much time it is consuming over all. It won't help much to optimize an especially slow query that is only run during cron executions and isn't affecting visitors at all (or only marginally). We've been using mk-query-digest from the Maatkit tools (www.maatkit.org) for some time now.
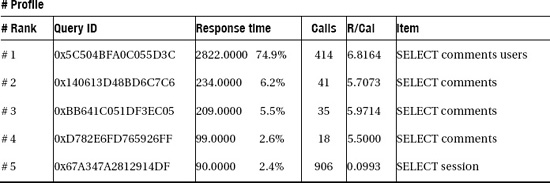
Table B–1 shows a typical slow query summary produced by mk-query-digest. The header shows some overall numbers and the time range, and the profile part lists the slow queries by response time. Each query listed in the ranking is shown in detail. If you want to know which part of Drupal is firing the query, you can use the devel module, which can log all queries executed and display them along with the containing function. For an in-depth explanation, check out www.maatkit.org/wp-content/uploads/2010/03/query-analysis-with-mk-query-digest.pdf.
This kind of analysis gives a site-wide performance assessment; by addressing those queries, the server load can be reduced considerable in many cases, thereby enabling the server to handle much more traffic.
Even if everything is configured perfectly and caches are used to the utmost extent, traffic may grow and outpower even the best server. Don't worry—Drupal has options if your main bottleneck is the database. If you have many SELECT queries splitting the load over two or more servers, using replication can improve the situation. Typically, you would set up separate servers dedicated to running a database. Setting up database replication is beyond the scope of this book but there is excellent documentation available for MySQL at dev.mysql.com/doc/refman/5.1/en/replication-howto.html and PostgreSQL at www.slony.info/documentation/2.0/tutorial.html. In order to make Drupal use one or more slaves, you have to add database configurations to your settings.php, as shown in this example:
$databases['default']['slave'] = array(

 'driver' => 'mysql',

 'database' => 'dgd7',

 'username' => 'root',

 'password' => 'AY7qiKol',

 'host' => 'localhost',

 'prefix' => '',

  );
Replication support also makes sure queries are intelligently split between master and slave databases. When you have just edited a node, the next query that will fetch data to view your changes will be sent to the master because the slaves might have stale data.
Summary
While there are many ways to improve the speed of pages of your Drupal site, there's no one-size-fits-all solution. Tuning your server only makes sense if there's really a bottleneck on that end. Always try to identify the bottleneck causing the biggest impact. And last but not least, the easiest way to a smooth-running site is a simple design: don't overload your site with features (the warning sign is a growing number of modules). More resources as authors or readers come up with them will be posted at dgd7.org/profile to help keep you up to speed.