2. Access to Data—Too Often Taken for Granted
Getting to Data: Historical Models and Patterns
Here is a history of the Business-IT relationship in the realms of marketing and sales that more or less describes the average experience. Most firms will fall into a classic bell-curve distribution around this mean of the truth. Try to place yourself and your organization in this range to assess how much work is ahead of you to get to the data access you need.
The Paleo-Analytic Era
For most of the twentieth century, sales and marketing executives used relatively less accountable channels (including TV, print, radio, and events) to stimulate awareness, help somewhat more accountable channels (including direct mail and outbound phone) to generate leads, and then (directly or indirectly) drive sales. Because the less accountable channels used for “brand-building” didn’t generate much data (aside from focus groups and ratings services), the executives managing them didn’t need to be as numbers-oriented. Also, because of the lack of data on the impact of spending in these channels, there was more emphasis on buying these media as cheaply as possible. This meant volume purchases, through, for example, the spring “upfronts” that television networks use to sell ad time on their featured properties in the following fall. With media commitments locked up in advance, there were fewer degrees of freedom for tuning marketing efforts through these channels. And, with fewer adjustments, there were fewer opportunities to observe causes and effects and learn from them—which further reinforced limits to the development of data-oriented management. So the cycle went, for a long time.
On the direct marketing side, things were only a little better. Yes, we could record the productivity of calls and mail, and even, to a certain degree, the effectiveness of print ads and “Direct Response Television,” with dedicated phone numbers (“Operators are standing by!”). But since information technology was relatively expensive, we tended to organize and support these efforts in silos to optimize efficiency. And with numbers viewed as unsexy among marketers, we isolated the people who tended businesses based on them, and the machines that churned those numbers out, often in suburban office parks where land or rent was cheaper and well away from the urban offices where debates about “the brand” took place.
Meanwhile, in many places IT organizations grew up in the finance function. So, even as IT staff managed an enabling capability, it also meant they frequently approached this capability from a perspective of “making the numbers tie” and from an inclination toward control, security, and efficiency—not necessarily openness and availability. Also, unlike sales and marketing, where “making the numbers” is a regular, perpetual source of pressure, IT as part of finance did not (ironically) face the same existential consideration; rather, it just had to live within its budget. Finally, IT was an arcane thing outsiders didn’t understand, and its managers could seek refuge in that when inquisitors got too close. A senior media executive once ruefully expressed frustration to me about how, when he would probe software engineers in the IT department to try to understand why something wasn’t working, was late, or over budget, “They would ‘black box’ me”—meaning they would answer questions using sufficient technical jargon as to make any insight and help from the business side impossible. This allowed the process of providing information to be dominated by an engineering mentality biased for emphasizing solid infrastructure, data quality, and governance foundations, versus repeated application and results. For transaction systems, this is good. For analytic applications, and for customer-facing sales and marketing interfaces that must constantly re-invent themselves to move customers toward those transactions, it’s not.
The Meso-Analytic Era
By the late 1980s, more forward-thinking executives started to look across individual call and mail campaigns to track return on investment at the customer relationship level. This spawned consulting “thought leadership” and products that together comprised the CRM boom of the early 1990s. The core enabling capability at the heart of the trend was the Data Warehouse, linking customer information with sales results where possible. However, software licenses for Data Warehouse tools were expensive. Features bought crept beyond features needed. Integration challenges (for example, reconciling geographic territory definitions, such as “city” versus “Metropolitan Statistical Area”) drove complex, lengthy, and therefore also expensive implementations. These attributes, along with increasingly shorter patience for results in the Age of the Leveraged Buyout, meant that a lot of Data Warehouse implementation efforts collapsed under their own weight. (Bain & Company partners Darrell Rigby and Dianne Ledingham described this dynamic very well in a 2004 Harvard Business Review article.1) These negative experiences had the effect of driving “business” and IT executives back to their own respective corners. Once again, without the tools to drive business results, and without the opportunities to learn how to use and apply them, business executives mostly didn’t develop data skills. And IT executives, often without close relationships with business executives to connect them to specific users and use cases, tended to build highly generalized infrastructures, abstracted to anticipate a much broader range of requests than they would likely see, and generally taking too long to address specific opportunities when they presented themselves.
1. Darrell K. Rigby and Dianne Ledingham, “CRM Done Right,” Harvard Business Review, November 2004, accessed at http://hbr.org/2004/11/crm-done-right/ar/1.
The Ceno-Analytic Era
By the mid to late 1990s, businesses were discovering the Internet. Three relevant patterns emerged. First was the rise of the “pure play” online firm. A whole new generation of sales and marketing executives grew up knowing nothing other than a data-rich, and therefore data-driven, environment. Second was the rise of “bolted-on” digital business units at traditional firms. These online adjuncts were often organizationally separated and physically isolated from the traditional elements of the business, and so they were able to cultivate cultures more removed from traditional “anti-data” biases. As these divisions grew at several times the rates of their traditional counterparts, they too created more (and more accelerated) career opportunities, both for younger, internally grown executives as well as recruits from the pure plays. Third, direct marketing became digital—primarily through the email channel.
Many of the primary data sources across all these groups were also, crucially, not provisioned by IT, though IT of course did play a selection and implementation role (for example, by page tagging). Rather, they came from web analytics and marketing automation providers who, in many if not most cases, provided their products as hosted, SAAS (Software-as-a-Service) solutions provisioned through browsers (think Google Analytics or Adobe SiteCatalyst, for example, on the analytic front; think vendors like Marketo, or even social media partners such as LinkedIn and Facebook, on the marketing execution front). SAAS provisioning made it possible to move faster and less expensively, since these vendors were already well ahead on the learning and scale curves for implementing the technology “stack” underlying their tools.
Modern Times
Finally, time and a now-critical mass of business through digital channels have begun to do their jobs. In many industries, these channels now predominate target segments’ “experiences” across the pipeline. And, a new generation of senior leadership has grown up building and running these digital channels. Together, these two factors have moved data closer to the fore of marketing and analytics decision-making.
There’s still room to go, however. Remember Talbots’ Rob Schmults’ earlier example: “If you go to a manager of a physical store,” he says, “and you ask her, ‘How’s business?’ she’s unlikely to answer, ‘Well, our project to deploy talking price tags is on schedule!’” What he means is that in many cases, if you ask this question of a manager of a digital channel, you’re as likely to get an answer that has to do with the capability as you are an answer about the result. He attributes this to the fact that many of the senior business people now leading digital channels and businesses started out as managers of construction projects, on virgin virtual land.
Why does the “capability-builder” bias that Rob described matter? Building a marketing and sales capability in general, and improving data access in particular, is, in a reality we often miss, ignore, or deny, an organic process involving real people—not a mechanical one, as the executives who manage it are most likely to see it. The experiences I described above roll up into values—beliefs about how the world works (and doesn’t)—which collectively form cultures. Working in an “If-we-build-it-they-will-come” culture is very different from one governed by objective, quantitatively expressed feedback loops. One of the features of the “Age of Analytics” is the ascendancy of these loops—the notion that decisions about what to build for a business or show to a prospective customer need to be informed by clear accountability to performance and cost. With feedback available as frequently as daily and even (through vendors like Chartbeat) in real time, even “build-oriented” executives are drawn to data like moths to the flame. And this availability then tends to set the bar for what the business expects IT to provide elsewhere.
Moving Forward
There are two ways to change cultures. One is to swap in people with the values you want. As David Norton says of his former boss, Gary Loveman, “When your CEO has a Ph.D. from MIT, it kind of sets the tone for the direction of the firm and helps the analysts there feel valued.” The other is to change the experiences of the people you have, to re-shape their values. At La-Z-Boy, the CIO reports to Doug Collier, the CMO (an admittedly highly unusual structure that has much to do with Doug’s abilities and his relationship with the CEO). This provides IT with a fully accountable seat at the marketing function’s table.
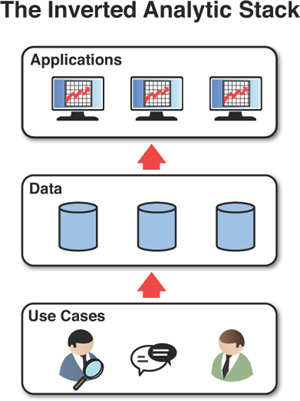
Assuming you are predominantly down the second path of “dancing with them that brung you,” what all this means—and this is a core point of this book—is that the typical “platform-first” way IT thinks about supporting analytics for marketing and sales (at least, if not other functions of the business as well) needs to be turned upside down. The first, bottom layer of any analytic “stack” for marketing and sales needs to be a collection of specific challenges and opportunities to pursue, and questions and tests related to them, ideally generated through the frameworks we suggest in Part II, “Practical Analytics: Proven Techniques and Heuristics.” The next layer up is a very general description of the data and data relationships necessary to answer these questions and support these tests, and, crucially, a plan for when you’ll need this information and how much you can afford to spend on it, given the potential value of the different things you’re pursuing. Only then should you start talking data models and logical system architectures. Figure 2.1 describes this graphically.
Lenovo’s “Analytic Maturity Model”
Lenovo’s Mohammed Chaara suggests proceeding through an “analytic maturity model” that has these very properties. He says, “I start by working with the data that’s already available. I actually avoid contact with IT at this stage.” He does so because he observes that IT is typically resource-constrained and it makes more sense to see if there’s a good case for investing in bigger infrastructure and better data to support an opportunity. Mo believes that “Any good analyst can extract value from dirty, incomplete data, at least enough to get a sense for whether there’s value worth pursuing further.” If there’s a reason to continue, Mo’s second analytic maturity stage is about further understanding the issues that come with the relevant data. These might include, for example, needs to reconcile master data hierarchies, or perhaps privacy constraints that will need to be imposed and administered (and perhaps audited) regularly. With these management requirements come governance needs as well. Emerging from this stage with clear requirements then allows Mo to proceed to a third stage, where IT can be productively engaged and focused on how to deliver against these requirements. Mo observes that the typical approach is exactly the opposite. Conversations start with, as he puts it, “foundation-planning”: Often led by IT, the firm first inventories the data it has, and then determines how this data should be defined, physically maintained, and governed. Only once the foundation has been established is the storefront opened. Mo observes that, however, “The problem is that nine months later, you have nothing to show for it, in terms of any business insight or result.”
Sharp-eyed readers will observe that in this case, Mo’s analytic team is sufficiently sophisticated about data management and governance issues to be able to play a hybrid business/IT role, effectively playing the part of a team of business analysts that might typically be the tip of the spear for an IT organization. However, the difference here is that by organizing itself as a “Center of Excellence” growing out of the “business” side of the organization, the “tribal DNA” of the group orients itself first toward solving specific problems and filtering for the ones that have sufficient value to be worth supporting more robustly. Business analysts coming out of IT, in my own experience and that of others who addressed this issue for this book, rarely start there. They tend to “take orders” to explore the data implications for a business opportunity without clear vetting of that opportunity. This is true even if there is a “business case” form involved in submitting the order; often the authors of those business cases are either not well analytically supported or they are not impartial.
Building the Data Warehouse
To summarize, the bottom layer/first stage described previously is typically called “requirements gathering.” However, the ways functional and technical requirements have traditionally been expressed have focused more on features, specifications, and (occasionally) performance, not on capturing and tightly linking the business needs—users and use cases—these are meant to support. Buried in the second edition of what is widely accepted as the bible on the subject, Ralph Kimball’s The Data Warehouse Toolkit, in the middle of Chapter 16, is a section titled “Common Data Warehousing Mistakes to Avoid.”2 Woven throughout the ten mistakes listed there is a common theme: De-coupling data warehouse development from cheek-by-jowl participation in solving real business problems is a recipe for disaster.
2. Kimball, Ralph, and Ross, Margy, The Data Warehouse Toolkit, Wiley: 2002, p. 366
The stakes for getting this wrong are higher than ever. The data sets are bigger, their sources and quality are more varied, the holy wars among advocates of different technologies for wrangling them are nastier, and so governance has gone from something that could move on its own schedule to something that needs to work, practically, and now. So how do you build a data warehouse today, in a way that simultaneously addresses, on the one hand, exploding volume/variety/velocity, and on the other, the fluidity with which business opportunities that depend on data-driven insights appear and vanish?
Today, answers to this question might start with, “Well, first you implement Hadoop to store and summarize your data, and then you use Hive to query it...” We’ll get to what’s relevant about the technology in a moment. But the first order of business is to think carefully about the data you actually need. The following story illustrates the dramatic difference this can make.
The BENS “BRN” Story
In 2004, Ern Blackwelder, a friend and former colleague, was working at a Washington, DC-based non-profit called Business Executives for National Security (BENS). BENS was asked by the Democratic National Committee to help set up a “Business Response Network” (BRN) to support the security and disaster recovery needs of the 2004 Democratic National Convention in Boston.3 The BRN collected commitments from large local businesses to provide relevant people and assets to the Massachusetts Emergency Management Agency (MEMA) in case of a large-scale disaster following, say, a terrorist attack (for example: the aftermath of blowing up the weekly liquid natural gas (LNG) tanker shipment that comes into Boston Harbor). Rather than having the Department of Homeland Security purchase, transport, and stage emergency response assets such as trucks, generators, bulldozers, office space, and communications equipment, the idea was to pre-enlist local businesses with these assets, pre-negotiate liability limitations, and pre-register relevant assets so they could be brought to bear if needed.
3. Peter J. Howe, “State Firms Form Groups For Disaster Response,” Boston Globe, July 24, 2004, accessed at http://pqasb.pqarchiver.com/boston/doc/404922349.html.
The idea presented two major challenges. The first was creating a unified, up-to-date database to register and track thousands of committed assets. Different firms had “asset management systems” of different maturities (some were highly digital and tracked the location of, say, a truck with GPS-enabled transponders; others used paper based systems akin to library cards). The second was that BENS had six weeks, and a five-figure budget, to get the job done.
There’s a saying: “You can have good, quick, and cheap. Pick two.” However, the saying assumes scope is given. The BENS team re-thought the problem. What Ern and his colleagues realized was that they could parse what it meant to track commitments. So, they created three categories of assets. For the first, merely having contact information for the people responsible (say, a primary and one or two backups) for them would be sufficient. BENS didn’t—or practically, couldn’t—track the quantity and location of these assets. However, a text, email, or phone call to a responsible person could summon them readily, so that didn’t matter. For the second category, BENS added a “main location,” with directions and access instructions, to go along with the contact information for responsible parties in case direct and immediate access was necessary. And for the third group, in the case of unique, specialized equipment (certain HAZMAT equipment, for example), BENS registered not just the general descriptions of the available assets, but checked and updated their specific locations at regular intervals.
This approach had several advantages. First, and most important, it vastly reduced the amount of work needed by the companies participating in the BRN to provide the necessary information initially and to keep it fresh. Second, it reduced the amount of work needed by the BENS team to take in and administer this information. And third, it reduced the cost and complexity of the technology footprint needed to support the effort, to the point where the whole thing could be implemented in a matter of days and for a few hundred dollars through one of the early, cloud-based database services of the day, by technically competent but not necessarily expert businesspeople on the team. The punch line: The BENS team was able to recruit and register commitments worth $300 million from over two dozen firms in less than three weeks, well within its budget—a tiny fraction of what it would otherwise have cost to provide this degree of support if they hadn’t re-scoped the requirements of the service.
What can we take away from this? The database created by the BENS team had very specific use cases informing it. The design of the database considered very carefully the tradeoffs between the marginal value of different types of information about assets and the costs, direct and indirect, of providing and maintaining that information. And finally, the database was created by people whose understanding of the challenges at hand was deep enough to allow them to “wrangle” the necessary technical requirements to a simplified, manageable scope—so much so that it entered the realm of something they could, with a little energy and willingness to Read The Manual, build the necessary solution themselves.
A common objection by experienced developers of data warehouses would be that hacks like this don’t scale across a broader range of needs, and that by not anticipating that breadth and engineering for it, it would ultimately be much more expensive to re-build the necessary solution. Today, with tools like Hadoop and cheap cloud-based infrastructure to run it on, one might well add, “Just store first and ask questions later.” This may well have merit. However, there is no scenario under which gathering requirements and prototyping them under the guidance of Einstein’s “Everything should be as simple as possible, but no simpler” dictum, within this little time and cost, and for so much immediate benefit, short-changes the future. Rather, it makes the future more likely, by giving it a foundational story, a business case, and a real-world sense of what’s actually needed for the task at hand.
Implications for Big Data Investments
So now let’s come back to Big Data. You may (and probably do) need a Big Data wrangling capability. Just don’t buy it on spec. “Govern” it with specific use cases. Fund and evolve it on shoestring budgets and time cycles. Evaluate it based on the demonstrated value of tests associated with the use cases you develop.
This is particularly important because a leading strain of thinking in the Big Data end of the marketing and analytics sales pool is to pursue what some call an “emergent” strategy. That is, assemble a big data set, then let the machines explore all the possibilities and tell you what relationships are significant. What the executives interviewed for this book have learned is that applying the “emergent” approach needs to be scoped and governed carefully by broader hypotheses. For example, one said (off the record in order not to leak a competitive advantage), “We developed a hypothesis that geography matters to marketing mix allocation because of A, B, and C. We started by validating that generally, through sampling. Then we asked, ‘Which aspects of geographies matter most?’ and pursued a machine learning approach for that, to generate models that can help us decide which geographies matter more for which decisions under different conditions.” A popular example of this balance, documented by Charles Duhigg in his book The Power of Habit and first reported in The New York Times,4 is Target’s marketing to expectant mothers. Framed by the question, “What do recent purchases by expectant mothers tell us they might like next?” statisticians there were able to identify relevant collections of products whose purchases communicated varying propensities to purchase other products, and target offers accordingly.
4. Charles Duhigg, “How Companies Learn Your Secrets,” The New York Times, February 16, 2012, accessed at http://www.nytimes.com/2012/02/19/magazine/shopping-habits.html.
One reason this careful attention to governance is necessary is because in the world of Big Data, pre-processing raw data to add meaning necessary for interpretation is typically a big part of the work to be done, and re-doing this pre-processing can sometimes be time-consuming. (The good news of course is that it’s now more practically feasible in technical and financial terms, compared with using conventional relational database management system (RDBMS)-based approaches.) Here’s an example: Let’s say you want to track trends in sentiment about your firm across a variety of social media, for later correlation with purchase trends. Through a variety of means (scraping, RSS, APIs, and so on), you slurp in a large stream of raw text. You use Hadoop to store it, and you write Hadoop MapReduce scripts to analyze and classify bits of raw text as “positive” or “negative,” along with placing them in time and adding other metadata like source, and context. Then you organize the processed version of this data, using, say, a NoSQL database—such as Apache HBase, or a commercially-supported alternative such as MapR’s M7, for example if you’re using the sentiment trend conclusions to drive automated real-time recommendations. This ends up looking like: “On June 25, person X on site Y said a ‘positive’ thing about us while discussing topic Z.” Then the data can be further queried: “What’s the trend in the number of ‘positive’ things said about us in sites like Y in the context of topics like Z during the summer?” One challenge here is that programmers need to learn new languages, like Pig, to run these queries. Another challenge is that if you want to apply a more nuanced range of meaning for sentiment—say, move from simply “positive” or “negative” to introduce “neutral”, for example—you need to redo the pre-processing of your raw data. This is getting easier as different Big Data vendors integrate their technology stacks—abstract away multiple programming layers and make everything run more efficiently—but it’s why it still pays to think a bit up front.
(Aside: What’s Big Data?)
Some common questions executives ask include, “What exactly is Big Data? Are there official volume and other thresholds for it? Does the data itself have any particular properties?” At this point, while many can point to drivers, such as volume, velocity of incoming data, and variety of sources it comes from, there are no clear borders.
Rather, Big Data is defined more by the experience of working with it. For example, if a query on a data sample takes hours to run on an enterprise-class implementation of a relational database management system (RDBMS), and further scaling that solution to larger sample or the full universe of relevant data would cost hundreds of thousands of dollars, then you may have a Big Data challenge that would benefit from newer, more relevant tools that scale much more cheaply.
A variant of this answer suggests the following triage:
• If you can load a relevant data set into your PC’s memory and run your analysis there using tools like Microsoft Excel or Access, with response times for your queries staying within a minute or so, you’re firmly in Small Data land. Pushed for a rule of thumb, experts would say data set sizes here would stay within a million records.
• If your analysis involves running queries against a single instance of a relational database consisting mostly of well-structured data, running on a single conventional server, or even a small cluster administered by a small team, and your response time for a typical query is still “reasonable” (let’s say well inside an hour), you’re still well within the boundaries of “conventional” data processing. Sizes of data sets managed this way can run to tens or even hundreds of millions of records—assuming they consist of well-structured data.
• Once your queries begin to take longer than this to run, you begin to lose analytic flexibility. Simply put, you can’t iterate as easily. At this point you are (at least in terms of the challenge) in the world of Big Data. To deal with it you have three choices:
1. Try to scale your conventional relational database infrastructure to keep up. However, this quickly becomes impractical in terms of cost, even if you can manage the complex IT administration logistics.
2. Migrate to sophisticated “appliances” from vendors such as Netezza (now owned by IBM) that integrate highly specialized combinations of hardware and software to keep performance within acceptable bounds.
3. Take advantage of a new generation of open-source tools (with varying degrees of commercial support), collectively referred to as “NoSQL.” These are spun out from technologies developed at Google, Yahoo!, Amazon, and Facebook; the common denominator across these technologies is their ability to harness massively parallel computing resources underneath them. Essentially, to scale their performance to larger and larger data sets, you simply keep adding processors for them to run on. Also, these processors can be provisioned as virtual machines running on cloud infrastructures for even greater convenience.
Supporting Ad Hoc Approaches to Defining Data Requirements
My friend Tip Clifton is CEO of Eastport Analytics, a boutique firm in Arlington, Virginia, across the river from DC’s Georgetown. He and his colleagues have developed some very sophisticated applications for helping the government track and catch terrorists and tax cheats. But arguably more interesting is the approach they take to developing these applications.
Tip describes two main insights that have driven their work. The first was inspired by his brother-in-law, an ophthalmologist: “The process for determining your prescription is iterative,” Tip says. “They keep flipping lenses in front of your eyes, and eventually you settle on strengths that allow you to see most clearly. Our approach to requirements is similar. In general, people are better at reacting than acting. So, we don’t ask our users to tell us what they want from the outset. Rather, we grab some data, and we iterate ways of presenting this information that most effectively answer their questions.”
The second insight relates to how they stage the data to do this. “Many of the modern visualization tools—Tableau and Spotfire are a couple of examples—allow you to create dashboards or workbooks that can simultaneously connect to multiple, independent data sources that can range from huge relational databases and web services to Microsoft Access databases and Excel worksheets. So, we don’t worry initially about creating a single physical data store—a data warehouse—for the ‘optometry exam.’ Rather, we construct a logical abstraction of a warehouse—we call it an Intelligence Repository. Basically it’s a neatly organized directory that points to the available data. We dump whatever hodgepodge our client’s got into that and prototype our solutions from that foundation. Once our users have a better idea of what they actually want, we can work on performance and data governance. But for our users, it’s sort of like plugging into an electrical outlet. When the bulb goes on, they don’t know, and mostly don’t care, whether the juice is coming from a portable generator or a nuclear power station. It’s just illuminating their work.” Consider how Tip’s firm’s approach generally, and the Intelligence Repository in particular, is complementary to the process Mo Chaara follows at Lenovo.
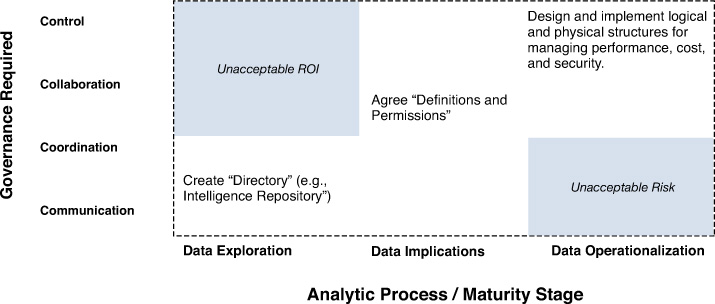
These experiences suggest that traditional “monolithic” IT approaches to managing data can be usefully unpacked into four levels: communication, coordination, collaboration, and control. At the simplest level, “communication,” governance can be as basic as registering the existence relevant data sets in a commonly accessible place; just as firms publish organization charts and floor maps, imagine if they also published basic directories of what’s collected and who has it. Next up, “coordination” implies that at minimum, two different groups don’t bump into each other unproductively as they separately work with a shared data set. For example, this could mean scheduling access times or making each other aware of conversations with relevant vendors that each might benefit from separately. Further on, “collaboration” can mean working together to make a bundled purchase of necessary data at a lower price, or even on agreeing on some common ways to define and organize data for mutual benefit. Finally, “control” means someone gets the final call on the definition and disposition of data. As shown in Figure 2.2, this four-level model reconciles business-driven opportunity exploration with IT-driven attention to foundation by defining expectations each might have of the other at different analytic maturity stages. Crossed with Mo Chaara’s analytic maturity stages, it can serve both diagnostic and prescriptive purposes.
Managing External Sources
These days much of the data you might like to include in your analysis is not on your servers but on some media partner’s (your agency’s, a social network, or a publisher if you’re working directly with one), a Software-as-a-Service provider’s (for example, Salesforce, Marketo, and so on), or is accessed from public sources (for example, economic series from the St. Louis Federal Reserve Bank5). Some of these organizations—typically agencies—may already be providing you with highly summarized reports in inflexible formats. If you ask for regular access to more granular data, they may try to charge you for that. In that scenario, you’re often better off offering to trade the (typically less useful) reports currently provided for the raw data, and then using more powerful data wrangling and visualization tools to allow you to re-build your old reports and extend them with additional dimensionality (that is, make them more “drillable” than before).
5. “FRED API,” St. Louis Fed Web Services, http://api.stlouisfed.org/docs/fred/.
As more branding dollars go to digital channels via trends such as “content marketing,”6 a good example of data you’re likely to want more often would be display ad impression and click data from ad servers. A typical Excel-based report you would get from an agency might simply summarize activity (impressions and clicks) in given periods, along with the budgets expended in those periods. But, for the purposes of attribution or other kinds of analysis, you might be interested in finer-grained dates and times, as well as more detail about the publisher, ad unit, creative, and other dimensions. Of course you’ll have to honor any privacy-related restrictions.
6. “Content Marketing,” Wikipedia, http://en.wikipedia.org/wiki/Content_marketing.
So far we’ve assumed you want to bring data from these external sources in-house. However, depending on the “center of gravity” sales and marketing channels for your business, it might be best to add your data to the analytical repository your partner provides, as long as you make sure you have the access to it you want. For example, in a business that uses primarily a direct sales model, and which uses a hosted “Sales Force Automation” solution like Salesforce.com, it might be most useful to simply add certain data (service data, for example) there if it’s not already in.
The common denominator in these scenarios is explicit, detailed discussion up front and on an ongoing basis with any vendor about access to (formats, service levels) and costs of data generated through the use of the vendor’s tools and services. At the same time, it’s important to come to some agreement with IT about a vision and roadmap for what must come in-house.
Some questions for discussion:
• You want to profile “near-converters” on your web site, so you can tune a re-targeting campaign for them that includes demographically appropriate messaging and product recommendations based on collaborative filtering. That’s three data sources: customer file, sales file, web analytics. What’s your starting point for this analysis? Choose from one of the following answers:
1. We have to source and integrate the data from the underlying transaction systems.
2. We have a data warehouse that combines the first and second sources, along with a highly-summarized version of the third that unfortunately tells us whether someone’s registered on our site, not whether they fall into a “near converter” cohort.
3. We have a highly advanced Big Data platform, and with about a day’s work we can generate a re-targeting list for use by our marketing teams.
4. Targeting near-converters with certain demographic characteristics and offering them discounts on related products based on surfing patterns and demographic profiles is an algorithm our machine-learning infrastructure has deemed promising through automated testing.
• Where along this spectrum do you feel your greatest leverage lies, based on similar specific use cases you think might have value and that you could feasibly implement with the team and resources you have today?
• Where do you feel you need to be in 12 months, and what market or competitive examples do you see that shape your thinking?