
Chapter 3
Leadership Express
This chapter will uncover the hidden secret of high-performance organizations. It is what their people do about the operating data that surrounds them, including daily and weekly measures. It blows away the myth that fully formed dashboards are the power station for success. Instead, managing people carefully with a detailed guidance system can yield amazing results.
WHY YOU NEED TWO SETS OF BOOKS
Successful leadership requires the split vision of Janus, the Roman god of beginnings and endings, whose two faces look to the future and the past. This simple principle may have the highest impact of anything in this book. It's a bit like a hummingbird: Look closely or you'll miss it. Business investors (including lenders and owners) use the same information as leaders but use it differently. Corollary: Measuring is not the same as leading, financial analysts to the contrary notwithstanding. Investors look back like physicians, answering the question, “How are we doing?” to measure health and forecast future outcomes from a flood of data in monthly or quarterly chunks. Their focus is risk, preventing a decline from planned outcomes (“normal”).
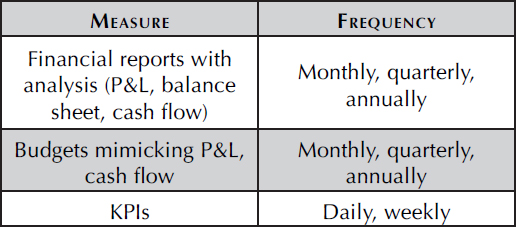
With all this complexity, how can data help a leader? The idea is to use the data in the right “time zone.” Monthly financials, for a leader, are useful only in three areas:
- Marking the limits that capital requires. Loan covenants and owner rates of return on capital are the fences that mark the limits of the playing field. Go past them at your peril.
- Tracking subtle change in the business model. Over time, profitability will either slide or grow. Sliding requires action to preserve cash; growth offers an opportunity to invest for further success (bonuses, hiring, equipment) or additional payout to owners.
- Maintaining adequate cash. Cash consumers such as inventory, slow receivables, or expenses can be checked monthly, like blood pressure, to spot needed correctives.
By now you notice that these are all “external” measures, lurking outside the flow of the business to provide warning lights calling for adjustment. The problem is that they say little about the business itself. Just as you wouldn't drive by the warning lights on your dash, you risk your business if you lead it based upon the data in your monthly financials. It really is too little and way too late because months of data are needed to reveal a trend that matters. Here's an example of how it looks:
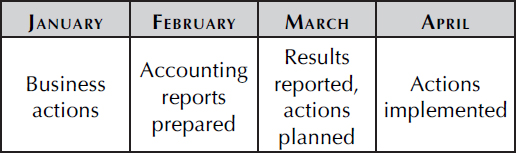
Yes, it's April before powerful reactions to January are implemented! Four months—one third of your fiscal year. That four-month lag never catches up and is a problem for all but firms with no growth and no change. So, what's a leader to do?
People who enjoy meetings should not be in charge of anything.
—Thomas Sowell3
Monday Dilemma
Every Monday morning, millions of workers enter their workplaces and decide what to do next. A frightening thought. The most important issue is not what they do but how they choose what to do. The noise of competing inbox requests, amplified by personal preference and cultural imperatives, is a powerful diversion from any plan or goal. That noise is as permanent as the light in the room, and as invisible.
Most folks want to do the right thing, but the noise obscures that “right thing” much of the time. One way to cut through the noise is to provide some structure to the minutes, days, and weeks. The outcome of a basketball game builds upon what happens in the minutes of the game. It's not about preparation, time-outs with the coach and chalkboard, and certainly not what the scoreboard or time clock says. It uses all these, but it's about what's done minute by minute in the game. The coach's job is to fill each minute with the right actions by his team. Your business is the same. How can you guide what happens minute by minute?
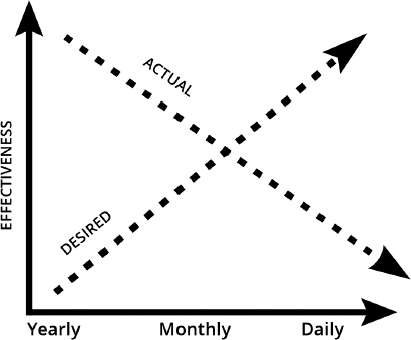
Leaders look forward, answering the question, “What can we do now?” A three-dimensional view explains some of the complexity of leadership. Not only does a leader look back and forward, but she also looks through multiple time dimensions in her job to plot a path and keep her organization on it. Leaders and their teams plan for years, measure in months, and work in minutes. Beyond the cliché about driving while looking in the rearview mirror, the leadership question really is, “What is useful in the pile of data in front of us?
Goal alignment is wrongly praised as the essential solution to this problem, as though an organization were static, like the linkage of engine/transmission/drive shaft/differential/axle/wheels in a car. Each part in a car moves, but it is restricted by its connections. Business has no such built-in restrictions, beyond individual ethics and culture. Alignment's false promise is that once attained, constructive linkage will guide the business to success.
Instead, the secret to alignment is to reverse directions: imagine the wheels telling the engine what to do! This is not a feeble plea for bottoms-up leadership, that somehow “the people know.” They do, in their limited perspectives, but self-directed teams failed by the end of the last century in a mix of power squabbles and deluded aim.
Instead of standardized work, provide a structure to answer workers’ questions:
- What is our goal?
- How are we doing?
- How am I doing?
- What needs doing?
And then leave space for them to do what's needed, providing help when necessary. The foundation of the system is to change from prescribing work in detail to reporting progress against a target that most employees want to reach.
The structure is a fabric that frames and reports results in minutes, days, and weeks, and builds in the actions needed next. In fabric-talk, it's the warp. The weft (cross-threads) of your fabric are the review sessions (RAM) that process the data and extract next actions in the sparest and clearest way. Both the data and the discussion require a surgeon's clarity and a coach's drive for action.
This system demands a fundamental shift from measuring success in months and quarters to measuring success in weeks. The core question becomes, “What will it take to make the week?” The principle is: Make the day; make the week; make the month. Repeat.
The numbers by themselves won't sustain excellence, regardless of the strength of the team. What sustains excellence is personal drive—the emotional push that wants to hit the target. What's the formula for that emotional push? It's KPIs + RAM = EP (emotional push).
YOU NEED METRICS TO TELL HOW FAST YOU’RE GOING
Metrics, or KPIs, are proudly brandished by most leaders. In my experience few leaders use them to guide the work of their people, missing the remarkable power of KPIs. There are three problems that block most of them:
- Measuring the wrong things in the wrong time periods.
- Believing that numbers alone will motivate people.
- Not quickly sharing for broad understanding.
Let's take a closer look at each of these.
Measuring the Wrong Things: Dashboard Dilemma
Picture the dashboard—of an airliner, perhaps? There is a dial or a light for just about everything on the plane except ordering a martini. Problem is, they are designed mostly to highlight problems, not to improve performance. For your business, that means reinforcing business as usual, tyranny by inbox, reaction to problems. There's little in there for improvement, raising the bar, or keeping up with competitors, let alone getting ahead of them. Not good, in a world whirling with change.
If you ask CEOs, as I have, most will tell you that their dashboard contains fifteen to twenty-five numbers. Most can't recall much beyond sales. Dashboards can be elaborate security blankets (Linus would love them) full of “just in case” numbers. They are dutifully calculated each month, and occasionally are the subject of a meeting. They are too many to remember, mostly provide needless analysis of monthly financials, and provide limited direction about what to do next (beyond “we need more cash”).
When fans enter a baseball park or basketball game (even in grade school), they reflexively check the scoreboard before sitting down. Don't you? This proves two things about most folks:
- They want to know the score.
- They want to understand the score.
Even though these are not the same (go back and read them again), KPI-builders across the country conflate the two, if more is better. That's not how scoreboards are designed, and not how people think. Proof: Recall your scoreboard—the score is in huge numbers, hard to miss. The analysis (number of team fouls, number of timeouts remaining, etc.) is in smaller numbers, sometimes not on all sides of the scoreboard, and so forth. Here's your test question: If you entered the gym knowing that you had to leave in sixty seconds because your car just burst into flames, what numbers would you want to see? If you chose number of fouls, see me after class. Of course not! It's the score!
If KPIs are scoreboards, shouldn't they be arranged to show the score first and the analysis second (in emphasis, size, noise, etc.)?
Believing that Numbers Alone Will Motivate People
Numbers alone aren't motivating at all, and more numbers don't deliver a power boost. If the point of KPIs is to guide the folks doing the work, instead of helping the CFO glow with pride, shouldn't the folks know what they mean? How will they know what the numbers mean, or what's good, unless there's a comparison with something? Doubt it? How many scoreboards have you seen where there is only one score (your team, let's say), so there's no way to tell who's ahead? The number occasionally means something (highest-scoring game, etc.), but usually it's the comparison that packs the punch.
For a worker to be moved by a KPI, these things are required:
- Workers understand the meaning.
- Workers can compare the current number to something (yesterday, goal).
- Workers can keep the number in their heads. Yes! Surprise! It's the same as fans talking about a game over a beer. They remember the score, and some of the plays that made it happen.
Mark Donegan, CEO of Precision CastParts ($500 million maker of specialty castings for airplane engines), is notorious for visits to company manufacturing sites. He'll invariably ask a machine operator, “What were our numbers yesterday?” The expectation is that any worker may be asked, and every worker knows yesterday's numbers, usually for the company and his unit. Workers who don't know their numbers give their supervisors the gift of Donegan's wrath. Isn't this the same as a basketball player or football player checking the scoreboard and the time clock? You're in the game or you're not. If you're in, the passion to do well explodes from the KPIs to the folks doing the work in each minute of the day.
Simple point: If you limit your KPIs to three numbers, your people can know them and take their game up a notch. What's at play is emotion, even more than rational numbers.
It's so simple that we miss it. Real numbers can keep us closer to reality and help us avoid making the next decision based upon our deeply held beliefs. In his book Thinking, Fast and Slow, Daniel Kahneman pictures the repertory of skilled responses that all of us build up over time. We access those responses quickly and automatically to answer a problem facing us. This works well so often that most of us have a lousy system of spotting an error when we make a judgment. Kahneman: “We would all like to have a warning bell that rings loudly whenever we are about to make a serious error, but no such bell is available.”1 So much is at stake at each stage of action in the business that our bias toward good news pulls us away from the problems that need rapid attention, and blinds us toward seeing news that's better than we expect.
Here are some guidelines to put punch in your KPIs:
- Design each to deliver maximum impact on profitability and customer satisfaction. Test your KPI: If this number improves, will your financials and customer satisfaction improve? If there's no clear link, go back and refine your KPI.
- Tie each number to a specific item on the monthly financials or customer satisfaction.
- Choose carefully and narrowly.
- Find a single measure that captures performance in many areas.
- Define precisely and publicly, in writing.
- Work through the definitions with the folks who will use them.
- Never use more than three measures.
- Measure and report daily.
- Roll up into weeks and months.
- Present the goal and performance in each report.
- Put these in front of every employee every day. This requires sharing bad and good news, which will boost morale remarkably.
At a manufacturing firm where I worked, we used that framework to design new KPIs. We tested them in several stages to be sure that they were accurate and consistently reported what we thought they were reporting. We presented them publicly in a three-month test to start to teach people how to use them and how to spot inconsistencies or sloppy meaning. The first full year we were live, operating profit jumped millions of dollars over the prior year. The result was so big that I didn't believe it, and I confronted the CFO about the reports. He said he'd already checked and rechecked and stood by his numbers.
Not Sharing Quickly for Broad Understanding
Without an umbilical to the people in the business, measures are decoration. KPI power comes from what people do about them. Harness this power by shoving essential KPIs in front of every employee every day. Forget about competition, security, union leverage, or any other laziness masquerading as protection for the business. If you paint your numbers on the side of your building, your competitor won't know what to do with them. If your key leaders ignore your bright new KPIs, set up company computers so when they boot up in the morning, the first thing they show is the latest KPIs. Your IT team will try to avoid it, but when it's done, your people will love it! Everyone wants to know “how we're doing.”
HOW TO SPEED UP BY SLOWING DOWN
The word on meetings is mixed but mostly negative. In the manufacturing firm mentioned previously (the one in which profit improved “millions”), we used ten-minute daily meetings for production team leads to review yesterday's KPIs. The production manager violently objected (no fighting or swearing, but about every other kind of objection). His view was that workers should be on the production floor operating their machines or the company was wasting time and the labor dollars to pay them (“I want to see those machines going up and down every minute!”). He calculated the cost per minute for the meetings to prove what a bad idea they were. His experience was that if he wasn't watching his workers, they'd slow down, make mistakes, and so forth. After we began to get the results mentioned above, I asked him if he was ready to cancel the meetings. He looked at me like I'd lost my mind: “Absolutely not!”
The system that delivered those results is far more than the numbers. Let's look at how we took the time to build that system and got added profit built on bounding energy and pride among the folks in the company. We spent time with all departments to choose the three most powerful KPIs to measure. “Powerful” meant influence on financial and customer results. The three we chose:
- Shipment units and dollars.
- Quality.
- Efficiency.
Crucial point: We measured at the shipping door, just before product left us for our customers. Earlier measures can be easier to make, but actions or accidents later in the process can change the actual results. After all, we bill our customers and book our shipments when they go out the door, not earlier. Remarkably, the easiest place to grab the numbers is often at the “back door” of your company. The focus can be restricted to counting, instead of other production activity.
All businesses are production businesses. There are customers, marketing, selling, orders, processes to prepare product for delivery to customers, actual delivery, billing, receipt of payment, and so forth. Some of the best techniques for assuring quality and efficiency have come out of the production world. Your product and your company are special and unique, but there's lots to learn from others.
To come up with the measures, we talked through each measure in small groups involving every employee. We worked through the definitions to come up with something that everyone could understand and support and showed examples of how they were calculated. No measure is immediately obvious to all employees, despite what you think. Here are examples:
Shipments. Are they counted when they arrive on the shipping dock, when they are palletized and ready to ship, when they are loaded on the truck, or when the truck departs?
Quality. Do you wait for customer complaints, as we did in the trash-hauling business? (Every customer whose trash wasn't picked up on pickup day will call. Every. One. Don't you?) In this rare case, we had nearly 100 percent information about the quality of our service because customers would immediately let us know about quality problems. If your customers won't call as reliably as trash customers, how can you know how you're doing? Start by insisting on a measure, and ask your customer-facing people what should be tracked. Quality measures in the production process are necessary for production control, but they are seldom enough for this metric. Here are some techniques to figure your quality KPI:
- As product is packed, check either all of it or a representative sample. Your quality team can provide a sampling framework for the reliability you seek.
- Track missed appointments.
- Wait for customer calls.
- Track customer complaints in your service center.
- Ask your salespeople to report every case of customer dissatisfaction.
Efficiency. This can be a measure of labor efficiency (units per labor hour or dollar) or of on-time shipment (or delivery). The on-time measure, if tracked accurately, can be a devastatingly correct measure of how well customers are served and how efficiently resources are used.
THE BLINDING SPEED OF LEVERAGE
Here is where the pieces of your leadership express system combine to provide leverage for remarkable results. You are building the measures-targets-adjustment (MTA) system described below, offering advanced guidance for your business. All your measures amount to little unless they help adjust the direction of the business. An unvoiced cliché is that good “planning” will frame the company's direction and keep it on the right heading. Not true. Especially not true when the direction and adjustments remain in the head of the leader.
At a printing company where I worked, the CEO doubted the benefit of a budget because “we know what we're doing.” Beneath that was a controlling top-down leadership that no longer kept up with the company's growth. When Scott, the production manager, switched from telling his managers what to do to defining the problems for them to solve, cost reduction delivered a one-third increase in annual earnings—in two months! (Yes, he used a version of MTA.)
You can do even more than Scott did. Apply a full MTA to your organization. Think of MTA as an exoskeleton for your business and its people. It's like the fences and rules that make a baseball game a competition instead of a free-for-all. Once in place, understood, and employed, you'll see surprising talent and performance emerge with more enthusiasm and less effort by you and your leaders.
MTA: Measures + Targets + Adjustment = Results that Will Surprise You
Measures. Define performance measures that are precisely machined to their purpose. Commonly divided between financial measures and operating measures, the guiding principle is that the shorter-term operating measures (days, weeks, months) drive financial results (month, quarter, year). The clearer that linkage, the more effective both data sets are.
Here are their definitions:
Targets (goals). Goals put power into measures. Carefully defined measures enable targets that can be believable enough to excite employees to high performance, properly used. Define the measures before the targets so that confidence in the measures can translate to commitment to believable goals. If your people don't understand or believe the measures, the goals will sit unused on the desk. The most powerful targets are daily or weekly, so folks can see how they did “yesterday” and adjust quickly.
Adjustments. This is where your tools guide people to impact results. Adjustments to return to the path (targets) of success are vital, challenging to maintain, and wonderfully rewarding as they become embedded as “how we do things here.” The point of MTA is the adjustment phase.
People are an organization's leverage, for good or ill. At all three levels of organization—management team, middle management, and team leads—people's leverage can be stunning if they are properly trained and guided to use your MTA. Sadly, too many focus on the measures and targets instead of vital adjustment review sessions that bring everyone into the game.
A physical therapy organization with multiple clinics faced dramatic cuts in reimbursement because of changes in insurance law. Key results posted weekly in each clinic sparked a fulcrum meeting, the output of which was simply the organization's focus for the week. Their work was a main reason that the organization sold for three times the expected value to a sophisticated national chain that wanted to use their systems in their hundred-plus clinics.
After you've built measures and targets, bring results alive in your adjustment system, called review and modify (RAM) sessions. The best leaders organize these into two parts: frame and game.
In basketball, the frame is the floor with out-of-bounds lines, basket, free-throw line, and the rules that define them. Your computer requires protocols and sequences to deliver the results that you want. Your fulcrum session frame can do the same. It's a supercharger for great results. When there's no frame, there's no game, no results, no fun, and no motivation.
Here's your basic RAM session frame. Like the basketball court, it's the same for every game (meeting):
- Include leader and direct reports only. Other levels cripple discussion.
- Attend religiously. Tell employees they'll be there unless they're on vacation, sick, or dead.
- Have a fixed list of group members. Guests join to present or observe (no questions).
- No substitutes.
- Meet on the same day, same time.
- Meet in same place, with agenda, whiteboard, and clock.
- Hard start time; expect all to be in the room five minutes early.
- Hard stop time.
- Rotating timekeeper to stay on agenda time.
- Same length of meeting each time.
- For ten-minute meetings, all stand. If longer, then sit around a table.
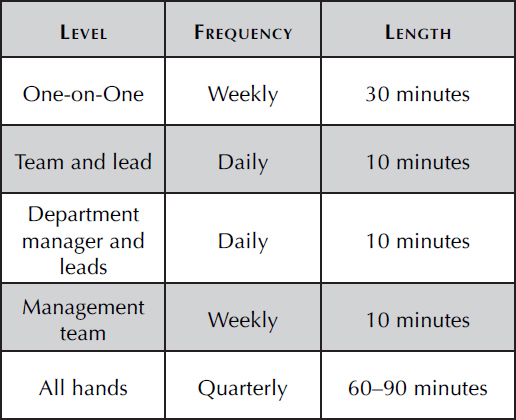
- Adapt meeting frequency, time, and agenda for the levels in your company.
- Use the same agenda in every meeting of the same type. (See examples.)
Sample Agenda Daily Stand-up Meeting Team and Lead
- Yesterday's results
- People:
- Absent
- Need help/Give help
- Overtime
- Equipment problems
- Building problems
- Today's tough jobs
- Roadblocks
- Safety
Sample Agenda: Management Team Meeting
- 1:25: All here
- 1:30: My 1–3 priorities for this week: Name in a minute; go around the table
- 1:40: Results for week and month:
- Metrics
- Monthly financials (Week 3 only)
- 2:00: Sales update (Week 4 only)
- 2:10: Past action list update
- 2:20: New issues
- 2:45: Done
Output:
- Surface issues that organization isn't solving, and triage:
- Solve in three minutes, action list, parking lot, drop
- Action list: What, who, when; in Excel; to all by end of meeting day
Sample Agenda: One-on-One Meeting
- Progress on last week's top three
- Your action items from management team
- Progress toward your goals
- Progress on financial and operating metrics
- Major issues now
- Next week's top three
For each item:
- What's working well?
- What are roadblocks now?
- How can I help?
Initiatives. Review of initiatives works best with different data than operating results versus targets. Instead, use two layers of information: status and problems.
Consider the approach that Alan Mulally used as a foundation to turn around Ford Motor Company from 2006 through 2009:
Soon after joining Ford, CEO Alan Mulally initiated priority rankings in his mandatory weekly BPR (business plan review) meetings, using these colors:
Red—Not on plan, no strategy to get on plan
Yellow—Not on plan but has a strategy to get on plan
Green—On plan and all is good
The company then was losing $18,000,000, and yet everyone's priorities showed “Green.” Alan: “I guess our plan must be to lose billions of dollars!”
Weeks passed. Finally, somebody said, “Red—not on plan, no strategy to get there.” Alan stood up and applauded. He said, “You know you're not on plan and you don't know how to get there. It's okay. Thank you for having the courage to say that.”
Then Alan said, “Neither of us knows how to get on plan, and that's okay. Why don't we just find people that know the answer?”4
The Game
Picture the room with six or eight folks who are itching to see how they did, so they can go out doing even better. The emotional feel of the room is at least as critical as the data, and no one has a monopoly on the will to do better.
This approach brings data into the room with folks who can use it immediately. The outcome of RAM meetings is specific actions—framed who, what, and when. Communication, both down and up, are data for use in defining action. Broadly theoretical or philosophic communication has its place, but including it in these meetings risks hopelessly hiding needed actions.
Meetings are primarily about the people in the room and what they choose to do. Once the data is in their laps, their leader's skill determines the power to get the right things done.
Let's shift to leader behavior because it's the other accelerant (after data). Each of these principles can power the astonishing results.
Frame the time in the room as a treasure hunt open to all. The leader has no monopoly on truth. Instead, his job is to help every member dive into the pool of data, bring back possible actions, and put his shoulder behind every action the group chooses. Let me say this another way: The leader's job is to help every member in the room. It's not to solve problems. Few actions corrupt commitment and motivation faster than a leader who “knows the answer.” As Alan Mulally said, “For the great achiever, it's all about me. And for the great leader it's all about them.”5
The leader's job in the room:
- Listen closely.
- Ask penetrating questions about the data.
- Support each person: “It seems that you have some ideas in mind.”
- Model curiosity before judgement: “Why is that? What would it mean?”
- Delay the drive to decide, just a bit, substituting curiosity.
- Pace the discussion to balance inquiry with action steps.
- Pull for action out loud when it's time to shift to action from exploration.
- Insist on intended actions enthusiastically supported as the meeting's result.
- Insist on following the agenda.
- Find laughter.
- Ensure communication with folks not in the room, who likely do the work.
Rate your performance. You and the team should rate you as leader on the items above.
Grade each item:
10 = excellent
7 = satisfactory
5 = needs improvement
Total your scores and pay attention to the tens as well as the fives.
Every day, your leaders and your people are doing something. Your challenge is to help them more and more to do the things that impact the results that the company and its customers want. It's a live thing, like a racehorse, and like a horse it can be managed for better outcomes.