
Chapter 3. Dawn of the Real-Time Dashboard
Before delving further into the systems and techniques that power predictive analytics applications, human consumption of analytics merits further discussion. Although this book focuses largely on applications using machine learning models to make decisions autonomously, we cannot forget that it is ultimately humans designing, building, evaluating, and maintaining these applications. In fact, the emergence of this type of application only increases the need for trained data scientists capable of understanding, interpreting, and communicating how and how well a predictive analytics application works.
Moreover, despite this book’s emphasis on operational applications, more traditional human-centric, report-oriented analytics will not go away. If anything, its value will only increase as data processing technology improves, enabling faster and more sophisticated reporting. Improvements like reduced Extract, Transform, and Load (ETL) latency and faster query execution empowers data scientists and increases the impact they can have in an organization.
Data visualization is arguably the single most powerful method for enabling humans to understand and spot patterns in a dataset. No one can look at a spreadsheet with thousands or millions of rows and make sense of it. Even the results of a database query, meant to summarize characteristics of the dataset through aggregation, can be difficult to parse when it is just lines and lines of numbers. Moreover, visualizations are often the best and sometimes only way to communicate findings to a nontechnical audience.
Business Intelligence (BI) software enables analysts to pull data from multiple sources, aggregate the data, and build custom visualizations while writing little or no code. These tools come with templates that allow analysts to create sophisticated, even interactive, visualization without being expert frontend programmers. For example, an online retail site deciding which geographical region to target its next ad campaign could look at all user activity (e.g., browsing and purchases) in a geographical map. This will help it to visually recognize where user activity is coming from and make better decisions regarding which region to target. An example of such a visualization is shown in Figure 3-1.
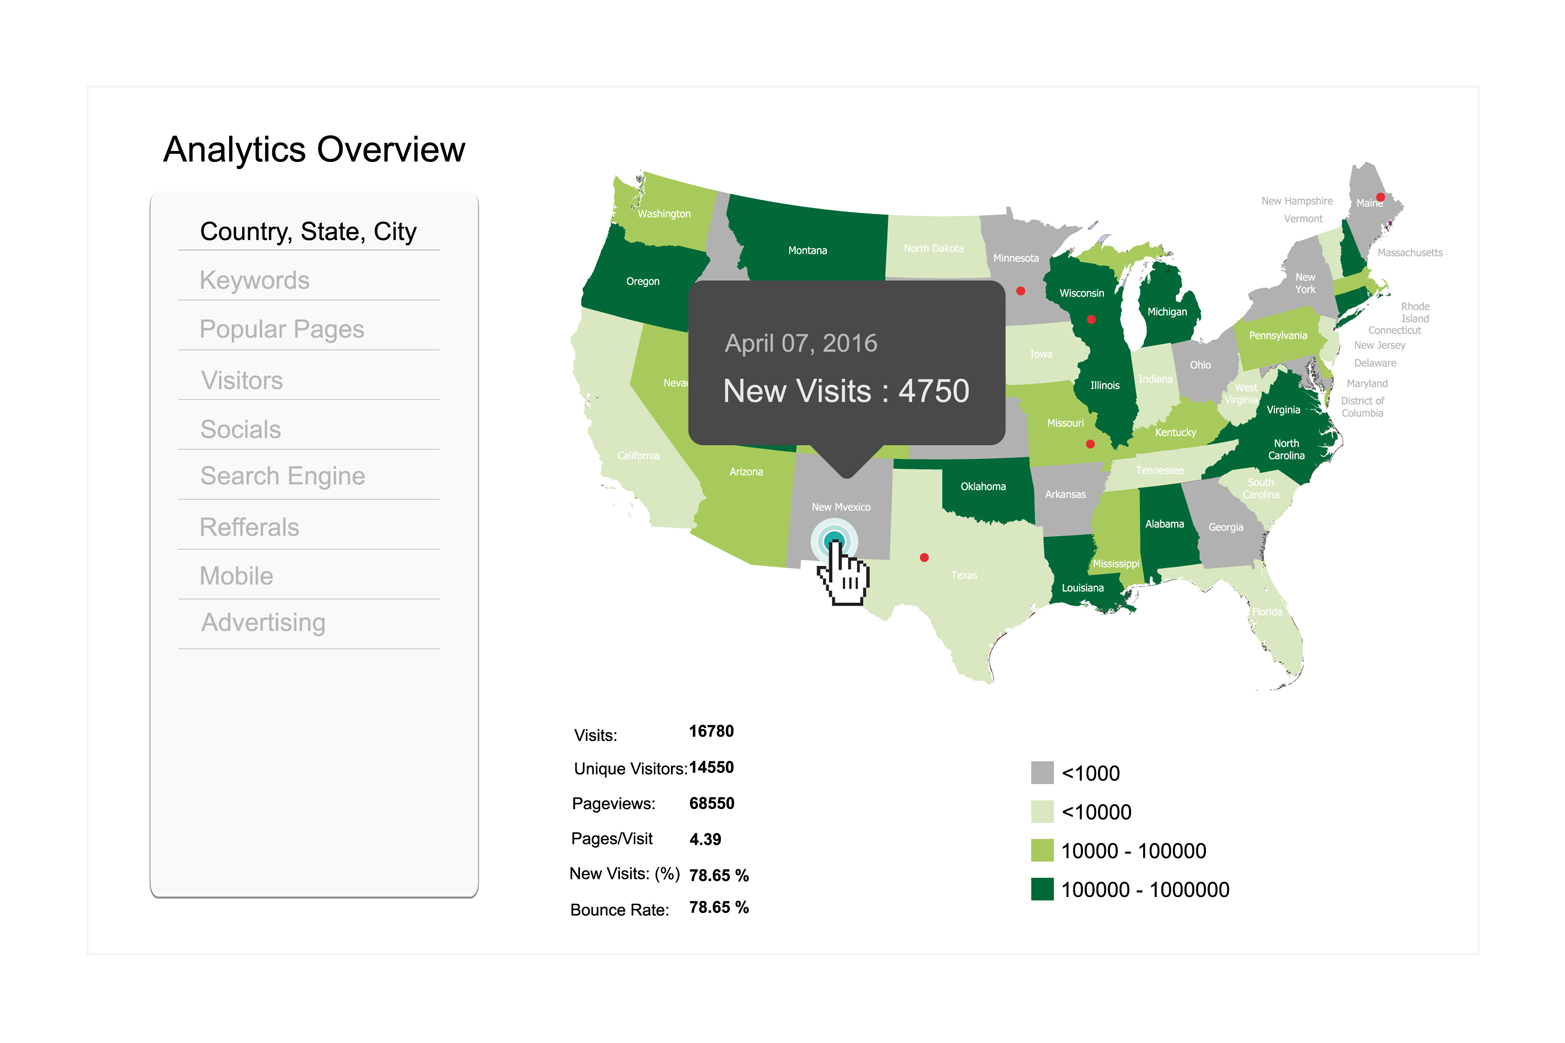
Figure 3-1. Sample geographic visualization dashboard
Other related visualizations for an online retail site could be a bar chart that shows the distribution of web activity throughout the different hours of each day, or a pie chart that shows the categories of products purchased on the site over a given time period.
Historically, out-of-the-box visual BI dashboards have been optimized for data warehouse technologies. Data warehouses typically require complex ETL jobs that load data from real-time systems, thus creating latency between when events happen and when information is available and actionable. As described in the last chapters, technology has progressed—there are now modern databases capable of ingesting large amounts of data and making that data immediately actionable without the need for complex ETL jobs. Furthermore, visual dashboards exist in the market that accommodate interoperability with real-time databases.
Choosing a BI Dashboard
Choosing a BI dashboard must be done carefully depending on existing requirements in your enterprise. This section will not make specific vendor recommendations, but it will cite several examples of real-time dashboards.
For those who choose to go with an existing, third-party, out-of-the-box BI dashboard vendor, here are some things to keep in mind:
- Real-time dashboards allow instantaneous queries to the underlying data source
- Dashboards that are designed to be real-time must be able to query underlying sources in real-time, without needing to cache any data. Historically, dashboards have been optimized for data warehouse solutions, which take a long time to query. To get around this limitation, several BI dashboards store or cache information in the visual frontend as a performance optimization, thus sacrificing real-time in exchange for performance.
- Real-time dashboards are easily and instantly shareable
- Real-time dashboards facilitate real-time decision making, which is enabled by how fast knowledge or insights from the visual dashboard can be shared to a larger group to validate a decision or gather consensus. Hence, real-time dashboards must be easily and instantaneously shareable; ideally hosted on a public website that allows key stakeholders to access the visualization.
- Real-time dashboards are easily customizable and intuitive
- Customizable and intuitive dashboards are a basic requirement for all good BI dashboards, and this condition is even more important for real-time dashboards. The easier it is to build and modify a visual dashboard, the faster it would be to take action and make decisions.
Real-Time Dashboard Examples
The rest of this chapter will dive into more detail around modern dashboards that provide real-time capabilities out of the box. Note that the vendors described here do not represent the full set of BI dashboards in the market. The point here is to inform you of possible solutions that you can adopt within your enterprise. The aim of describing the following dashboards is not to recommend one over the other. Building custom dashboards will be covered later in this chapter.
Tableau
As far as BI dashboard vendors are concerned, Tableau has among the largest market share in the industry. Tableau has a desktop version and a server version that either your company can host or Tableau can host for you (i.e., Tableau Online). Tableau can connect to real-time databases such as MemSQL with an out-of-the-box connector or using the MySQL protocol connector. Figure 3-2 shows a screenshot of an interactive map visualization created using Tableau.
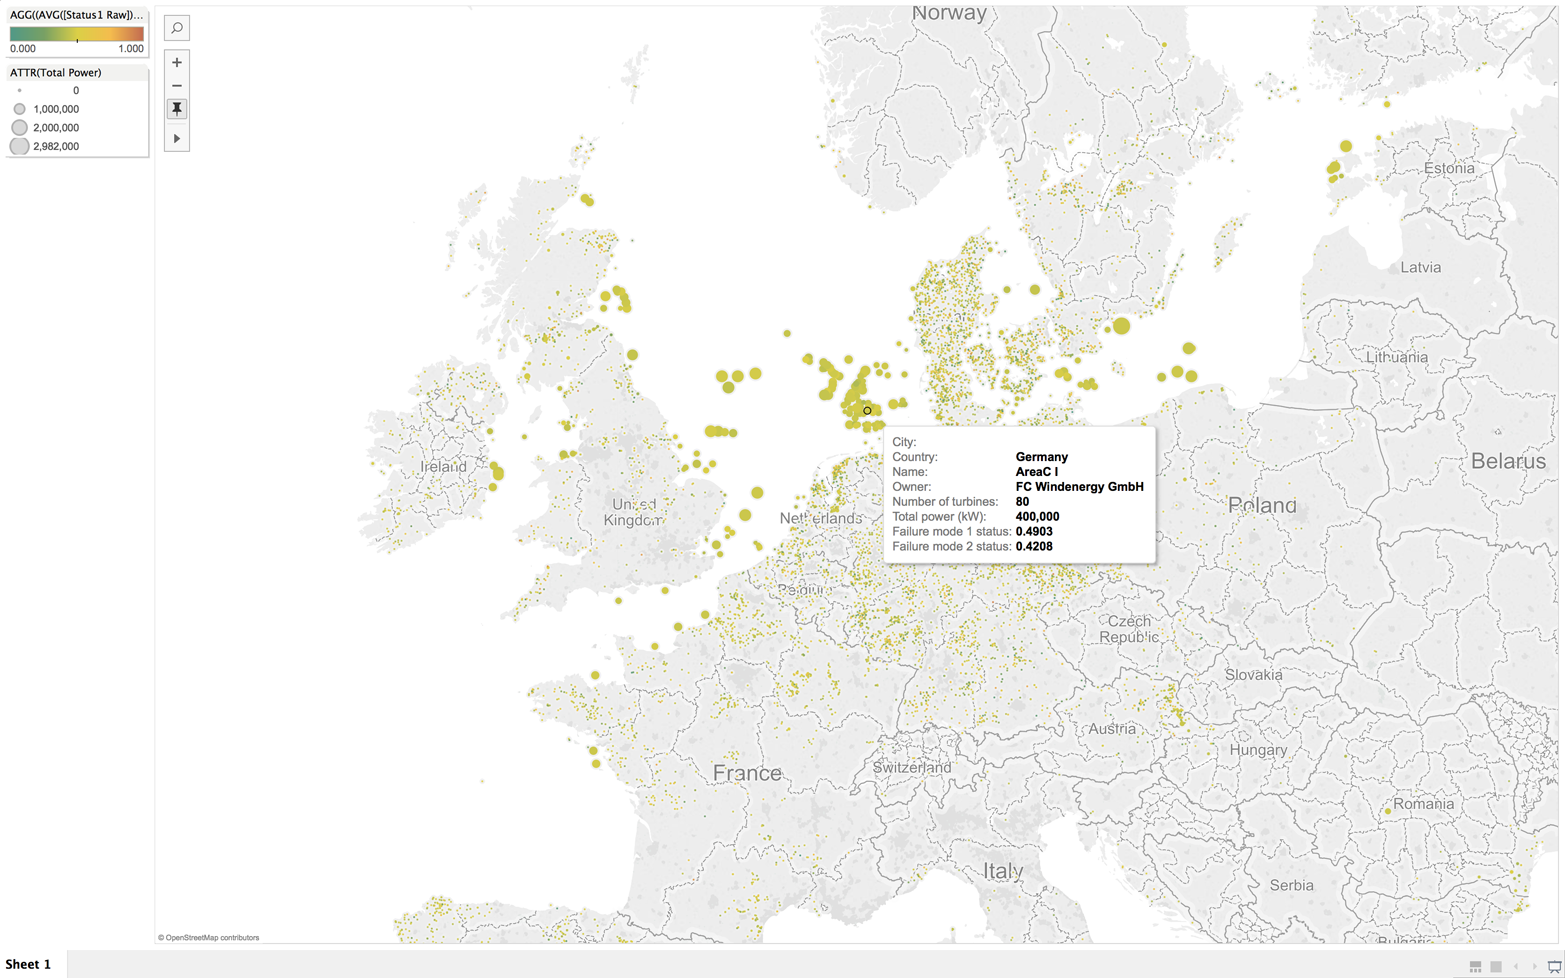
Figure 3-2. Tableau dashboard showing geographic distribution of wind farms in Europe
Zoomdata
Among the examples given in this chapter, Zoomdata facilitates real-time visualization most efficiently, allowing users to configure zero data cache for the visualization frontend. Zoomdata can connect to real-time databases such as MemSQL with an out-of-the-box connector or the MySQL protocol connector. Figure 3-3 presents a screenshot of a custom dashboard showing taxi trip information in New York City, built using Zoomdata.
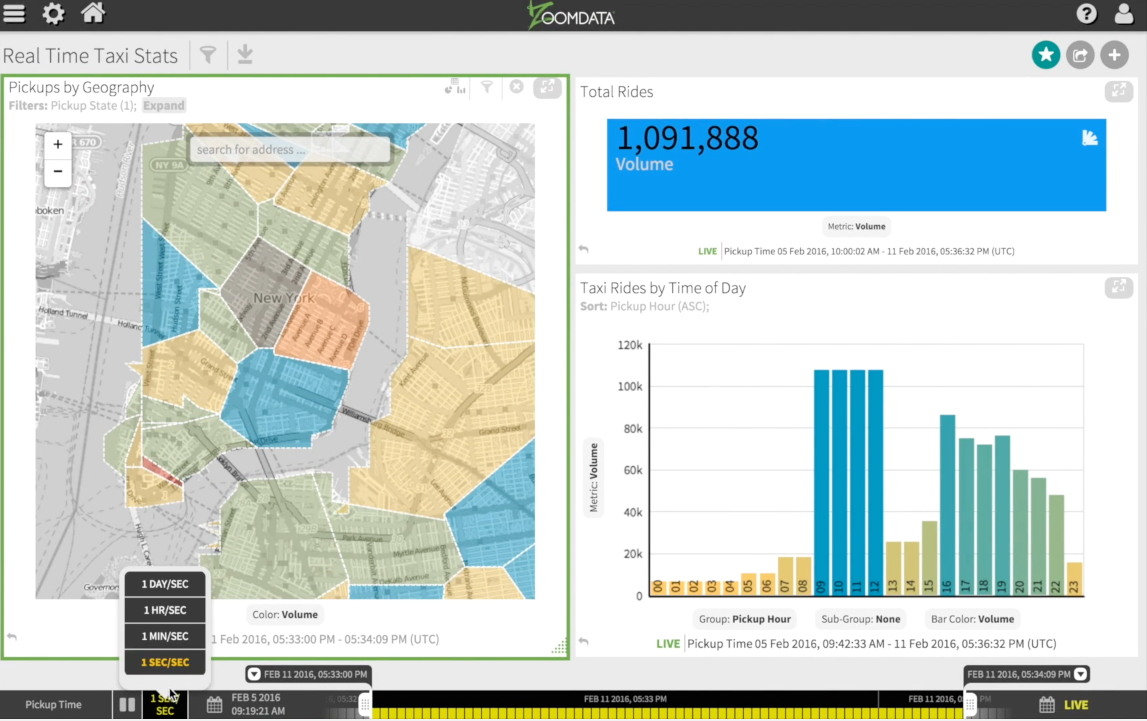
Figure 3-3. Zoomdata dashboard showing taxi trip information in New York City
Looker
Looker is another powerful BI tool that helps you to create real-time dashboards with ease. Looker also utilizes its own custom language, called LookML, for describing dimensions, fields, aggregates and relationships in a SQL database. The Looker app uses a model written in LookML to construct SQL queries against SQL databases, like MemSQL. Figure 3-4 is an example of an exploratory visualization of orders in an online retail store.
These examples are excellent starting points for users looking to build real-time dashboards.
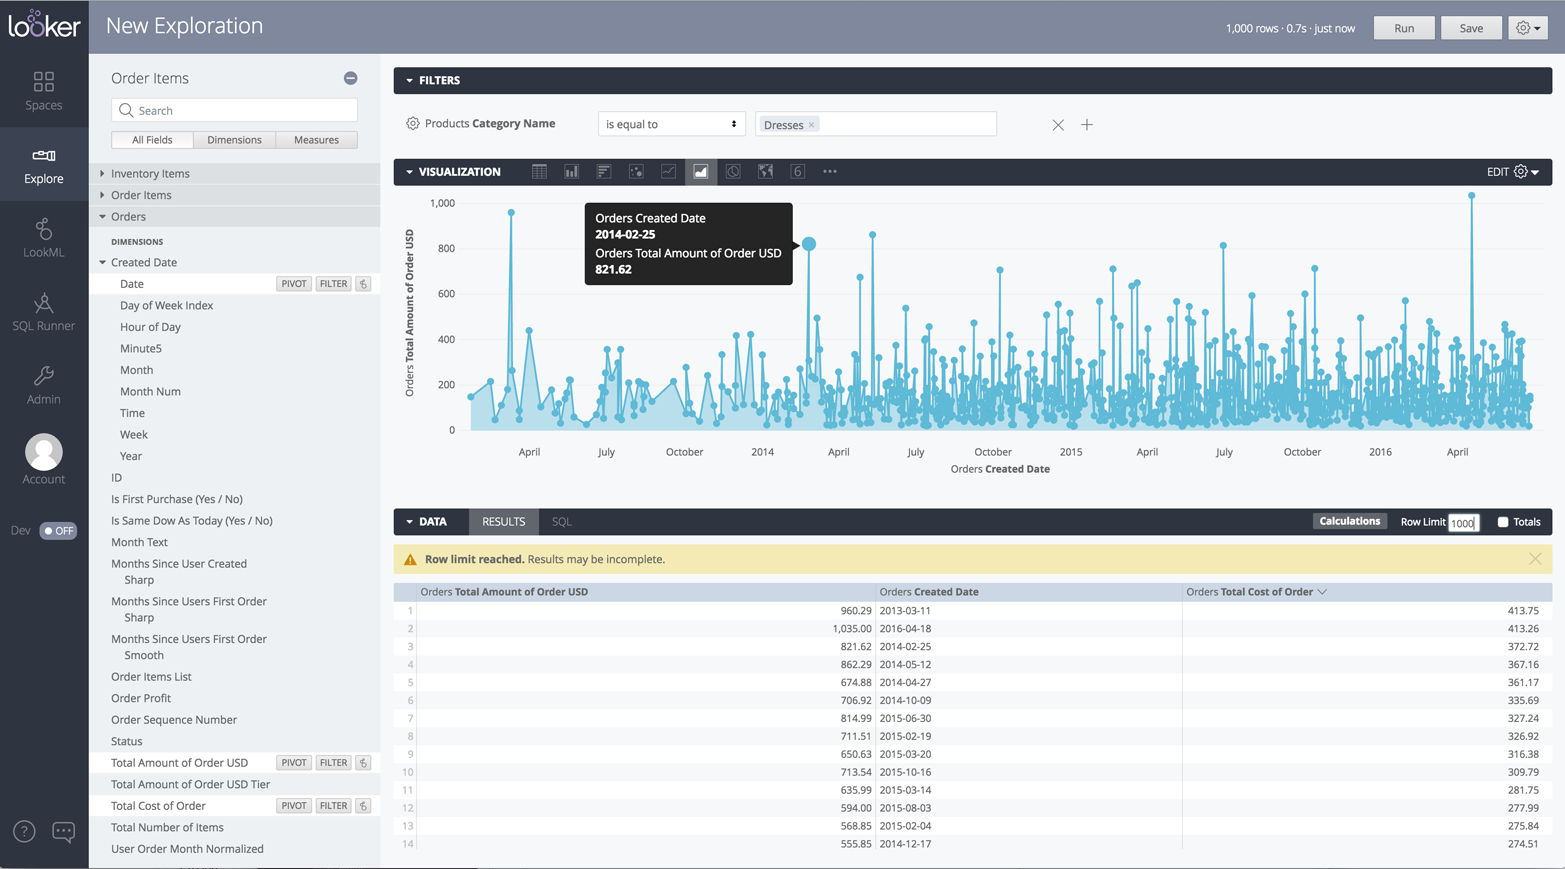
Figure 3-4. Looker dashboard showing a visualization of orders in an online retail store
Building Custom Real-Time Dashboards
Although out-of-the-box BI dashboards provide a lot of functionality and flexibility for building visual dashboards, they do not necessarily provide the required performance or specific visual features needed for your enterprise use case. Furthermore, these dashboards are also separate pieces of software, incurring extra cost and requiring you to work with a third-party vendor to support the technology. For specific real-time analysis use cases for which you know exactly what information to extract and visualize from your real-time data pipeline, it is often faster and cheaper to build a custom real-time dashboard in-house instead of relying on a third-party vendor.
Database Requirements for Real-Time Dashboards
Building a custom visual dashboard on top of a real-time database requires that the database have the characteristics detailed in the following subsections.
Support for various programming languages
The choice of which programming language to use for a custom real-time dashboard is at the discretion of the developers. There is no “proper” programming language or protocol that is best for developing custom real-time dashboards. It is recommended to go with what your developers are familiar with, and what your enterprise has access to. For example, several modern custom real-time dashboards are designed to be opened in a web browser, with the dashboard itself built with a JavaScript frontend, and websocket connectivity between the web client and backend server, communicating with a performant relational database.
All real-time databases must provide clear interfaces through which the custom dashboard can interact. The best programmatic interfaces are those based on known standards, and those that already provide native support for a variety of programming languages. A good example of such an interface is SQL. SQL is a known standard with a variety of interfaces for popular programming languages—Java, C, Python, Ruby, Go, PHP, and more. Relational databases (full SQL databases) facilitate easy building of custom dashboards by allowing the dashboards to be created using almost any programming language.
Fast data retrieval
Good visual real-time dashboards require fast data retrieval in addition to fast data ingest. When building real-time data pipelines, the focus tends to be on the latter, but for real-time data visual dashboards, the focus is on the former. There are several databases that have very good data ingest rates but poor data retrieval rates. Good real-time databases have both. A real-time dashboard is only as “real-time” as the speed that it can render its data, which is a function of how fast the data can be retrieved from the underlying database. It also should be noted that visual dashboards are typically interactive, which means the viewer should be able to click or drill down into certain aspects of the visualizations. Drilling down typically requires retrieving more data from the database each time an action is taken on the dashboard’s user interface. For those clicks to return quickly, data must be retrieved quickly from the underlying database.
Ability to combine separate datasets in the database
Building a custom visual dashboard might require combining information of different types coming from different sources. Good real-time databases should support this. For example, consider building a custom real-time visual dashboard from an online commerce website that captures information about the products sold, customer reviews, and user navigation clicks. The visual dashboard built for this can contain several charts—one for popular products sold, another for top customers, and one for the top reviewed products based on customer reviews. The dashboard must be able to join these separate datasets. This data joining can happen within the underlying database or in the visual dashboard. For the sake of performance, it is better to join within the underlying database. If the database is unable to join data before sending it to the custom dashboard, the burden of performing the join will fall to the dashboard application, which leads to sluggish performance.
Ability to store real-time and historical datasets
The most insightful visual dashboards are those that are able to display lengthy trends and future predictions. And the best databases for those dashboards store both real-time and historical data in one database, with the ability to join the two. This present and past combination provides the ideal architecture for predictive analytics.