
Designing Slides and Visual Aids
A picture can paint a thousand words. Using good-quality visuals can be a very powerful way to enhance your message and make it more memorable. Research shows that retention of information increases when information is shared both visually and orally.
Visual aids give your audience:
Something to look at—very important especially for those who prefer to receive information visually
A means of putting your message into context, especially if it is complex, by providing an illustration or example to show exactly what you mean
Variety—another source of stimulation
Start with a framework for your deck—a sketch to scope out what slides you want to support each point or story you want to highlight, such as the storyboard technique we looked at for arranging your key points. When you have an idea about the order and concept for each slide, then you can source images, charts, and so on.
Slide Decks
Your slides could be your visual element, but not necessarily. They are your support act—slides don’t give the presentation, you do. Only after you have organized your content, refined your points, and developed your stories are you ready to add visuals in the form of slides. People don’t come to view your slideshow; they come to hear and see you. Many presenters use slides as a crutch. Of course, slides are an important part of many business presentations, but too much emphasis is placed on them, rather than the message itself.
Quite often senior executives and managers will ask assistants or even a design company to prepare the slide deck for them as it seems like a better use of time. That’s real life. However, this section goes into a lot of detail about how to produce great visuals so that you can direct an assistant to create something that reflects you best. Ideally, as you are the speaker, it works better if you produce your own slides, especially if you are not familiar with the slide software.
Knowing how it all works at least gives you the confidence under pressure when for some reason something fails to work on the actual day. Get to know how it all works and what you like before you outsource anything. If you are getting help with your slide deck, send a copy of your mind map or sketch out the outline of the slides you need to your assistant or design team.
There is a presumption that using slides makes the presentation look more professional. However, the reality is that improper use of slides can make your presentation look bad. Poorly designed slides can bring down the tone of your presentation in many ways:
Densely populated slides with lots of text
Distorted images that are too fuzzy to see
Lots of data and graphs that are difficult to read
Bad choice of animation or too much of it
We all know the phrase “death by PowerPoint.” This is what the audience experiences when faced with endless slides crammed with text.
What are members of the audience thinking when this happens?
Try to read the text on the slide
Concentrate on what the speaker is saying
Just give up and start looking at their phone because you lost them
In his book, Presentation Zen, Garr Reynolds calls this type of presentation “slideuments”—a mash up of slides and documents. Resist the urge to cram in too much. This is not ideal. Too often, we see this kind of deck—possibly due to last-minute preparation when the speaker hasn’t made time to refine the content.
Not only is too much text a problem for the audience, it also can be a distraction for the speaker as she or he gets drawn into reading his or her own slides, rather than looking at the audience. A lot of people don’t realize this is happening until it is pointed out to them. Mediocre speakers use slides as a teleprompter and a crutch. The slides are there for your audience and not as a script for you.
Many business presenters approach designing slides in this way. I often sit on a judging panel for start-ups competing to secure a place in an accelerator program in which they will receive mentoring and support with resources. Those that are successful eventually become ready for investment. When those start-up companies pitch to investors, they’ll put together a slide deck to support their presentation.
Here’s the interesting thing about the way in which they prepare them. Potential investors like to see the slide deck in advance. In order for the slides to make any sense for someone just reading the deck in isolation without the entrepreneur being present, there has to be some text added in. However, for the face-to-face meeting, that text is not there. The versions are “read deck” and “slide deck.” Read deck is for reading. Slide deck is for presenting.
Only use tools such as slides if they enhance understanding. This goes for physical handouts too. Don’t let materials become the focus.
If you have a slide up on a screen, you are drawing the attention of your audience to the screen, and every time you change the slide, the same thing happens. Add to this situation that most seminar or conference rooms have projection screens positioned in the center of the room so that you, the presenter, have to stand in a corner to one side to let the audience read what is on the screen. If you put less text on your slides you don’t have to keep adjusting your delivery to allow for the content to be read.
Getting the Most from PowerPoint
People use PowerPoint like they are driving a Ferrari at 20 miles per hour simply because they don’t know just how much is possible. It is an amazing piece of software that will help you design beautiful slides that improve the audience experience. The same is true for Keynote or similar, of course. Unfortunately, a lot of slide presentations are full of bullet-point text. It doesn’t help that when you open PowerPoint, the default is a bullet template. Sometimes, text is necessary and can be helpful, but large unbroken slabs of text on a slide will turn people off.
If you do decide to use words, restrict your content to three lines per slide and give your audience time to read them. Create space between lines. Think simple and clean—very few words per slide. Too many words on the slides will overload their brains and make them work harder. Keep to one idea per slide.
Blanking Your Screen
Never leave slides up on the screen if they are not related to what you are talking about. This only distracts the audience. Instead click on “B” on your keyboard to turn the screen black or “W” to turn it white. When you are ready to get back into the slides, press the same key again.
Hide Slides
Sometimes, you want to skip slides. You may have been asked to cut your time short. Alternatively, you are using the same slideshow for different clients, and there are one or two slides that are only relevant to the respective clients. You can hide those slides by selecting the slideshow option on your toolbar and then scrolling down to “hide slide” and selecting that.
Slide Transitions and Animation
My personal preference is not to use any fancy slide transitions—things such as the slide bouncing into the next frame or blowing up in a puff of smoke. But, it’s a matter of personal choice. I would say, it is more professional to click on the next slide without any fancy tricks, as that can distract from your message.
The same advice goes for animation—for example, when you bring one paragraph at a time in sequence. It can be useful to do this, but just be careful about what affects you apply to each click of your mouse. If you do choose to use special effects such as having your paragraph come flying in from one side of the screen, then be consistent and use the same effect for all the moving parts so that it appears more fluid.
Font
Style of font is another consideration. This is a matter of personal choice again. Think about the audience and the image you want to portray. Your organization may be conservative or very laid back. You might want to pick something that reflects the culture, and of course, you as the presenter. Whatever you go for, pick something that pops out from the big screen and is easy to read from the back of the room.
To keep your slides simple and effective, stick to no more than two different styles. Any more than that and your visuals start to look disorganized. You want to aim for a smooth consistent look throughout your presentation. Once you have created them, go back and check whether you have the same look and feel running through each one—check for style and size. Font size ideally needs to be a minimum of point 28 to stand out on a big screen. Choose fonts that are easy to read, such as such as Arial or Helvetica, so that the person in the back row can read it. The goal is to produce something that is consistent and professional.
Contrast and Text Color
Small font is not the only problem, though. Choice of color for both font and background will have an impact on the audience experience. If there is not enough contrast for the text to stand out, then it will be difficult to read once the slides are projected onto the big screen. If you have corporate colors, choose something sympathetic to your branding, but keep your focus on the audience experience.
What looks good at your desk is not necessarily what works in the presentation space, as the lighting in the room will have an impact. If the room is bright, use dark font on a light background. If the room is dark, you can use light font on a dark background. The only way to know if your slides will be visible to the person in the back row is to test them either in the actual presentation room or somewhere similar.
Images
It is not that difficult to create visually appealing slides. Replace your text with stunning images. Our minds can process images much faster than reading words. A well-chosen picture leaves things open to interpretation.
With less content on your slide, you are free to talk about your subject without being restrained by a script. You know what to say about that image or point, and because you don’t have too many words on the screen you are not tied to a script word for word. Every time you present on the same topic, you will deliver it in a different way anyway, and with this setup, your audience will never know.
What sort of images should you use? Ask yourself whether you can connect it to the point you are making. Photos work at an emotional level. Use them to set the scene to a story. Graphics and charts can also work well if there is very little text on them.
Use large, high-quality pictures. One beautiful photo can be incredibly compelling. When you insert them, use full bleed—that means fill the entire screen with that image, no headings or branding. If you want to put a few words over it, use a text box, but keep the words to a minimum. Take a look at the following example:

This is how most presenters insert pictures into a slide using the normal default slide format with a heading.
This is the same picture as in the preceding slide, but expanded out to cover the entire slide. No heading needed. If you want to add words, select “insert text box,” type your text, and place it over your image. Much more professional-looking and appealing.

You can find text boxes under the “insert” option on your main toolbar at the top. Once you select the text box option, PowerPoint positions your keyboard cursor onto your chosen slide—just start typing something straight into it; otherwise, if you click away, it can look as if your text box has disappeared. You can then format the size, font, and color by highlighting your text and selecting “format” on the main toolbar at the top.
Shapes, Flowcharts, and Graphs
How many times have you sat in an audience and the speaker has a graph on the screen with lots of labels and data that are just too tiny to read, then she or he says something like “you probably can’t read this at the back but...” Replacing bullet points with a visual chart is much more appealing for your audience and easier to understand. Using shapes, such as Venn diagrams, pie charts, and simple bar charts help to illustrate complex concepts. Such visual elements help to put data such as statistics and trends into context.
For example, rather than listing figures related to profit or loss or sales per quarter as bullet points, represent them in a bar chart. Keep the graph simple and clutter-free, so that it can be seen clearly. This includes labels on the axes. You can bring in parts of the graph gradually as you talk about each section. This is not too difficult when you know how to use the features of PowerPoint shapes and graphs. However, a really easy way to create the same effect is to have a number of slides gradually adding an extra section each time. As you click through, it will create the same effect as if you had animation of several moving parts on one slide.
Using flowcharts is another great way to display relationships and progression. For example, if you are explaining a sequence of processes or timelines, a flowchart is much more appealing than a list of bullet points. You could provide a summary of the key points, for example, within a flow diagram, like the example shown earlier in Chapter 4:

An info graphic with text is much more visual than text alone. Sites such as Canva.com are great resources for creating info graphics such as the example that follows. You can also use the shapes within PowerPoint to create these if you have the time and imagination to play around with the options.
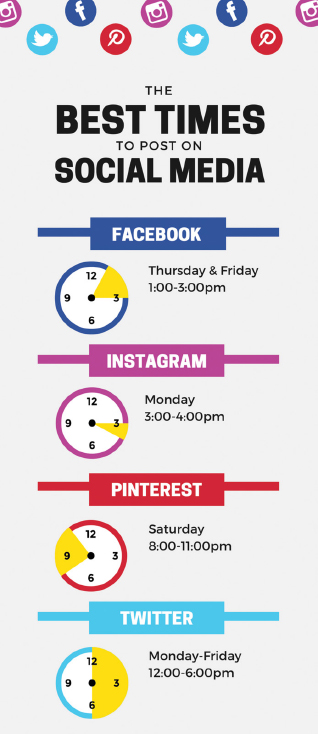
This infographic has been created using a template in Canva.
Resources for Images and Copyright
A word of caution regarding copyright of images and video clips: using images found through well-known search engines on the Internet usually will require obtaining permission. This should be obvious if you see a watermark or copyright symbol stamped on the picture. Some people take no notice of this and use them anyway—the faint watermark on the slide is a giveaway and says “amateur.”
There are, however, plenty of sites where you can download “royalty free” images (sites giving you appropriate permission to use the images). Some offer the images at no cost; others have varying prices ranging from single purchases to annual licenses.
The other option is to take your own photos.
At the end of this chapter, there is a list of sites where you can find royalty-free images.
Grouping Images, Shapes, and So On
This is such an amazing option and not many people know about it or use it. It is one of the best ways you can ensure that any moving parts on your slide do not get knocked out of whack when you send them over to someone who has a different version of PowerPoint that is not entirely compatible with yours. For example, you might be using a flow chart to demonstrate a process—all your boxes are lined up with connecting arrows and text sitting on top of each box describing what each phase represents. To lock them all into one image, click on “edit” and “select all” capturing all the moving parts, then find “group” under the “arrange” button on your toolbar. This may be in a slightly different place on your version of PowerPoint, for example, under “format” or “drawing tools,” but it will be there somewhere.
Here is link from Microsoft Support demonstrating visually how to do this:
Video and Audio
You can use video clips embedded into your slides if they support your message. Using video clips can be useful for getting your point across in a more meaningful way and can help create an emotional connection to your message. Videos can be especially useful for demonstrating a technique or process. They are also a great way to include testimonials. Make sure your clip is not too long—remember people have short attention spans.
Similarly, music can help connect with people’s emotions. You might be thinking it is not appropriate in a business setting. Not necessarily. Music can create a range of emotions and alter attitudes. Think about songs that make you feel happy. If you are referring to a specific time period or era, then choosing a recognizable piece of music will transport the audience to that place.
One of the many challenges speakers have with using PowerPoint to create slides is that there are many versions of it. Your version of Power-Point may be different from others, and the options on the menu bar or functions may well be different. Microsoft offers a suite of tutorials for more detailed guidance on all the suggestions I’ve made earlier.
Here is the link for online PowerPoint training:
Every single item within your slides—whether it is the heading, background, text, or images—can be formatted or designed to your taste. Your imagination is the limit.
Flip Charts and Whiteboards
When you have a small group, slides may be overkill or not appropriate. The audience may benefit from a more interactive format. Flip charts or whiteboards are a great way to go. They are low tech, portable, and do not require much advance preparation.
They work well for getting feedback and generating ideas through brainstorming in an informal way. I actually use them in addition to slides when I am facilitating a training session.
When I say they require very little advance preparation, compared to slides, they do. You still need to think about how you want to use flip charts to demonstrate a point by drawing a chart or listing ideas. When it comes to preparing for drawing difficult graphics, have it done beforehand on a sheet behind the front of the pad.
You can write some of the ideas or key words you want to refer to in your presentation ahead of time. That way you do not have to spend too much time turned away from the audience or worry about messy handwriting while you are talking. To add emphasis as you later go through your prepared flip sheet, you can draw boxes around key words. The other way to prepare is to write or draw guidelines for what you later want to share in faint pencil—especially if it’s a chart or diagram. Have enough markers that work—this seems obvious, but is so easy to forget.
If you have a room full of people, you may not want to use this format for your visuals if it is going to be difficult for people at the back of the room to see.
People like to use slides to support their presentations because they can be printed as handouts or e-mailed as an attachment later. Flip chart paper is obviously too large to scan or copy, but you can take photos on your smartphone and circulate that later. I use this technique all the time when facilitating workshops. This works well when breakout groups brainstorm discussion points on a sheet of flip chart paper. Take a photo of each group’s idea sheet and circulate it later.
Much of what has been said already can be applied to whiteboards in terms of use of pens and demonstrating in front of small groups. You can’t of course tear off sheets of paper and stick them up, but you can wipe that board. Again, if there are key ideas you want to circulate later, take a photo before you wipe the board clean. Many whiteboards are now interactive smart boards—remember the pens are different for them!
Props
This is the three-dimensional (3D) visual aid. Not many people use props, which is a shame. Clever use of props can help your audience remember key concepts and will make your presentation stand out. Of course, if you have a physical product to sell or showcase, then it seems obvious to use that as a prop. However, props don’t just need to be limited to products.
Some ideas for you:
Gold fish bowl filled with dirty water to demonstrate pollution
Medical experts using skeletons, models of the brain, and so on
A book the speaker has written or recommends
Remember earlier in Chapter 3 we talked about the white underpants Darren Tay pulled on over his business suit during his winning speech at the Toastmasters World Championships? Props can be used to add humor or introduce variety. Your imagination is the limit.
Darren Tay Toastmaster Winning Speech—excerpt www.youtube.com/watch?v=v26CcifgEq4
Handouts
Bear in mind that anything you pass around or leave on chairs for people to refer to could be a distraction. They can be useful as a visual aid to help explain a complex point or process. Tables and charts are sometimes better printed in hard copy than crammed onto a slide.
I do think it isn’t helpful to print your slides three to a page. If you have designed your presentation well, the slides don’t mean anything without you anyway, plus they are so small they are not that useful. There is more on this point in Chapter 10.
Interaction with Your Audience
Most of us would agree that an interactive presentation incorporating questions or discussions is engaging. There are ways we can make presentations more fun for the audience. Remember they want to be informed and entertained. If you involve them, they are more likely to remember more.
Take your audience from passively absorbing your content to wanting to implement your ideas. Turn your presentations into conversations.
We have talked about many different ways in which to keep your audience engaged—through designing content to answering their “why,” making slides visually appealing and using stories. We will also look at adding humor in Chapter 7. Another way to involve your audience is by leveraging the slide presentation through technology.
There was a time when it was deemed to be incredibly rude if someone got her or his phone out during your presentation. We’ve now come full circle and actually want people to share our content live on social media. For example, conferences encourage people to use specific hashtags.
There are many products that are inexpensive or have free versions with enough functionality to let you use polls that the audience can engage with using their smartphones. Unlike asking people to put their hands up and speak out, this works incredibly well. They can answer anonymously and then see how they did compared to the rest of the audience.
The audience can also ask their own questions that you can see come in live and then choose which ones to answer. What’s great about these software solutions is that it makes it easy for anyone who is not so confident to speak up by typing a question they really want the answer to. Everyone signed into the link can see other questions listed and can “up vote” the ones they like.
You can even incorporate live tweeting. This raises your profile, creates engagement, and helps connect anyone who couldn’t make it to the presentation. Sli.do.com and Glisser.com are just two companies that offer interactive presentation software, and there are many more if you search.
You can add fun elements by incorporating quizzes based around your topic—use the poll functions mentioned earlier to get live results or simply create slides with your questions on them and ask the audience to shout out answers. If you have data to share or results from research studies, get the audience to guess the answers before you reveal them.
The advantage of using some of these interactive presentation tools is that all responses to the questions are stored, so you can use that data later, for example, if you were conducting a poll regarding issues that mattered to your target audience. After your event, you could export the poll results into an infographic and send it to participants as a follow up. There are many more useful functions such as sharing your slides in real time with audience members on their smartphones. Take a look at the links that follow to find out more.
Key Points
Use high-quality images to fill the screen, rather than text.
Keep to one idea per slide.
Choose font size and style that are easy to read from the back of the room.
Use flow charts instead of bullet points.
Group your images so that they stay in place.
Involve your audience through live polls or quizzes.
Links
Glisser
Sli.do
Microsoft Support demonstrating grouping visuals:
Microsoft PowerPoint Training:
Books
Reynolds, G. 2012. Presentation Zen. New Riders.
Resources for images: