
CHAPTER 15
Finding Balance with the Reinforcement Lever
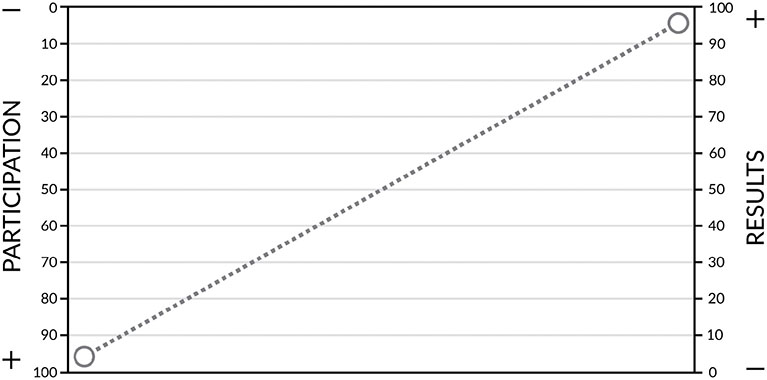
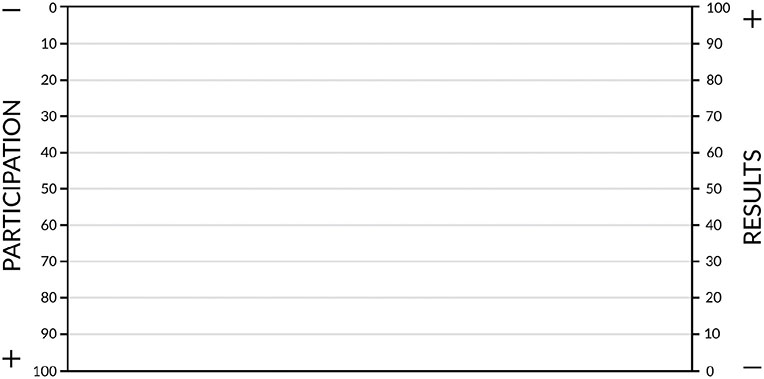
My first fight at a tournament was always against the scale. On the day of the tournament, all of the competitors must weigh-in by 6 a.m. In the days leading up to the tournament, I would not eat or drink a lot. I wore a sweatsuit in the sauna to help the sweating process. After the sauna, I wouldn’t eat or drink, except for perhaps a small sip of water to avoid my lips drying out. During this time, I was constantly thirsty, had no energy left to train, and would spend the 24 hours before the tournament counting how much time was left until the weigh-in. The scale is ruthless. One ounce too heavy means disqualification. No fight. Every athlete had to defeat the scale first. The weigh-in at 6 a.m. during my first big tournament was not in my comfort zone. The organization selected a conference room in the hotel as the weigh-in room. When I entered the room, I saw about eighty athletes standing in their underwear, waiting until they could weigh. I joined the end of the line. It took about two minutes per fighter to check their weight, passport, and accreditations. After two hours, it was finally my turn. My weight was in accordance with my accreditation. I could fight that day. However, it was already 8 a.m., and the competition started at 10 a.m. My body needed water and some food to rebuild some strength. Two hours was very little time to replenish my system. After competing in a few tournaments, the weigh-in procedure became familiar, and I knew what to do. It became part of my comfort zone. I figured out that I shouldn’t wait in the line and lose two hours of recovery for the tournament. After that, both Kees and I were some of the first to stand on the scale. That scale only measured our weight in our underwear. It didn’t matter whether we trained hard or had followed the ideal path. It was yes or no, even before we could gain results and win medals. The Reinforcement Lever is more complex. It shows you the balance between your foundation and your engagement. An imbalance will lead to no results. This is your first fight to win gold with your reinforcement program. Are the foundation and the engagement in balance? An imbalance leads to no results. The Reinforcement Lever shows you the balance between results and participation. If you want to create impact in your organization, your reinforcement program must focus on both results and participation. Focusing on results without learners will not create any change in your organization. And it’s the same the other way around: if you have a lot of learners (high participation score) but no focus on results, your organization will not change. Results and participation go hand in hand. What balance leads to behavior change and impact? The Foundation and the Engagement Assessments are based on how well you applied all the principles. The Foundation is based on Principles 1, 2, and 3, and the Engagement on principles 4, 5, and 6. The Reinforcement Lever reflects how well you balanced all principles and how well you placed the learners in the center of your reinforcement program, Principle 7. The angle of inclination influences the shape of the Reinforcement Levers you can have. If you scored the maximum score on both assessments, your Reinforcement Lever has the angle of inclination shown in Figure 15.1. Figure 15.1. A Reinforcement Lever Based on Perfect Foundation and Engagement Assessments When your lever has this angle of inclination, you recognize the importance of Principle 7 in our model, shown in Figure 15.2. In this model, it’s clear to see how Principles 1, 2, and 3 influence the angle of inclination. Same for principles 4, 5, and 6. Figure 15.2. Principles 1 Through 6 Influence Principle 7 You want to strive for a 45-degree angle of inclination, starting at the bottom left. If you have a 45-degree angle starting at the top left, you have a big challenge to improve your reinforcement program. Your scores on both assessments are zero. Next we’ll see how to interpret the shape of your reinforcement lever if your angle is less than 45 degrees—or even horizontal. The position of the fulcrum is important to know. Is the fulcrum positioned at the bottom, in the middle, or closer to the top? The ideal position of the fulcrum is exactly in the middle of the scoring overview. The ideal Reinforcement Lever has a: In Table 15.1 are the most common reinforcement levers, a total of seven shapes. Table 15.1. Seven Common Reinforcement Levers Many different reinforcement levers are possible, more than I can show here. In the following section, you have the opportunity to chart your scores from the foundation and engagement assessments and see what your own reinforcement lever looks like. If you completed all of the principle assessments, you have to add up the scores from your Foundation Assessment (Principle 1, 2, and 3) and your Engagement Assessment (Principle 4, 5, and 6). You can use these scores to create your own reinforcement lever. In Figure 15.3, you can create your reinforcement lever by adding your overall scores from the Foundation and Engagement assessments. Find your score on the bars (Foundation score on Results bar and Engagement score on the Participation bar) and connect the two scores with a straight line and you have your reinforcement lever. It’s that easy. Figure 15.3. Create Your Own Reinforcement Lever Analyze the shape of your reinforcement lever and consider how you can improve the angle of inclination. The line’s angle indicates where there is room for improvement. The maximum score per assessment is 100 points. If you have a perfect score on both assessments, you did a good job. Well done. Compare your reinforcement lever with the shapes shown in Table 15.1. Check the angle of inclination and the position of the fulcrum. How did you perform? After you’ve built your reinforcement program, use your reinforcement lever to see how well you are doing. Ask between two and five other people from your team or other departments to complete these assessments, too. Find the average score to see how the group thinks you’re doing overall. Good discussions on the angle of inclination will help you determine your development areas. If you have these discussions with your team members, avoid explaining what you did and focus on why you made certain choices. Focus on the why instead of explaining the what. In Table 15.1, the different shapes are ranked based on a strong or a weak reinforcement program, numbered from 1 to 7. The shape of reinforcement lever 1 indicates the strongest reinforcement program, focused on great results and good participation. The shape of reinforcement lever 7 indicates a very weak reinforcement program; it will gain no results and no participation. The reinforcement levers are ranked based on results first and participation second. To create behavioral change and impact in your organization, don’t focus on one of these outcomes; find the correct balance. Every lever shape has a reason. In the sections that follow, I will explain each of the seven shapes and encourage you to improve, if the shape represents your lever. You have completed both the foundation and engagement assessments. By shape of the reinforcement lever, I have made suggestions for improvements. It is important to analyze your score for each principle. To help you quickly see the areas that need improvement, use Table 15.2. Complete the “My Score” column to know where your focus should be when you analyze your reinforcement lever. (These tools are also in the Appendix to this book.) Table 15.2. Principle Scores Overview Shapes 1 through 3 gain results and drive participation. The improvement for shapes 1 through 3 is less radical. The + and – in Table 15.1 indicate the effect on results and participation. Shapes 1 through 3 fall in the “optimize” category. Shapes 4 through 7 need changes. The – and – indicate little or, in worst-case scenarios, no results or participation. If you have these shapes, you must intervene. The position of the fulcrum also determines your improvements. If its position is lower than the middle point of the overview, your focus needs to be on the foundation (Principles 1, 2, and 3). If the position of the fulcrum is above the middle point, your focus for improvement should be on engagement (Principles 4, 5, and 6). I have a question for you: if the fulcrum is close to the middle point and your reinforcement lever shows an angle of inclination less than 45 degrees, what should you improve? The correct answer is C, foundation and engagement. Your development focus should be on all six principles. Remember, Behavior Change = Foundation × Engagement, BC = F × E. Check your assessment for each principle and improve with small, specific steps. Focus on your development to get the fulcrum in the middle of the overview and at the same time balance improvements on results (1, 2, and 3) and drive participation (4, 5, and 6). If your reinforcement lever looks like Figure 15.4, congratulations. You applied all 7 Principles well, and your program is ready to launch. Challenge yourself and use the S.A.F.E. method, as described in Chapter 16, to determine how well you wrote your reinforcement messages. Figure 15.4. A Solid Reinforcement Program In Figure 15.5, the score of the engagement assessment is high (or high enough), and you have a lower score (between 70 and 40 points) on the foundation assessment. Because of this, the angle of inclination is less than 45 degrees. The same shape comes up if your score on the foundation assessment is high (or high enough), and the score of the engagement assessment is lower, between 40 and 70 points. In both situations, the angle of inclination is less than 45 degrees. Figure 15.5. This Reinforcement Program Could Use Some Work It’s important to strive for a 45-degree lever. So, if yours looks like Figure 15.5, you need to improve Principle 1, 2, or 3. If you have the same shape (less than 45 degrees) but your score on the engagement is between 40 and 70, you need to improve Principle 4, 5, or 6. Although the shapes appear to be the same, your improvement areas are totally different. Check the shapes in sections 3 through 7 to discover how you can improve your score on each topic. The reinforcement lever in Figure 15.6 shows a horizontal line. If your lever has this shape, your reinforcement program will lead to some results and will drive some participation, but it is a mediocre program. The strong part of this reinforcement program is that this lever has a fulcrum in the middle of the overview. So at least the foundation and engagement principles are in balance. Figure 15.6. A Mediocre Reinforcement Program Two other reinforcement levers are horizontal, but they don’t have the fulcrum in the middle. Shape 4 has the fulcrum above the middle, almost at the top, and Shape 6 has the fulcrum lower than the middle, almost at the bottom. Neither of these horizontal reinforcement levers is in balance. Compared with Shapes 4 and 6, this reinforcement lever (see Figure 15.6) is in balance. The improvements you should make are less radical. Compare your scores on the principles with the maximum scores and determine where improvements are needed for both foundation and engagement. Determine where you scored lowest in both sections and select some quick wins. It is important to work on both areas at the same time. If you only improve foundation or only improve engagement, you lose the balance and your shape will be different. When you work on them simultaneously, the horizontal lever will change into Shape 1, and you keep the fulcrum in the middle. This is a horizontal lever far above the middle. If your reinforcement lever looks like Figure 15.7, you need to motivate your learners continuously. Although your program is perfectly focused on the phases of behavioral change, all reinforcement gaps are taken care of, and a solid measurement plan is included, you will have problems keeping learners engaged and participating. Figure 15.7. Learners in This Reinforcement Program Need More Engagement Your learners don’t see the value and don’t recognize themselves in your reinforcement program. They don’t feel challenged; their brains go into lazy mode. The learners are frustrated or bored because the challenges are not a good fit with their skills level or needs. Check Table 15.2 to see where your score is compared with the maximum score. Focus your development on Principles 4, 5, and 6. After you complete all your improvements, retake the engagement assessments. You may be able to create Shape 2, or even Shape 1. The reinforcement lever in Figure 15.8 shows a declining line instead of a rising one. Remember, always strive for a rising line. Compare this figure with Shape 4; this reinforcement lever reflects a program with no focus on results and low participation. This reinforcement program will have a huge dropout rate at the beginning. Learners are not inspired by the program; they don’t see any value to spending time on this reinforcement program; and it’s not activating their brains. Figure 15.8. A Reinforcement Program with Low Participation Perhaps learners experience the measurements as an assessment tool; in other words, they think measurements are for the organization and won’t help them apply new skills and knowledge. They don’t feel a personal touch, and because the program is not based on a strong foundation, the learners don’t feel it will help them change their behavior. This program needs extensive adjustments. A good reinforcement lever is rising, not declining. Check your scores against the maximum scores for all assessments. Start with your analysis of the principles related to engagement (Principles 4, 5, and 6) because you already have some high scores on the foundation. By improving engagement you can help your reinforcement lever to become more horizontal, which is required to change a declining line into a rising line. Read the suggestions on what you can do to reach a more horizontal line, like Shape 3. Work on the position of the fulcrum by checking some quick wins in Principles 1, 2, or 3. Don’t ignore the messages behind this shape. If you start with this reinforcement program, you will have a hard time. It must be redesigned. Shape 6 and Shape 4 have the same horizontal line. The difference is that in Shape 6 in Figure 15.9, the line is far below the middle. If your reinforcement lever looks like this, you did a good job on your engagement. The learners will experience a personal program where their brains need to work. However, the program will experience a huge dropout rate later. If people don’t obtain results or don’t see any progress, they start to question the benefit of the program. Figure 15.9. A Reinforcement Program with Good Participation but Limited Progress The difference between Shape 6 and Shape 5 is the timing of dropout. In Shape 5 a high percentage of dropouts takes place in the beginning of the program; in this Shape 6, the dropout happens later. When using this program, don’t let the first period of time mislead you. Monitor the participation carefully, even when your score is almost the maximum. Improve all three principles for foundation (Principles 1, 2, and 3). First check whether you are holding this book upside down. Just kidding. If the shape of your reinforcement lever looks like the one in Figure 15.10, don’t expect any results or participation. Although the angle of inclination is 45 degrees exactly, the line is declining. For an effective reinforcement program, you need a rising line. Figure 15.10. A Reinforcement Program with No Participation and No Results This shape typically occurs when you break your training materials into pieces and use them as reminders to your learners. A successful reinforcement program is much more than that. It’s not a reminder program, and it’s not retraining. It’s a well-thought-out process of perfectly balanced messages that drive behavior change to create impact in your organization. Don’t waste your learners’ valuable time and hope to achieve some results from this reinforcement program. The only thing you will get is low participation. You can check your foundation and engagement assessment scores, but you already know the outcome. There are no shortcuts in top-level sports, and there are no shortcuts in reinforcement training.
UNDERSTANDING REINFORCEMENT LEVERS

Lever Number
Shape
Results
Participation
1

++
++
2

+
++
3

+
+
4

++
–
5

+
–
6

–
++
7

–
–
PLOTTING YOUR REINFORCEMENT LEVER
ANALYZING THE DIFFERENT REINFORCEMENT LEVERS
Principle
Max Score
My Score
Attention
Improvement
1. Master the 3 Phases
24
![]()
11–16
< 11
2. Close the 5 Reinforcement Gaps
32
![]()
14–23
< 14
3. Create Measurable Behavior Change
44
![]()
20–32
< 20
4. Provide the Perfect Push and Pull
24
![]()
12–19
< 12
5. Create Friction and Direction
32
![]()
17–26
< 17
6. Follow the Reinforcement Flow
44
![]()
22–35
< 22
Shape 1

Shape 2

Shape 3

Shape 4

Shape 5

Shape 6

Shape 7
