
Chapter 8
Analyzing your Security Information with FortiAnalyzer
Information in this chapter:
• Configuring the FortiAnalyzer
• Network Interface Configuration
- High Availability Devices Configurations
• Controlling storage utilization
• Traditional Flat File Reports
• FortiAnalyzer Generated Alerts
• Additional FortiAnalyzer Features
• eDiscovery Filtered Log Views
While current FortiGate with local storage devices provides integrated log viewing and reporting, this only allows the administrator visibility into events that occur on that device. To provide this level of awareness to an entire enterprise, it is helpful to combine all events, often via a syslog server. Once this is done, it becomes possible to generate reports for the entire organization. Within the Fortinet product family, this need is filled with the FortiAnalyzer.
The FortiAnalyzer, in addition to serving as a log target, provides a location for long-term storage. This can be used for packets tagged by the IPS engine, payload data detected by AV, or transactions captured by the DLP system. This data is important as without it, it becomes difficult to trace an incident or tune your system.
However, there are two issues that people commonly encounter with a straight syslog implementation. The first is the amount of data. Syslog maxes out at 1024 bytes per call, but some packets are larger than this. The second issue is that many sensors have an IP address that is assigned via DHCP and is therefore changeable. To address these problems, Fortinet has developed a proprietary secure transfer protocol with a higher size limit and that uses serial numbers to encode data, breaking the reliance on source IPs for identification. This is what the FortiAnalyzer uses. Once on the FortiAnalyzer, the native interface can be used to decode the packet data and display it in a human readable format.
The FortiAnalyzer is also capable of continuous monitoring and reporting, which can augment your existing security and compliance teams. Your audit teams can get automated reports detailing which DLP triggers have been activated on all FortiGates in your enterprise. Your incident managers can be alerted as events without having to configure individual units. Also, your operations people can leverage the vulnerability assessment tools to keep all systems fully patched.
Configuring the FortiAnalyzer
Much like other Fortinet products, the FortiAnalyzer supports virtualization. Referred to as ADOMs (Administrative Domains), these virtual domains are used to isolate devices and user accounts. A regular user account only has visibility into the data for the devices in their ADOM.
Network Interface Configuration
All FortiAnalyzers have multiple Ethernet interfaces. These interfaces exist to allow the separation of log delivery from administrative access from other services such as log aggregation and the interface to Web Services. If each interface is configured, the device will act as a multi-homed host. It will not route between the interfaces in either static or dynamic mode.
Smaller organizations may wish to avail themselves of the Fortinet Discovery Protocol. This allows the security devices (FortiGate, FortiClient, and FortiMail) to automatically discover any FortiAnalyzers on the network. This capability does require the systems to share a Layer 2 network connection.
The interfaces are configured similarly to those on a FortiGate. From the WebUI, navigate to System → Network → Interface. Then select the interface you wish to edit, either by double-clicking the row or selecting the checkbox and clicking “edit” in the menu bar. This is also where you would enable the Fortinet Discovery Protocol, control the network access allowed and whether to enable the Web Services or log aggregation capabilities.
File System Configuration
All FortiAnalyzers larger than the 100 series support multiple disk drives. These may be configured to various levels of redundancy via RAID. In accordance to the limitations of RAID, devices with a limited number of disks are also limited to the type of RAID that they support. For example, in a dual-disk device like a 400B, the types of redundancy would be limited to simple striping (RAID-0) or mirroring (RAID-1). These two raid levels are implemented in software. For reasons of speed, more complex RAID levels are implemented in hardware. So long as a sufficient number of drives are installed, all RAID options are supported.
Data Storage Options
When first introduced, the primary requirement of the FortiAnalyzer was to store log messages quickly and efficiently. Thus, logs were simply files to which the system continuously appended. Then, when reporting was required, a custom binary indexing process was developed, so the reporting engine would quickly locate the relevant data.
However, as the number of logs received began to climb and the reports became more complex, it became necessary to move from log files to a full-fledged database. Today, this design allows for users to create their own reports and, if they wish, store data in an external MySQL database. By making this change, total storage capacity is no longer linked to the size of local storage. Additionally, data backups are simplified and the CPU impact from generating long and complex reports is drastically reduced.
However, when moving to a database design, there is a latency issue where, when the system is under load, packets may come in more quickly than they can be logged. This is why, even when a database is configured, the FortiAnalyzer stores to local disk in the form of raw text files and then periodically inserts data from those files into the database.
Configuring Data Storage
While it is possible to switch between using local text files and a database (local or remote), it is not always possible to migrate the stored data. Thus, if you decide to switch from text to SQL, you will likely lose historical information and reports will need to be regenerated. To do this, use the WebUI to navigate to System → Storage and select the option that you need. However, you can migrate a certain amount of data from text to SQL. Thus, when you switch to one of the SQL options, you will be prompted to supply a start data and time. If you plan to insert a very large number of log messages into the database, you should begin the process at a time when the number of logs being received is low (after hours) and also temporarily disable report generations. This will reserve more system resources to the log migration.
Adding Devices
The default FortiAnalyzer configuration allows it to receive and process log messages from any device. This, however, may not be preferred. This is particularly true if the FortiAnalyzer has an interface that is publicly reachable. As an alternative, you can configure the FortiAnalyzer so it only accepts logs from specific devices. This is enabled in Devices → Unregistered Options → Known Device Types. Then, select the radio button for “Ignore connection and log data”. If using the CLI, you can set the handling option under “config log unregistered” to “drop-all”.
Obviously, using this feature requires the administrator to manually add the devices to the FortiAnalyzer before it may save their log messages. If a FortiAnalyzer is configured to ignore unregistered devices and it receives an unauthorized log message, this device will appear in the “Blocked Devices” list. They can be activated by simply selecting them and clicking “Unblock” from the menu bar. If the administrator manually adds a device to the FortiAnalyzer prior to it sending logs, it will immediately be activated and all logs will be stored.
The administrator has device-level control over what types of log data will be processed by the FortiAnalyzer. While the default behavior is to accept all log messages, including enhanced logging (IPS packet captures, AV quarantined files, DLP detections, etc.), this can be changed in the WebUI from Devices → Allowed → Device. Simply select the checkboxes from the list of “Device Privileges” (see Figure 8.1).
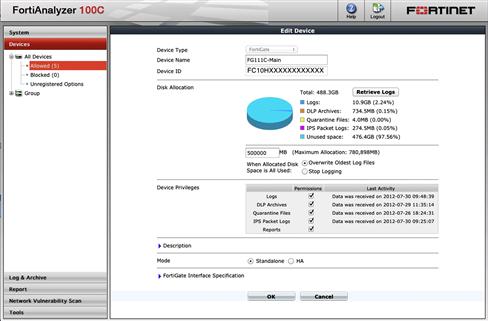
Figure 8.1 Changing FortiGate Device Logging Privileges GUI Setting
High Availability Devices Configurations
Multiple FortiGate units operating in a HA cluster generate their own log messages, each containing that device’s Serial Number. By default, these will appear on the FortiAnalyzer as independent devices. After all, no information is passed in the log message to indicate that the unit is part of a cluster. To change this behavior, the administrator must logically combine the individual units in the FortiAnalyzer’s configuration. This simplifies the use of other features such as alerts and reports, as the cluster can be incorporated by reference and used as if it were a single device.
To convert a standalone device to an HA configuration, select one of the devices from the cluster, then select the edit option. From there, set the Mode radio button to HA. At this point an additional dialog will open and the administrator can select unallocated devices to the HA cluster, select the desired units from the List of Devices, and move them to the Membership side using the right arrow icon (see Figure 8.2).

Figure 8.2 Adding FortiGate Device into a HA Logging Group GUI Setting
Controlling Storage Utilization
When a FortiGate is configured for extensive logging, you run the risk of a particularly busy FortiGate using an excessive amount of storage, reducing the amount available to the other devices. This may prevent you from storing logs for as long a duration as you wish off of devices that do not generate as much data. This will, of course, also affect the age from which you can generate reports.
If you do have a device that generates abnormally large amounts of data, it is possible to configure per-device disk quotas to ensure that sufficient storage remains available. To assign this in the WebUI, navigate to the desired device and select the “edit” option. The next dialog allows you to specify the amount of storage allocated to that device. When a device reaches its configured quota, the FortiAnalyzer will automatically begin deleting the oldest data until the device is once again under the quota “low-water” mark.
It is possible to oversubscribe the total storage capacity when doing this. If this occurs and the oversubscribed unit runs out of storage space, it begins to delete data from all the devices until the oversubscription is solved.
Grouping Devices
Most organizations find it desirable to generate a report for a common set of Security Enforcement Points (all Internet firewalls, all remote offices, etc.). While you may individually select the devices when creating a report definition, that can lead to a lack of consistency. To avoid this, the FortiAnalyzer allows the administrator to create a group of FortiGate devices (or VDOMs). This group is then used in all report definitions.
Configuring Reports
To give you an idea of the type of reporting available, there are a number of predefined reports available on the FortiAnalyzer. In addition to the Cover Page, the typical report consists of a set of graphical elements, a data table, and an optional textual description. The graphical element for each report is chosen to best represent the type of data in the set. For example, a protocol breakdown uses a pie chart, while a report that compares values over time will typically use a stacked bar chart.
The textual elements are useful for customizing the report to the target audience. You may choose different textual contents if the recipient is a C-level executive, an auditor, or the IT staff. For example, the executive may not be interested in the details, but information about the amount of non-HTTP(S) traffic or changes in the amount of total traffic could be useful as that indicates overall trends. In contrast, the IT staff would be interested in specific protocol and application data.
It is also possible to have the reports automatically generated and distributed. Reports can be emailed to a recipient list or uploaded to a remote system via (S)FTP. This can be used to integrate the reports into an already existing portal. Each report can be uploaded to a unique destination directory as necessary.
Traditional Flat File Reports
Flat file reports are being rapidly deprecated in favor of the far more flexible SQL-backed reporting. This allows for increased scalability by moving the SQL Database engine to an external system.
It is still possible to use the flat file-reporting engine in the 4.3 version of the FortiAnalyzer firmware. However, this was primarily intended for backwards compatibility during the upgrade process from earlier releases. In environments where this is in use, the administrator should plan to migrate to the SQL-based reporting system before applying the 5.0 release. In this release, the flat file report system is being completely removed.
SQL-backed Reports
A SQL database engine for reporting was first introduced in the 4.2 FortiAnalyzer firmware. Over time, the capabilities and report creation/configuration tools have matured to where there is no longer any reason to continue with the flat-file backed reporting. You can choose to use either the built-in SQL database server or you can configure the FortiAnalyzer to act as a SQL client to a database server. At this time, only MySQL is supported for external access. Configuration for SQL logging options is located under System → Config: SQL Database as shown in Figure 8.3.
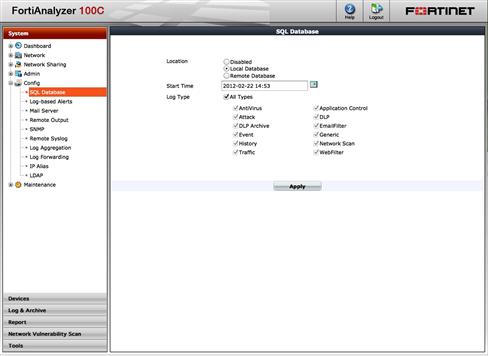
Figure 8.3 SQL Database Configuration Options
There are many predefined reports that are likely sufficient for most users’ reporting needs. Each report is comprised of a number of both graphical and textual elements. These basic components are referred to as charts. They display the output of a SQL query. The actual query itself is referred to as a dataset. The dataset determines the data to be returned while the chart configuration determines the number of rows returned and allows for more friendly names to be used for the returned data.
Report Server
In addition to the delivery methods provided when defining reports, it is also possible to provide the reports via either SMB/CIFS or NFS. Since this can expose the FortiAnalyzer to additional load, these options do not appear in the WebUI by default. To make the options visible, navigate to System → Admin → Settings and then select the “Show Network Sharing” option. Once the configuration pages are visible, you can configure these file sharing protocols by navigating to the Network Sharing option under “System” and then selecting the desired protocol.
SMB/CIFS Configuration
The FortiAnalyzer can act as a standalone SMB/CIFS workgroup server. It will use the NetBIOS protocol suite, but cannot join an existing domain. Think of the FortiAnalyzer as if it’s an older pre-AD windows server.
To activate this, navigate to System → Network Sharing → Windows Share and specify a windows workgroup name. Then select the “Create New” option. This will allow the creation of share names that represent a specific subdirectory branch point. For example, a share called “Reports” allows access to the FortiAnalyzer directory/Storage/Reports, which is where the reports are stored.
NFS Configuration
The FortiAnalyzer can also act as a NFS server. Providing read-only or read-write access to the existing device logging & reporting directories or a custom shared folder can be created. Access is based on the NFS client source IP, FQDN, or network.
To activate this, navigate to System → Network Sharing → NFS Export then checkbox “Enable NFS exports”. Once the NFS service is enabled, define the NFS shared directory by selecting the “Create New” option. Specify the “local path” then add the remote NFS client access rights one at a time under “Remote Client” for read-only or read-write access to the specified Local Path.
When mounting to a FortiAnalyzer NFS shared, it is recommended to use the reserved socket port number “resvport” as part of the NFS client option settings.
FortiAnalyzer Generated Alerts
The FortiAnalyzer can operate as a lightweight event correlation engine and send alerts for correlated events to remote syslog servers, SNMP Trap Receivers, and a list of SMTP destinations. Multiple destinations of each type are supported, allowing for multiple event correlation configurations, each with a different list of alert targets.
The alert destinations are configured globally, under System → Config, Remote Syslog, Mail Server, and SNMP respectively. These destinations are then available when you configure alerts. This way, when an incoming log message is received, it is evaluated against the list and any counters are incremented as necessary.
An alert can be configured to match log messages from a single device, multiple devices, groups of devices (shown in blue in the WebUI), or any combination thereof. To trigger an alert, a combination of message type and severity is required. Multiple combinations are possible. Internally, these combinations are logically OR’d together so any match will trigger. In addition to type and severity, you may optionally add a text matching rule. This filter is AND’d with the type/severity filters so that alerts may be matched more precisely.
One risk you face is that a poorly defined alert could result in a flood of alert messages, so an attack against your Fortinet infrastructure could inadvertently result in a denial of service. To avoid this, it is wise that you also configure threshold conditions. This way, an alert will only be generated when a level is exceeded.
Log Aggregation
When a FortiGate is configured to log aggressively, the volume of messages can be surprisingly high. For example, a single packet flow could generate traffic, web filtering, application control, and IPS log messages. To avoid the impact that this can create on a WAN, FortiAnalyzers can be distributed throughout the environment. By placing a FortiAnalyzer on a local network segment, logs are not natively passed across the small WAN links. Instead, they are stored locally and forwarded in compressed batches to the central collection point. This is more efficient than transferring each individual log entry.
A single FortiAnalyzer may be configured to operate either as a collector or an aggregator. A collector will send logs to an upstream aggregator on a password-protected connection (TCP/3000). However, as there is only level of aggregation available, you cannot have one aggregator forward to another.
To configure a FortiAnalyzer for either mode or to disable a previously configured FortiAnalyzer, navigate to System → Config → Log Aggregation, and select the desired option. The password that you enter must be identical between the collector and aggregator. Thus, all collectors that report to the same aggregator must use the same password. This is also where you define the timing for log forwarding. To avoid overwhelming the aggregator, it is recommended that you stagger the upload times.
As of FortiAnalyzer 4.3 you can configure this more simply by setting the “operating mode”. From the WebUI dashboard, select the “Change” option in “operation mode” in the System Information widget. Then select with mode it will run in: standalone, collector, or analyzer. The term “analyzer” is the same as “aggregator”. In this mode, all menu options are available. However, if you select the “collector” mode, you will no longer have the ability to create and run reports on that device. After all, the device will no longer be storing logs, so creating reports wouldn’t make much sense.
If you do change modes, be sure to back up your configuration, as when the menu options are disabled, any previous configuration will be removed.
When configuring a collector, you must specify the IP address of the FortiAnalyzer acting as an analyzer/aggregator. At this point, you will also have the opportunity to define the timing, as mentioned above, or to set the forwarding to take place in real time… based on severity. This allows significant events to be acted upon more quickly. If you do this, it must also match the configuration on the analyzer. This way, an administrator may enable or disable real-time log processing without having to change it on each and every collector in the environment. You can also tell the analyzer to run a de-duplication process, purging all duplicate log entries. This will save space, at the cost of increased CPU usage when the updates are processed.
Log Forwarding
As an organization grows, it becomes ever more important to send all log information to a single central source. This way, information may be gathered from FortiGates, routers, switches, and host-based security products and processed in once place. These are often centralized on third party SEIM (Security Event Information Management) products like Arcsight, Netforensics, LogRhythm, and Security Onion. These products typically work by receiving syslog messages.
If you desire, you can send syslog messages from each FortiGate directly to your SEIM. However, this approach does not scale well for widely dispersed networks. Bandwidth can fill up rapidly and the amount of log storage can grow beyond what the infrastructure can support. To avoid these issues, it is often best to configure a FortiAnalyzer to receive all log entries, de-duplicate them, and then pass them along to the SEIM. Not only is this more efficient in terms of network capacity, but as many SEIMs are licensed based on total amount of data processed, this can reduce licensing costs as well.
To configure Log Forwarding, navigate to System → Config → Log Forwarding and select the option to “Enable log forwarding to remote log server”. Once this is enabled, you must enter the IP address of the remote system and the severity of the messages to forward. You may also forward all logs or only specifically the “authorized” logs coming from those devices in the “Allowed category” in the Device configuration section. The “authorized” logs can be further tuned to a minimum severity level of log forwarding. The severity levels are Debugging, Information, Notification, Warning, Error, Critical, Alert, and Emergency. Based on the provided order of severity, the Debugging level provides the most verbose level of logging then as the severity level increases the amount of potential events is lowered. By default, severity level is set to “Information”. For a breakdown on the various logs generated per severity, Fortinet has this publicly documented under their “Log Message Reference” for each FortiOS release.
Log Migration
At some point it may become a requirement to upgrade your FortiAnalyzer to a model with greater capacity (disk or CPU/RAM). To help transition existing log data to the replacement FortiAnalyzer, the log migration feature can be configured for this task.
By default, the GUI configuration for log migration is disabled. To enable the option to configure log migration, go to Admin → Settings and select & apply “Show System Migration”.
For log migration to work, the following criteria are needed:
1. Both FortiAnalyzers are recommended to have the same firmware version. At minimum for migration to work both FortiAnalyzers need to be at version 4.0 MR1 or higher.
2. There is a two-migration mode role a FortiAnalyzer can be configured for. The FortiAnalyzer that contains the logs to migrate from is considered the “source” role and the FortiAnalyzer where the logs are being migrated to is considered to be the “destination” role.
3. The “source” FortiAnalyzer would be required to reboot into migration mode. Once the source FortiAnalyzer is in migration mode, it could not accept any further log entries until the migration is completed and the unit is rebooted back into a non-migration mode. During the migration, the “destination” FortiAnalyzer can be configured to accept new log entries.
To enable log migration mode on the “source” FortiAnalyzer, go to Maintenance → Migration; select role as “source” then define the FortiAnalyzer IP address under Peer IP where the logs would be copied to then click “apply”. Before starting the migration, the destination FortiAnalyzer would need to be configured. On the destination FortiAnalyzer, make sure the migration feature is enabled to be configurable under Admin → Settings then under Maintenance → Migration; select role as “destination”, define the source FortiAnalyzer IP address under Peer IP then define the Password which would be the administrator password used on the source FortiAnalyzer. To allow the destination FortiAnalyzer to accept new logs while performing the migration, select “Accept Logs & Data”. To restrict certain content from being migrated, the setting under “All Categories” can be deselected to not migrate the particular category.
Once the source and destination migration settings are completed, there is an optional setting to test the migration connectivity before actually running the migration. As shown in Figure 8.4, clicking on the “test migration” would perform this function, which would be done on the destination FortiAnalyzer.
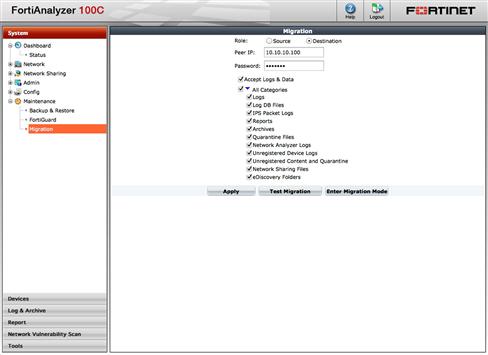
Figure 8.4 Log Migration Destination FortiAnalyzer with Test Connectivity
Once the connectivity is confirmed to start the migration, select “Enter Migration Mode”. Monitoring of the migration status and progress can be done on the destination FortiAnalyzer.
Configuring FortiGates
A single FortiGate can be configured to send data to up to three separate FortiAnalyzers. Each of these is configured separately, though only the first may be configured via the WebUI. To configure the other two devices (for redundancy), you must use the CLI. Each defined FortiAnalyzer can also be configured to receive only specific log messages, as defined by log-type filters. These filter rules are also only available via the CLI.
Direct Logging from Cluster Units
Clusters can create a very large number of log messages. This can negatively affect user traffic, especially since log messages may only be forwarded out the primary unit, as it is the only one with an active IP address.
For these high volume log scenarios, you may use a dedicated interface to send the log messages. This interface would not be managed by the FGCP configuration sync process. This process uses its own IP addresses via hidden system VDOMs which prevents routing or MAC table overlap issues. Once an interface is dedicated to log forwarding, it is effectively isolated from the system and cannot be used for any other purpose. Due to the special nature of this configuration, it is only available from within the CLI.
FGT (ha) # set ha-mgmt-status enable
FGT (ha) # set ha-mgmt-interface <interface name>
FGT (ha) # set ha-mgmt-interface-gateway <ip address>
FGT (interface) # edit <interface name>
There are similar configuration options for the non-FGCP clusters, but those are not commonly deployed and have configuration requirements that are beyond the scope of this book. If you have this need, please discuss the requirements with a Fortinet product specialist.
Testing Configuration
When troubleshooting configuration, it can be very useful to have the ability to test configurations. From within the WebUI of a FortiGate, you may navigate to Log & Report → Log Config → Log Setting → Upload Logs Remotely. In this area, you will see a “Test Connectivity” link. However, this will only test the validity of the TCP connection. So, it can determine device capability and reachability, but cannot verify that the log messages will actually be processed. To do this, you must use a CLI command.
generating a system event message with level - warning
generating an infected virus message with level - warning
generating a blocked virus message with level - warning
generating a URL block message with level - warning
generating a DLP message with level - warning
generating an attack detection message with level - warning
generating an application control IM message with level - information
generating an antispam message with level - notification
generating an allowed traffic message with level - notice
generating a wanopt traffic log message with level - notification
generating a HA event message with level - warning
generating netscan log messages with level - notice
The “diag log test” command would generate several fake log types from the FortiGate to the log destination configured such as a FortiAnalyzer and/or a Syslog server. The fake logs are usually denoted with a source or destination of a “1.1.1.1” address.
Additional FortiAnalyzer Features
In this section we’ll cover the remaining FortiAnalyzer features that are included with most FortiAnalyzer hardware and VM versions. FortiAnalyzer Hardware and VM platforms supporting 4.0 MR3 (as of this writing) will support these discussed features. Older FortiAnalyzer hardware models that are limited up to 4.0 MR2 or below may not. It is best to consultant Fortinet FortiAnalyzer product and release note documentation to cover hardware model support for various firmware versions.
eDiscovery Filtered Log Views
eDiscovery or Electronic Discovery is a term used in legal litigations that deals with the exchange of information stored in electronic format. The FortiAnalyzer includes a section to specifically sort archived email message for eDiscovery usage. Archiving of email messages is accomplished via the FortiGate DLP feature covered in Chapter 7.
Besides providing a filtered sort, view, and download of filtered content, the FortiAnalyzer also generates a MD5 and SHA1 digest calculated on the downloaded file. Having a corresponding MD5 or SHA1 hash can confirm the exact copy of data extracted from the FortiAnalyzer device.
eDiscovery can be configured under Log&Archive → eDiscovery. The general steps are highlighted in the following order to help create a eDiscovery output:
1. Create a folder to store the eDisovery sorted log data under Log&Archive → eDiscovery:Folders
2. Run the search function base on the filtered criteria needs to extract email messages needed in addition define the “save to folder” option of the folder created in step 1 to save the output to.
3. Go back to the created folder in step 1 to view and download the email messages that were logged based on the search filter functions performed in step 2.
Restriction on disk space set aside to store the filtered eDiscovery logs can be defined under Log&Archive → eDiscovery: Config.
Network Vulnerability Scanner
FortiAnalyzer includes a network-based scanner that provides the ability to conduct scheduled or on-demand TCP/UDP port, OS detection, and network application-service vulnerabilities scans. These scans can be conducted toward a single to a subnet range of hosts. Depending on FortiAnalyzer platform, the maximum number of hosts and number of concurrent scans could vary. Consult Fortinet FortiAnalyzer Administrator guide for an updated list of platform and respective max values.
The operation of the network vulnerability scanner is included with the cost of the FortiAnalyzer solution. For an updated list of network application-service vulnerabilities, a FortiGuard subscription service is required.
To launch a network vulnerability scan, follow the following steps in order:
1. Define an asset to be scanned under Network Vulnerability Scan->Assets Definition. This could be a single or range of hosts’ definition. In addition, Microsoft Windows or Unix authentication can be defined to provide more granular host level access to conduct further system level logging and vulnerability assessments.
2. Define when and how to perform the scan for the defined asset created in the above step. This is created under Network Vulnerability Scan->Scan Schedule. Select “create new” to start the Scan Schedule definition which would involve selecting the asset(s) to scan as defined in step 1, choosing the vulnerability scan mode of Quick, Standard, or Full then defining whether to schedule the scan or run it on-demand.
The scan progress can be seen for each scan scheduled under Network Vulnerability Scan → Scan Schedule. Once the scan is completed, the report is produced under Network Vulnerability Scan → Vulnerability Results.
The vulnerability reports can provide a high-level executive summary and a breakdown of service ports discovered, the operating system detected, and any vulnerabilities discovered. Detail of the discovered vulnerability within the report would provide the individual vulnerability URL link to the FortiGuard website outlining the vulnerability severity, impact, description, recommend actions to remediate the vulnerability, and any third-party references such as BugTraq, CVE, or MS Bulletins.
Network Analyzer
The network analyzer feature is a network sniffer that can be used to assist with network diagnostics and troubleshooting. This feature requires the configured network analyzer port on the FortiAnalyzer to be connected to a switch SPAN port to assist with the preferred network segment captures. The captured packets can be displayed historically or in real time via the FortiAnalyzer web GUI console. In addition, the capture raw traces can be downloaded into text or CSV format. Rolling over of the capture traces can be uploaded via FTP, SFTP, or SCP to an external server for storage.
By default, this feature is hidden. To enable network analyzer feature, go to System → Admin: Settings and select & apply “Show Network Analyzer”. Once enabled, the feature would be located under the left menu “Tools” section.
To launch a network capture, the following steps are performed:
1. Set up a SPAN port on switch for the network segments needed to be monitor. The FortiAnalyzer would need to have physical Ethernet connectivity to the switch SPAN port for the network analyzer to function.
2. On the FortiAnalyzer, go to Tools → Network Analyzer: Config and checkbox “Enable network Analyzer on” then select the FortiAnalyzer port where the SPAN port is connected.
3. Optional settings could involve defining the allocated disk space for storage of the network capture traces, defining the log roll over settings based on size along with time frame, then option for uploading the logs once it’s rolled over to an external site via FTP, SFTP, or SCP.
To view the captured traces, go to Tools → Network Analyzer: Historical. To view the logs in real time, click on the icon with the clock on the document. There are options to add additional column views, sort each column by clicking on the funnel icons next to the column names, and ability to print the filtered historical views.
To browse historically collected captures and also to download the captures, go to Tools → Network Analyzer: Browse.