
5
Principles of Materials-Penetrating Ultrawideband Radar Systems
James D. Taylor
CONTENTS
5.3 Architecture and Operation of MPR Systems
5.5 Electromagnetic Wave Propagation in Solid Media
5.5.3 Transmission-Media Characteristics and MPR Design
5.5.3.1 Selection of Frequency Ranges for Solid Media
5.5.3.2 Characteristics of Diffusion Dispersive Media
5.5.3.4 Nondispersive Wave Transmission
5.5.3.5 Practical Frequency Spectrum for MPRs
5.1 Introduction
Materials-penetrating ultrawideband (UWB) radar (MPR) systems remotely sense objects within multilayered media such as soil, rock, concrete, wood, air, and biological tissue. This radar category includes ground-penetrating, through-wall, mine-detecting, and medical UWB imaging systems. These systems present special problems because of the varying velocity of the propagation signal, attenuation, and reflections from changes in the electrical properties of the media.
This chapter summarizes the basic theory of MPR systems technology. The particular electrical characteristics of media, such as conductivity, permittivity, and permeability, will determine the best operating-frequency range, choice of waveform, and the contrast of targets and surrounding media. Topics include applications, operating principles, frequency selection, and examples of imaging capabilities of the MPR systems. I recommend Ground Penetrating Radar, 2nd Edition by David J. Daniels [1] and Ground Penetrating Radar Theory and Applications by Harry M. Jol [2] for complete discussions of the MPR theory and design.
TABLE 5.1
Applications of MPR

5.2 Applications of MPR
Development of MPR systems started during the 1970s in response to a need to detect buried objects, tunnels, and objects such as firearms and military equipment concealed by foliage. Developments in antennas, transmitters, digital receivers, signal processing, and digital display technology increased the performance and capabilities of these systems. Companies now specialize in performing ground-penetrating radar (GPR) surveys for civil engineering, research, and forensic purposes. MPR systems continue to evolve, thanks to the wide variety of practical uses and improved technology covered in other chapters. Governmental limitations of the UWB radiation spectra and power levels will limit the performance of MPR systems built for unlicensed devices. Special licensed systems for defense purposes may have greater capabilities.
Although originally intended for geophysical and structural imaging, MPR technology has found a wide range of applications as shown in Table 5.1 [1,2]. These uses show the difference between the conventional radar systems and the MPR systems, which propagate and receive signal reflections through solid media.
5.3 Architecture and Operation of MPR Systems
The conventional radar designer can safely assume a signal that propagates through a homogeneous media with a constant velocity, attenuated only by range and limited by target cross-section (reflection). The MPR designer must find a frequency spectrum that provides a constant propagation velocity for the expected media materials and experiences high attenuation and reflection from all changes in the impedance of the media.
Figure 5.1 shows the basic architecture of an MPR system. Because of the wide variety of applications, the physical size of these systems may vary from small handheld devices to large systems, which require a special vehicle to carry the antennas and signal-processing equipment.

FIGURE 5.1
Typical MPR block diagram showing the system components and variable transmission media. (Reprinted from Ground Penetrating Radar Theory and Applications, Jol, H.M. (ed.), Figure 1.12, A.P. Annan, p. 18, 2009, with permission from Elsevier.)
After the air-media interface, the signal will be subjected to different electrical properties that affect the propagation velocity and attenuation. Changes in the media impedance cause signal reflections for detecting and imaging objects. The amount of reflected energy depends on the ratio of the impedances. Figure 5.2 summarizes the reflection process caused by different media.
5.4 Design of MPR Systems
The MPR designer must consider the end application performance requirements, design objectives, and technical considerations shown in Table 5.2 to determine the basic system specifications. MPR systems achieve small spatial resolution through large signal bandwidths. Most operational systems use simple short-duration (~1 ns) impulse (baseband/video pulse) waveforms. Some experimental MPR systems described in other chapters use longer duration wide bandwidth waveforms such as linear frequency modulation, step frequency, and random noise to achieve larger signal energy with small spatial resolution. Each waveform has advantages and disadvantages with respect to MPR design and specific applications. Chapter 4 shows the government regulations that limit the total power of several classes of unlicensed UWB MPR systems. Table 5.3 shows some of the waveforms that can provide UWB fine spatial resolution signals.
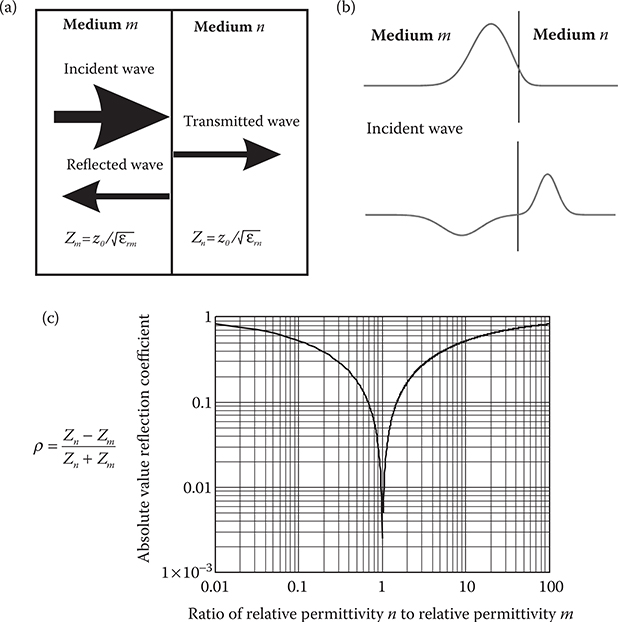
FIGURE 5.2
Reflection of radio waves between media. (a) Transmission line model for reflection from one media to another. (b) When an EM wave passes from one medium to another, part of the incident energy reflects and part passes through. (Adapted from Alexandrov, O. Transmission coefficient optics, 26 November 2007, open source: Wikipedia Commons.) (c) The reflectivity coefficient ρ depends on the impedances of the media. No reflection occurs when the two media have the same characteristic impedance Z.
5.5 Electromagnetic Wave Propagation in Solid Media
Effective MPR design requires understanding how electromagnetic (EM) waves and media materials interact, in order to select the best frequency ranges. This section presents a simplified discussion of media characteristics, signal propagation, and how media characteristics affect propagation and signal spectrum selection.
5.5.1 Media Characteristics
This section describes how media properties affect GPR design and performance. The transmission media shown in Figure 5.1 may include concrete, asphalt, clay, sand, stone, permafrost, ice, wood, soil, building materials, and animal tissue. Each type of media may have a wide range of properties that limit the MPR system’s performance for a given class of targets. The target size and its electrical permittivity contrast with the surrounding media will limit what a given MPR system can detect. The MPR designer must select a frequency spectrum based on design objectives, media materials, and experience. Existing systems specifications can provide practical guidance.
TABLE 5.2
MPR Radar Systems Design Criteria for Operational Effectiveness

TABLE 5.3
MPR Waveforms

These general rules help to explain wave propagation in any media:
Wave propagation depends on the interaction of the EM signal and the media through dissipation, conductivity, and energy storage.
Electrical dissipation results from the charge motion (or transport) called conduction. The moving charge’s momentum transfer during collisions converts electrical energy to thermal energy through joule heating.
Electrical conductivity describes how well a material can transport charge.
Electrical storage describes how applying an external force moves the charge from some equilibrium position, which results in a restoring force trying to move the charge back.
Dielectric permittivity describes the dielectric polarization property of the media.
Permeability describes the degree of media magnetization resulting from an applied magnetic field.
Dissipation and heating may also result from polarization changes, which move charges in the media [1–3].
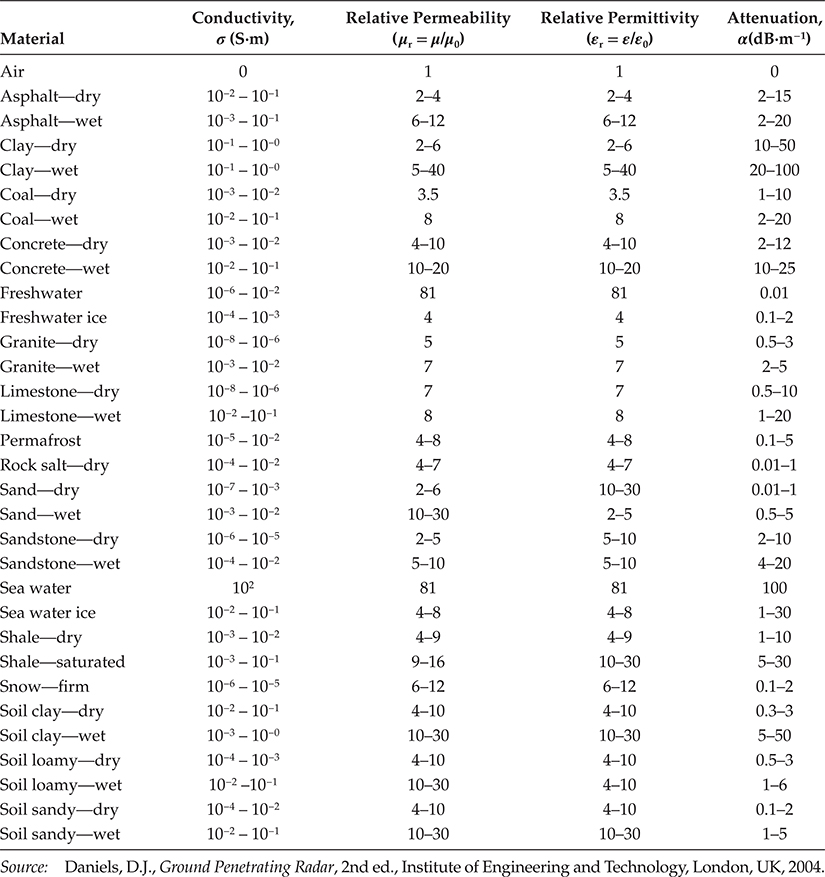
Table 5.4 shows typical ranges of the dielectric properties such as conductivity σ, relative permeability μτ and relative permittivity εr, and attenuation of common ground and building materials measured at 100 MHz. A later discussion of transition frequency shows how most substances have linear characteristics at frequencies above 10 MHz. Note that the wide variation in the values of conductivity affects wave attenuation. Chapter 9 contains information about the characteristics of animal tissues for medical sensing applications.
5.5.2 MPR Signal Propagation
The media conductivity, permittivity, and permeability characteristics will affect the velocity of propagation, the range of linear frequency effects, and the signal attenuation properties as follows:
Conductivity (σ): Determines the flow of current between two potential levels in the media as defined by Ohm’s law. Conductivity means the inverse of resistance, which is expressed in Siemens per meter (S·m-1 or A·V-1·m-1).
Permeability (μ): Relates the degree of magnetization of a material that responds linearly to an applied magnetic field, which is expressed in Henry’s per meter (H·m-1 or V·A-1·S·m-1).
Permittivity (ε): Indicates how a material permits (transmits) an electric field. It describes how electric fields and the dielectric media affect each other by polarizing in response to the field, which reduces the total electric field inside the material. Permittivity ε has units of Farads per meter (F·m-1 or A·V-1·S·m-1), and it directly affects the impedance and reflectivity.
Table 5.5 summarizes the concepts of conductivity, permeability, and permittivity in absolute units and free space values for use with relative permeability calculations. Tables of material properties generally show the relative permeability and permittivity referred to free space. When estimating the media effects on propagation, please remember that these equations apply only to shallow subsurface earth conditions at depths of less than 100 m, where the attenuation rises with frequency and wet materials have more attenuation than dry ones.
TABLE 5.4
Some Typical Dielectric Characteristics of Materials Measured at 100 MHz
5.5.3 Transmission-Media Characteristics and MPR Design
Having identified the media properties affecting MPR performance, we need to use this information to select the best signal spectrum for the purpose of use of the MPR system. The following sections present a simplified model of EM wave propagation in solid media. For simplicity, we neglect phase- and polarization-shifting effects.
TABLE 5.5
Material Characteristics Affecting Propagation
| Material Property | Describes | Absolute Units | Free space values |
| Conductivity (σ) | The flow of current between potential levels from Ohm’s law | S·m-1 = A·V-1·m-1 | |
| Permeability (μ) | The degree of magnetization that linearly responds to an applied magnetic field | H·m-1 = V·A-1·S·m-1 | μ0 = 4π × 10-7V·A-1·S·m−1 |
| Permittivity (ε) | How the electric field and dielectric medium affect each other. Indicates the ability of a material to polarize in response to the field and reduce the total electric field inside the materials | F·m-1 = A·V-1·S·m-1 | ε0 = 8.8542 × 10⁻¹² A.V-1·S·m-1 |
Source: Daniels, D.J., Ground Penetrating Radar, 2nd ed., Institute of Engineering and Technology, London, UK, 2004; Jol, H.M. (ed.), Ground Penetrating Radar Theory and Applications, Elsevier, Amsterdam, the Netherlands, 2009; Olhoeft, G.R., Ground penetrating radar. Application of ground penetrating radar. In Proceedings of the 6th International Conference on Ground Penetrating Radar, GPR’96, September 30-October 3, 1996, Sendai, Japan, pp. 1–4
5.5.3.1 Selection of Frequency Ranges for Solid Media
Any dielectric media has two types of wave velocity and attenuation characteristics: frequency-dependent diffusion dispersive at low frequencies and nondispersive at high frequencies. MPR systems work best in nondispersive region where the wave velocity and attenuation in the media remain constant at all frequencies. The wave velocity v, attenuation σ, and EM impedance Z determine the potential range performance limits of MPR systems. This section shows how to find the best frequency spectrum for sensing in a given uniform medium. You will find enough information to do preliminary design work and understand why an MPR uses a particular frequency range matched to the operating environment and application [2].
EM waves have uniform sinusoidal time variations for a simple media with fixed permittivity ε, conductivity σ, and permeability μ characteristics. Objects with different dielectric properties than the media will scatter the incident wave and reflect part of the energy back to the receiver. Figure 5.3 summarizes the principles of velocity and attenuation of signals in solid media.
Experience shows that a MPR will work best in the nondispersive region as shown in Figure 5.3c. In this region, all frequencies in a UWB signal will have the same velocity and attenuation, which keeps the composite waveform intact. Transmission at lower frequencies will distort the waveform by delaying the return at different frequencies and will distort the reflected signal. Selecting a frequency range without variable time delays that cause waveform distortions will produce better results. Fortunately, the diffusion dispersive regime falls in the kilohertz range and well below practical MPR GHz operating spectra.
5.5.3.2 Characteristics of Diffusion Dispersive Media
For the low-frequency diffusion dispersive region, we can model the wave velocity υd as
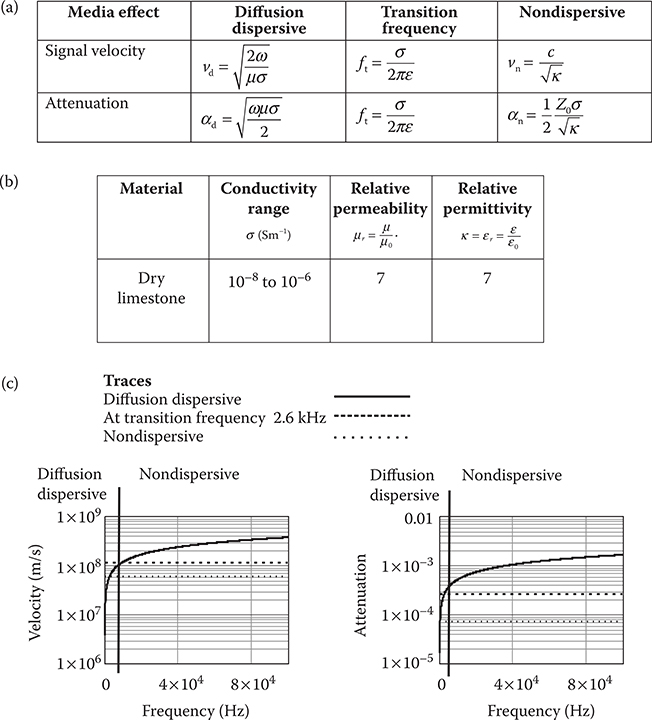
FIGURE 5.3
Velocity and attenuation of signals in solid media. (a) Table of velocity and attenuation models for the diffusion dispersive (low-frequency) and nondispersive (high-frequency) regions above the transition frequency. (b) Typical characteristics assumed for dry limestone measured at 100 MHz. (c) Plots of the velocity and attenuation show how the models change around the transition frequency of 2.6 kHz. The velocity and attenuation appear constant in the practical work in the high MPR (GHz) regime above transition frequency for most materials. (Based on Figure 1.5 in Jol, H.M. (ed.), Ground Penetrating Radar Theory and Applications, Elsevier, Amsterdam, 2009.)
and the attenuation αd as
Note that both these relationships vary directly as the square root of the frequency ω. Caution: For a given media material, a sufficiently high frequency will give a propagation velocity that exceeds the velocity of light in vacuum. Obviously the velocity and attenuation models of Equations 5.1 and 5.2 apply only below the transition frequency, where the model properly represents the conditions.

FIGURE 5.4
Transition frequency versus relative permittivity for values of conductivity from 1.0 to 0.00001.
5.5.3.3 Transition Frequency
The transition frequency, ft, indicates the lowest frequency at which all waves will travel at the same velocity and have the same attenuation in the medium. The propagation characteristics of media change from dispersive (frequency sensitive) to nondispersive above the transition frequency:
Thus, the transition frequency varies directly as conductivity (S·m-1) and inversely as permittivity ε. Table 5.4 shows how most soils have conductivity values of about 10-3 and relative permittivities ε0 less than 10, which keeps the range of transition frequencies below 10 kHz depending on the soil characteristics. Because most UWB systems will operate in the well above 500 MHz, the linearity of the media should present few problems. Figure 5.4 shows transition frequencies for different conductivities and relative permittivities.
5.5.3.4 Nondispersive Wave Transmission
For the nondispersive region, we can model the velocity υn as
and the nondispersive attenuation as
where κ = ε/ε0 or the relative permittivity. Note how these velocity and attenuation model terms do not depend on the frequency. Figure 5.3a and b summarizes the diffusion dispersive υd and nondispersive velocity and attenuation models. Your selection of a lower frequency limit should consider the highest expected transition frequency in the media to ensure linear propagation conditions. Figure 5.5 shows how the wave velocity for a signal above the transition frequency varies with permittivity and permeability. Figure 5.6 shows how the nondispersive attenuation varies for different values of conductance [2].
In the nondispersive region above the transition frequency, the media impedance Z depends on the permeability and permittivity so that
where and index of refraction
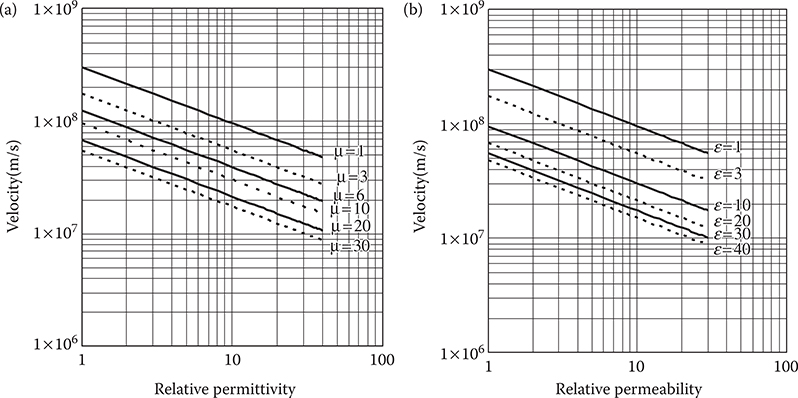
FIGURE 5.5
Velocity of propagation above the transition frequency in media versus (a) permittivity and (b) permeability. Increased relative permittivity and permeability result in lower EM wave velocities.

FIGURE 5.6
Media attenuation versus index of refraction for values of conductivity (σ) from 1.0-0.0001.
TABLE 5.6
GPR Frequencies Matched to Media

5.5.3.5 Practical Frequency Spectrum for MPRs
Table 5.4 of media properties and Figures 5.3 through 5.6 show how permittivity, permeability, and conductivity provide a theoretical basis for frequency selection. Table 5.6 from Geophysical Survey Systems, Inc. (GSSI, Inc.), a builder of GPR systems, provides practical guidance for frequency selection based on the type of target medium and user application [5]. Notice that the higher frequencies work best for concrete evaluation, while the lower ones work best for utility, environmental, and infrastructure surveys, which require deep penetration into soil-type media. The first listing called Domestic GPR refers to systems built for unlicensed operation in the United States with the government-mandated spectrum and power limits discussed in Chapter 4. The entries under “International” given in the table refer to GSSI systems built for export to countries with different restrictions on GPR power and spectra.
5.6 MPR Imaging
Modern GPR systems can give the user a near real-time picture of the conditions under the antenna. Figures 5.7 through 5.9 show typical GPR display examples indicating the physical range and spatial resolutions in different applications. Multiple antenna systems and sophisticated signal processing can produce through-wall 3D imagery to aid military, police, and emergency responders. Figure 5.10 shows an example of the Camero Tech Xaver™ 800 through-wall radar imagery. Chapter 14 discusses the design of the Xaver™ series radars and signal processing.

FIGURE 5.7
Examples of structural imaging radar data showing inspection of a hotel floor for steel reinforcing mesh set in concrete. (Used with permission from GSSI, Inc., Hudson, NH, © 2010 GSSI.)
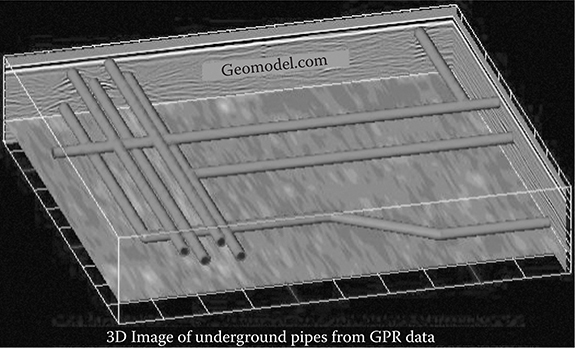
FIGURE 5.8
Processing many GPR field observations with precise spatial data can produce a 3D map showing underground pipes. Depending on soil conditions, the imaging can extend to 10-15 m in sandy or silty soil. (Used with permission from GeoModel, Inc., Leesburg, VA, www.GeoModel.com, © 2010 GeoModel Inc.)
FIGURE 5.9
Military applications of GPR include detection of landmines and unexploded ordnance (UXO). Shown here are landmines buried at 26-cm depth and detected by the step frequency GeoScope GPR manufactured by 3D-Radar, a Curtiss Wright Company. (Used with permission from 3-D Radar, Norway, © 2010 3-D Radar.)

FIGURE 5.10
The Camero, Inc. Xaver™ 800 through-wall radar system shows the capabilities possible by using multiple antennas and sophisticated signal processing. The radar can distinguish between fixed and moving (living) targets to provide a 3D display as shown here. The system can also give a time versus range record of targets to predict behavior. (Courtesy of Camero, Inc., Vienna, VA, © 2010.)
5.7 Conclusions
Successful MPR design requires an understanding of how EM waves propagate in media other than air. Understanding the media characteristics can help select a frequency that has linear propagation characteristics with respect to wave-front velocity. A uniform velocity helps to assure that the return time delay will properly indicate the distance of the target and not distort the waveform. Fortunately, nonlinear characteristics occur below 10 kHz, and practical MPR systems operate in the 0.5-10 GHz range.
Object detection will depend on the contrast of the object and surrounding media, that is, difference between the EM characteristics of the target and surrounding media. Specialized MPR for patient monitoring and detection of internal injuries will soon appear in the commercial market [10,11]. Applications such as medical imaging for tumor detection and diagnosis will require stringent testing before certification for clinical use. Chapter 9 discusses MPR biomedical applications and human-tissue characteristics. MPR systems have evolved over the past 20 years and will remain a principal area for future development. Researchers still have plenty of possibilities to explore in theory and practical experiments.
References
1. Daniels, D.J. Ground Penetrating Radar, 2nd edition, Institute of Engineering and Technology, London, UK, 2004.
2. Jol, H.M. (ed.) Ground Penetrating Radar Theory and Applications, Elsevier, Amsterdam, the Netherlands, 2009.
3. Olhoeft, G.R. Ground penetrating radar. Application of Ground Penetrating Radar. In Proceedings of the 6th International Conference on Ground Penetrating Radar, GPR’96, September 30-October 3, 1996, Sendai, Japan, pp. 1-4.
4. Geophysical Survey Systems, Inc. Online: http://www.geophysical.com/antennas.htm (accessed on December 5, 2010), 2008.
5. Geophysical Survey Systems, Inc. GSSI_SIR-3000 Brochure.pdf, Geophysical Survey Systems, Inc., Hudson NH, 2007.
6. GeoModel, Inc. Ground penetrating radar surveys, GeoModel, Inc., Leesburg, VA. Online: http://www.geomodel.com (accessed on October 12, 2010), 2009.
7. Êcole Polytechnique Federal de Lausanne. DeTeC Demining Technology Center, Online: http://diwww.epfl.ch/lami/detec/gprmaker.html (accessed on December 15, 2010).
8. 3D-Radar. GeoScope™ 3-dimensional GPR—The fastest step-frequency GPR on the market, 3D-Radar, Norway. Online: www.3d-radar.com/geoscope (accessed on December 12, 2010).
9. Camero USA Corp. Xaver™ 800 through wall vision, Camero USA Corp., Vienna, VA. Online: http://www.camero-tech.com (accessed on November 30, 2010).
10. Sensiotec, Inc. Sensiotec announces FDA 510(k) class II clearance for the world’s first UWB healthcare unbound, wireless, non-contact, vital signs and movement monitor, Sensiotec, Inc., Atlanta, GA, November 2009. Online: http://www.sensiotec.com/news/pressreleases/021109. php (accessed on January 15, 2011).
11. ElectroSonics Medical, Inc. Pneumothorax white paper, ElectroSonics Medical, Inc., Cleveland, OH, June 2007.