
12
Principles and Methods of Material-Penetrating UWB Radar Imagery
Anatoliy Boryssenko and Elen Boryssenko
CONTENTS
12.2 Operation and Design Principles
12.2.1 Classification Based on Material Operational Environment
12.2.2 Major Performance Measures of Material-Penetrating Radar
12.2.3 System-Level Design Constraints and Trade-Offs
12.3 Implementation Methodology
12.3.1 Methods to Support Broadband Operation
12.3.2 Measurement of Radar Target Features
12.3.3 Antenna Operational Conditions
12.4.1 Signal Processing Techniques
12.4.2 Radar Image Display Techniques
12.5.1 UWB SAR with Antennas Operating in Far-Field Conditions
12.5.2 Forward-Looking UWB SAR for Detecting Objects in Vegetation
12.5.3 Side-Looking UWB SAR for Landmine Detection
12.6 Inverse SAR Imaging Schemes
12.6.1 Tracking Moving Targets with Through-the-Wall ISAR Technology
12.6.2 ISAR for High-Resolution Imaging of Rotary Moving Targets
12.7 Imaging with Limited-Size Physical Apertures
12.8 Medical UWB Radar Interferometric Imaging
12.1 Introduction
Over the last two decades a broad range of science, engineering, and related disciplines have used the penetration properties of electromagnetic waves to probe optically nontransparent material media. In recent years, the progress in electromagnetic sciences along with the revolution in microelectronics and computers brought significant sophistication in material-penetrating radar imagery. Many such advances use ultrawideband (UWB) radar technologies that gain in spatial resolution and depth of penetration into many natural and artificial materials. This chapter presents the key operational principles and design concepts of material-penetrating UWB radar methods and imaging. We place special emphasis upon system-level analysis and implementation issues for the major radar building blocks and imaging techniques with synthetic and physical apertures. The results of several real-world projects illustrate the principles. Most examples come from the authors’ personal practice. The authors sincerely acknowledge the materials—including some materials that are not yet published—provided kindly by their collaborators, sponsors, and colleagues. The authors also thank the IEEE, Springer, and Federal Railroad Administration for granting reprint permissions.
12.2 Operation and Design Principles
12.2.1 Classification Based on Material Operational Environment
Classification seems a rational step to start dealing with the vast nomenclature of material-penetrating imaging radar systems. Analyzing the reported operational conditions and implementation concepts leads to the conclusion that material media related to specific application needs to define the major system-level features for different classes of material-penetrating radar systems. The following reasons support this observation. First of all, traditional radar systems operate in air and the far-field range of their antennas [1–4]. Second, the material-penetrating radar functions in the near field and through a material environment that frequently affects the radar antennas. As a result, the background physics imposes a number of specific design constraints and performance limitations related to dielectric properties of material media to be probed with electromagnetic waves [5].
From a monochromatic perspective, the material properties are quantified by macroscopic relative dielectric permittivity ε(ω) and electrical conductivity σ(ω) in S/m, in which both depend on the radial frequency ω = 2πΡ, where F is the regular operational frequency [6–8]. Magnetic properties are typically insufficient for most materials considered as nonmagnetic. To make a better description, the relative permittivity and conductivity parameters are often aggregated to define material loss tangent used to characterize propagation attenuation:
and material refraction factor used to characterize wavelength contraction in matter
where ε0 is the electrical constant of 8.8542 × 10⁻¹² F/m.
We can introduce material-penetrating radar imaging by considering the most evolved branch of these technologies, namely the ground-penetrating radar (GPR) that has many engineering, exploration, and environmental applications [5–8]. Typical GPR measurements use a bistatic pair of transmitting and receiving antennas as shown in Figure 12.1a. The system packages them in a rugged case that can slide on the surface as shown in Figure 12.1b and c. The radar antennas have a fixed distance one from another (common-offset) and move uniformly to form a synthetic aperture radar (SAR) scheme. The radar motion typically runs along a straight survey line close to the air-material boundary. Often the antenna geometry can be treated as quasi-monostatic if the distance between the transmitting and receiving antennas is negligibly small compared with the length of SAR tracks. Typical results of GPR surveys are illustrated in Figure 12.2 that represents the 2D underground reflectivity maps or radargrams of illuminated underground scenes. Proper interpretation helps to detect buried objects and evaluate their features. Probing other materials may require substantial changes in the design of the radar hardware/software components and system configurations. Such practical examples include radars for penetration in foliage (FOPEN) [9] and vegetation [10], land mine detection [1115], through-the-wall vision [16–20], biomedical sensing and imaging [21–25], and others.
Besides the connections to classical radar technologies mentioned earlier, subsurface radar imagery borrows many useful ideas from seismology and seismic signal processing [26]. In fact, radargrams and seismograms have many common external features observed at different space-time scales. Also, some aperture synthesis and array signal processing methods were first developed for ultrasound sensors and medical sonography [27] and then adopted for subsurface radar [20]. Interferometric aperture synthesis and imaging developed in radio astronomy [28] may also bring some practical ideas to in-matter radar-based imagery.

FIGURE 12.1
GPR illustrations: (a) The geometric configuration of GPR operational principle with major signal components shown for common-offset bistatic pair of transmit (Tx) and receive (Rx) antennas moved along the air-material interface to synthesize a large aperture. (b) An experimental GPR system assembled in a rugged case with laptop computer. (c) GPR case interior showing the major modules. (Courtesy of Ratio Inc., Kyiv, Ukraine.)

FIGURE 12.2
2D GPR cross-sectional images, namely radargrams, captured in two electromagnetic bands with different penetration depth: (a) Deep survey at the middle frequency 60 MHz to map soil stratification and locate the water table, Kyiv, Ukraine. (b) Shallow scan at the middle frequency 900 MHz to locate archeological artifacts such as the XI century graves, Kyiv, Ukraine. The white-bordered box shows some additional details of the image interpretation based on the excavation results. (Courtesy Diascarb, Kyiv, Ukraine.)
12.2.2 Major Performance Measures of Material-Penetrating Radar
The major system-level performance merits important for both in-air and subsurface radar imaging include (1) operating range and (2) resolution in range and cross-range (lateral) coordinates. The operational range or penetration depth is defined by the canonical radar equation that dictates foremost design choices on radar hardware components and system architectures [1,2]. For material-penetrating radar, the main practical design consideration is material attenuation, which is a term of the radar equation and can be expressed in an unbounded dielectric material as [5–8]
where c is free-space speed of light. The radar range resolution is another fundamental feature of the imaging system that is attributed to media properties and operational bandwidth [8]. Radar range resolution is defined as [5,7]
where τ = 1/B = 1/(Fmax − Fmin), which relates the pulse width related to the signal bandwidth B that spans (Fmax − Fmin). The factor 2 in the denominator of Equation 12.4 accounts for the roundtrip travel time between the target and radar. Hence, we require a large bandwidth for subsurface radar imaging to acquire small-sized target details. Cross-range (angular) resolution is related to overall imaging apertures and material properties [8]. In transversal SAR scanning shown in Figure 12.1, the resulting material-penetrating radar angular resolution depends on the relative imaging aperture dimension as follows:
where Ls is the overall aperture extent and λm is the wavelength for the middle operational frequency, (Fmax + Fmin)/2. Note that material losses narrow the antenna beamwidth and reduce the SAR efficiency for material-penetrating radar [5,7]. Table 12.1 lists some typical operation frequency bands and media electrical properties of material-penetrating radar from published data [5-7,29]. In addition, Table 12.2 exhibits the applications of some material-penetrating radar for several material media.
12.2.3 System-Level Design Constraints and Trade-Offs
The materials-penetrating radar designer must trade off and compromise a number of mutually conflicting system requirements. The physical properties of wave material penetration shown in Tables 12.1 and 12.2 primarily govern allocations of appropriate portions of the electromagnetic spectrum for material probing. However, other practical design considerations must consider the following:
TABLE 12.1
Typical Material-Penetrating Radar System Media, Operating Frequency Bands, and Electrical Properties

TABLE 12.2
Some Application-Related Features of Material-Penetrating Imaging Radar Systems
| Materials | Typical Applications | Frequency Spectrum | Range | Resolution |
| Inorganic Natural: Soil, rock, fresh water, snow/ice | Geophysical surveying, environment, archeology, utility inspection, defense/law enforcement | 50–500 MHz | 1–20 m deep | 0.1–1.0 m |
| Inorganic Artificial: Concrete, mortar, asphalt, pavement railroad tracks, and roadbeds | Civil engineering, nondestructive evaluation, transport infrastructure, historical heritage | 0.5–2 GHz | 0.1–2 m deep | 1–10 cm |
| Organic Vegetable: Wood and foliage vegetation | Landmine detection, biomass monitoring, defense/law enforcement | 0.3–3 GHz | 0.1–1 m deep >1 km in range | 1–100 cm |
| Organic Animal: Animals and human body | Physiological studies, medical imaging, material spectroscopy | >1 GHz | 1–30 cm deep | 5–10 mm |
Government regulations on the use of electromagnetic spectrum [30]
Electromagnetic compatibility in the context of particular operational conditions [31]
Performance, availability, and cost of major electronic and computer components
System performance objectives with respect to the electrical characteristics of the media
Their comprehensive detailed treatment falls beyond the scope of this study; however, we can generalize by examining the four major design factors and governing trends illustrated in Figure 12.3. Specifically, the parameter W represents the middle operational wavelength that defines the physical dimension of radar antennas [32] and the achievable resolution defined in Equation 12.4. The penetration range (depth) indicated by the curve R falls as energy dissipates in material media as described in Equation 12.5. The energy dissipation trend reflected by the curve ℓ is quite similar for most inorganic and organic or natural and artificial materials being caused by absorption of electromagnetic waves in the water that grows toward the region of the water relaxation band above 10 GHz [5,7]. Finally, the economic issues such as cost featured by the curve C restrict the scope of potential design solutions. Obviously, the radar microwave hardware and image processing software become unavoidably more complex and more expensive for higher frequencies and wider bandwidth. The designer must find a number of technical and economic compromises to satisfy many mutually conflicting requirements to some satisfactory degree.
12.3 Implementation Methodology
Several design options exist for major radar hardware building blocks, imaging algorithms, and their configurations into an imaging system. At the same time, the properties of radar antennas operating under the impact of material media impose most of the system-level design constraints [6,8]. In addition, most of the antennas used in material-penetrating radar have relatively wide and low-gain beams, which produce the poor cross-range (angular) resolution tolerated by SAR and other data collection strategies studied in Sections 12.5 through 12.8. Section 12.4 mainly discusses the techniques for image formation in the rightmost column of Table 12.3. You can find other design opportunities for particular application needs beyond those in Table 12.3.

FIGURE 12.3
Qualitative assessment of major design trade-offs: W—operational wavelength that defines antenna dimensions and radar cross-range resolution; R—operational range of signal penetration; L—energy loss caused by dissipation in materials; C—component and implementation cost. A radar operational band Fmin...Fmax with the middle frequency F0 = (Fmin + Fmax)/2 is allocated as an example that affects range resolution.
TABLE 12.3
Summary of Imaging Radar Implementation Techniques
| Signal Modulation | Measured Features | Antenna Operational Range | Aperture Implementations | Imaging Schemes |
| Time domain | Reflection | Near field with materialcoupled antennas | Synthetic, inverse synthetic, physical (antenna array) | 1D (range) |
| Frequency domain | Transmission | 2D (depth vs. range) | ||
| Pseudonoise and noise | Combined reflection and transmission | Intermediate field with stand-off antennas | 2D (range vs. cross-range) | |
| OFDM | Polarization | Far field | 3D tomography |
12.3.1 Methods to Support Broadband Operation
Equation 12.4 shows that we need large signal bandwidths to provide high-resolution imaging. Table 12.3 shows some practical ways to achieve large bandwidths. Two of the mostly used high-resolution techniques operate purely in the time or frequency domain. Although mathematically equivalent, these methods have different hardware implementation principles and constraints [1,8,31].
Time-domain or pulsed radar measures the bipolar amplitude of the scattered field versus flight time after excitation as shown in Figure 12.4a. Time-domain designs commonly use stroboscopic down conversion followed by a low-rate analog-to-digital conversion (ADC) to minimize the component cost and processing power at the expense of very low energy efficiency [5]. For instance, you can build a simple UWB laboratory radar system with a commercial digital oscilloscope and pulse generator [18].
Frequency-domain systems use frequency stepping or Fourier synthesized signaling. At each frequency step, these measure the complex reflection coefficient and transform the data acquired across the whole sweep band through fast Fourier transform (FFT) to synthesize equivalent pulses as shown in Figure 12.4b. For example, you can build a laboratory UWB radar frequency stepping imaging prototype with a vector network analyzer (VNA) [32].
Other less common bandwidth expansion methods include pulse-compression [5,8,32], noise signals [1,2], pseudo-noise sequences [33], orthogonal frequency-division multiplexing (OFDM) [34], and others. Historically, the majority of reported material-penetrating radar systems use time-domain implementations because of their relative simplicity and lower cost. However, operation in the frequency domain provides wider system dynamical range, higher mean power for transmitter, and lower noise for receivers [5,7]. Most of the reported material-penetrating radar systems operate with bandwidths that exceed 20%−50% of the center frequency [1].
Figure 12.5 shows a typical pulsed response signal of a time-domain GPR system with its time-domain waveform and spectrum. Specifically, this signal indicates the direct coupling component in the early time and several reflections including the most prominent one observed around the 20-ns time-of-flight mark.
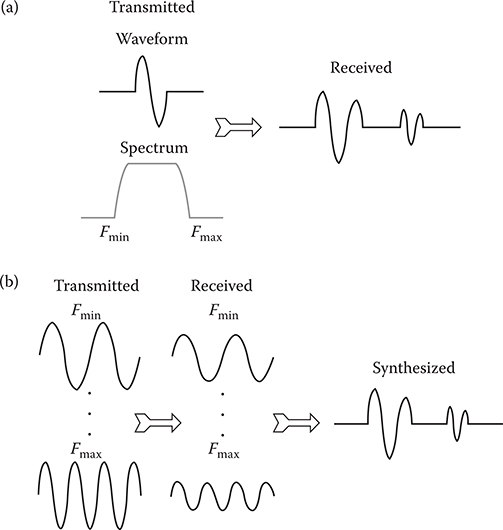
FIGURE 12.4
The two major methods used to generate broadband target illumination: (a) Time domain with pulsed signals. (b) Frequency domain with frequency stepping followed by pulse synthesis.
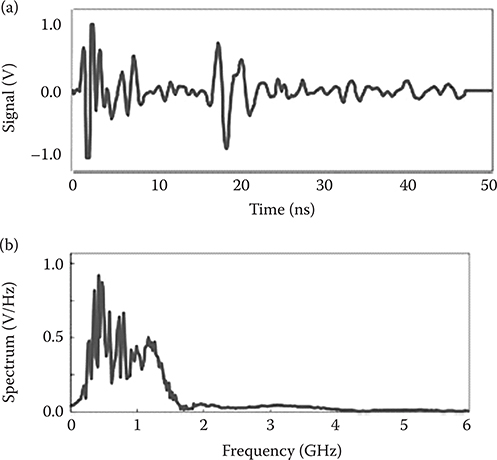
FIGURE 12.5
Typical normalized UWB return signals: (a) Time-domain waveform. (b) Frequency-domain spectrum. (Courtesy of A&E Partnership, Belchertown, MA.)
12.3.2 Measurement of Radar Target Features
Subsurface radar measures the reflection or transmission (translucency) medium contrast for electrical and material properties such as the examples in Tables 12.1 and 12.2. The intensity of measured contrast depends on (1) the difference of the material refraction factors of Equation 12.2 for a buried object and ambient environment; (2) the degree of attenuation losses shown in Equations 12.1 and 12.3; and (3) the object’s geometrical dimensions with respect to the center operational wavelength. All these factors together define observable radar cross-section (RCS) for targets measured in UWB regimes [1,37]. In practice, the detection of many subsurface targets such as landmines depends not only on the target RCS characteristics but also on the presence of clutter materials and other unwanted reflections that can conceal the target response [7]. Often surface scattering from air-material interfaces can be treated as a clutter. Exploiting differences in polarization-dependent scattering of targets and clutters helps to improve target visibility contrast [1,2,7].
12.3.3 Antenna Operational Conditions
We recognize that antennas represent the most critical components of radar imaging systems [5,7]. Often all measurements and image quality depends largely on the antenna features, whereas, standard electronic and computer means carry out quite routine tasks as in the case of GPR systems. The antenna design chapters of this book present some general design techniques and ideas for UWB antennas. In the context of this study, radar antenna positioning with respect to the material boundary has the most important effect on the radar imaging system features [5]. Three such major cases involve
Medium-coupled antennas in close proximity to the material interfaces or even being laid on the air-material boundary as shown in Figures 12.1b and c and 12.6.
Down-looking antenna elevated above the air-material boundary with certain signal propagation path in air as shown in Figure 12.7.
Side- or forward-looking antenna operated essentially in the far field with the dominant signal propagation in the air as shown in Figure 12.8.
The material-coupled antennas shown in Figure 12.6 have better energy transfer to the material media and capture backscattered returns when compared with the other antennas shown in Figures 12.7 and 12.8. However, the variable properties of the electrical media directly affect the performance of such antennas [8]. This effect might be useful for some applications, for example, moisture sensing but in general causes highly undesirable antenna mismatching and sensitivity reduction. Unlike these cases, the antenna in Figure 12.8 operates in most stable regime without media impact and related performance degradation. Actual antenna physical behavior on material interfaces is very complex for ordinary interpretations [36]. Hence, rigorous full-wave electromagnetic numerical analysis is often utilized to assess this matter [37]. Theoretically, the medium-coupled antennas could be tuned to mitigate the media impact, but this is not yet reported for field operational conditions.

FIGURE 12.6
Example media-coupled antennas: (a) Through-the-wall motion detector with a 1 GHz middle frequency (With kind permission from Springer Science + Business Media: Ultra-Wideband Short-Pulse Electromagnetics 8, Portable imaging UWB radar system with two element receiving array, 2007, 153-160, A. Boryssenko, D. Sostanovsky, and E. Boryssenko.) and (b) The TerraVision multichannel GPR system antenna. (Courtesy of Underground Imaging Technologies [www.uit-systems.com].)

FIGURE 12.7
Stand-off multiantenna GPR configuration for railroad inspection inside and outside the track. (Courtesy of Federal Railroad Administration, Washington, D.C.)
FIGURE 12.8
Vehicle-mounted transmit-receiver antenna pair operating in far field for spotlight SAR landmine detection alongside the vehicle route. (Courtesy of Dr. Patrick W. Johnson.)
12.4 Radar Imaging Methods
By its operational principle, material-penetrating radar illuminates optically obscured materials and collects backward- and forward-scattered returns modulated by electrically contrasted and spatially resolvable internal objects and heterogeneities. The radar returns first need processing by the systematic application of physical principles and special signal processing techniques. We can then render the processed radar returns to synthesize a subsurface image. A radar image results from the mathematical actions on radar returns, which convert them into a suitable graphical form for visual display [4]. Finally, the operator must interpret the image to determine as much as possible about the interior material structure including distinguishing between objects of interest and clutter.
12.4.1 Signal Processing Techniques
Radar signal processing has many physical constraints. UWB signals undergo a chain of complex shape/spectral transformations as partially illustrated in Figure 12.5. Technical limitations in the radar hardware introduce more signal processing complications [5−8]. For these reasons, the radar returns require processing to
Remove unwanted signal components and interferences.
Compensate for hardware distortions and imperfections.
Extract application-specific targeted information.
In practice, many 1D and 2D material-penetrating radar systems use signal processing techniques including the four major deterministic signal processing routines described below.
Filtration of radar returns uses 1D or 2D filters in time/frequency and/or spatial/spectral domains to remove unwanted signal components, which appear beyond a specified frequency band (frequency-domain filter), time interval (time gating), beam span (F−K filtrations), and so on. For instance, a generic filtering operation in time domain has the operator equation [38]:
where and Sj(t) respectively represent the unprocessed and processed ith radar returns, W(t) represents the filter impulse response, and the operator * stands for convolution. In Equation 12.6, the digital filter acts within a sliding window, which spans across 2M + 1 successive radar returns. For example, the case M = 0 implements a “vertical” 1D filter, and so on [5,7].
Image focusing, in a geometrical sense, places scatterers in their true positions in radar images by applying a beamformer in spatial or spectral domain through a coherent summation of a number of individual radar returns [35]. Such algorithms involve time reverse, Kirchhoff, FK and other migration algorithms [5,7], delay-and-sum, or confocal beam forming [22]. For example, assume that the x coordinate specifies an SAR track and the depth is measured by the y coordinate when the air-material boundary is located at y = 0. Then, time reverse range migration can be summarized by the following expression for the brightness of the image pixel associated with the xi,yk spatial point:
where aj is a weight used to taper the beam and v = c/n shows the signal propagation velocity referred to the material refractivity n from Equation 12.2. In practical scenarios, we only have approximate values for the material properties, which can also vary with depth. The related errors defocus and blur radar images. Measuring and applying an additional depth profile could aid the image processing [5,7]. Note that in a mathematical sense Equation 12.7 only gives an approximation. Different linear and nonlinear inverse techniques may solve the problem exactly, but they have demanding algorithm complexity, impose high-computational costs, and have an ill-posed nature [24,27,39].
Background removing compensates for unwanted scattering of the signal components caused by the background. It is often performed by subtracting invariant background responses computed by averaging a number of radar returns within a sliding window as formalized below:
In fact, background removing is a sort of moving target indication technique used to discriminate between scattered signals caused by a target in motion and stationary background [2].
Range correction compensates for signal decay versus the depth (range) or flight time caused by energy dissipation due to material losses and spherical energy divergence because of wave propagation [5,7]. This compensation, for example, can be accomplished by using time-varying gain function G(t) applied to the signal waveform versus flight time as follows:
Along with the above-indicated deterministic signal processing methods, statistical methods and other sophisticated techniques are used to enhance image resolution and quality [13,15,41].
Solely for illustrative purposes, Figure 12.9 demonstrates the impact of signal processing on noninvasive inspection of railroad track structural integrity. Figure 12.9 shows how the signals with strong multiple reflections bounced between the antenna aperture, and the cross ties made of reinforced concrete obscure the raw data. The ties themselves appear as multiple interfering hyperbolic patterns in the unprocessed data that additionally conceal the returns from the subsurface areas of interest. The image in Figure 12.9 shows the effects of removing unwanted scattered signals generated by the surface and ties, gain-corrected. Further processing focuses the image to reveal the target features such as the position in depth of the ballast-embankment boundary and all structural stratifications within the ballast and beneath [46].

FIGURE 12.9
Signal processing of GPR registered data for railroad integrity inspection where the left part of the radar image is processed while its right portion is intentionally left unprocessed. (Courtesy of A&E Partnership, Belchertown, MA.)
12.4.2 Radar Image Display Techniques
To create a radar image, we must map the subsurface reflections into a visually perceptible format. Figure 12.10 shows a simple imaging technique borrowed from seismology that renders the signal polar magnitudes in a gray scale. We can apply this to several individual radar returns called A-scans (as shown in Figure 12.5a), and by placing them vertically beside each other. The resulting B-scan image plots the reflection map as a function of position along the cross-range (horizontal axis) and depth (vertical axis) [5,7]. Sections 12.5 through 12.8 discuss other 2D imaging techniques. Besides just 2D imaging, we can form a 3D radar vision by combining individual slices of 2D B-scan images formed for a number of parallel passes made across the survey area [7]. The derived 3D reflectivity map might indicate to the subsurface areas of most strong reflections caused by the buried objects to be detected. Providing GPS coordinate references to such measurements leads to geometrically reliable images. Figure 12.11 shows the case of subsurface utility mapping with a multichannel GPS-guided GPR system (shown in Figure 12.6b), which accurately reveals the complex system of subsurface metal and ceramic pipes and other underground objects.
12.4.3 Image Interpretation
A radar image analysis and follow-up interpretation can extract [5,7] the following:
Structural features that serve many practical purposes, for example, monitoring structural integrity of buildings (Figure 12.10), railroad tracks (Figure 12.9), geological formations (Figure. 12.2a), and others.
Coordinate and geometrical features for buried objects including those required for depth and shape reconstruction (Figure 12.10).
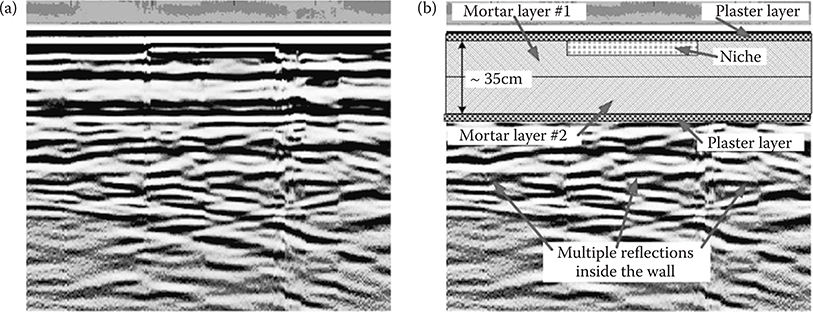
FIGURE 12.10
A 2D cross-sectional SAR image of wall interior measured by the pulsed radar (Figure 12.6a) at the center frequency 2 GHz: (a) B-scan image rendered from 250 individual radar returns. (b) Some interpretation shows the two-layer mortar wall with a plaster on both faces and a hidden niche. (Courtesy of Diascarb, Kyiv, Ukraine.)

FIGURE 12.11
3D image formed by parallel passes made across the survey area by using the multichannel GPR system (Figure 12.5b) to map underground utilities. (Courtesy of Underground Imaging Technologies [www.uit-systems.com].)
Material content of the media and their electrically contrasting inclusions used in dielectric spectroscopy [24] and medical diagnosis including cancer detection [22,23].
To interpret subsurface radar images, the operator must understand the phenomenology that governs the physical mechanisms responsible for forming reflectivity/translucency return signal patterns. Performing intuitive wave-based interpretations for radar probing in inhomogeneous materials from a wave point of view presents difficulties. Instead, we can make full-wave numerical simulations that use forward and backward modeling in attempts to rigorously assess signal propagation and scattering. This helps to improve imaging performance [36,37] along with other methods of digital image processing [42,43].
12.5 SAR Imaging Scheme
As previously discussed, resolution of radar imaging systems depends greatly on the antenna performance. SAR imaging uses a small-aperture antenna moved along a track (as shown in Figure 12.1a) to form a larger aperture and get better resolution [1,2,5,7]. Figures 12.2, 12.9, and 12.10 show some typical subsurface SAR images.
This section describes a new strip-map UWB SAR imaging technique, employed to detect small-sized and hidden objects covered by vegetation or shallowly buried in soil. We describe two such real-world R&D developments with vehicle-mounted UWB radar sets [10,13].
12.5.1 UWB SAR with Antennas Operating in Far-Field Conditions
Traditional subsurface SAR imaging operates with down-looking antennas, which normally point to the material boundary that might be close to the aperture as shown in Figure 12.12a. For the strip-map SAR image formation, the radar antennas operate in the far field while pointed at a grazing angle toward the area of radar survey. The antenna beam field spans the survey area as shown in Figure 12.12b. The grazing beam mode minimizes background scattering and excludes multiple reflections compared to the down-looking antennas. The antenna footprints pictured in Figure 12.12 have different curves of constant flight time. This difference makes possible to track targets in the case of Figure 12.12b by using a radar sensor on a moving platform. For forward-looking operation, the system has two possible patterns of the target traces that depend on the target position with respect to the direction of the forward advance of the vehicle. The radar optical axis usually coincides with the vehicle velocity vector as shown in Figure 12.13. If the vehicle uniformly approaches an obstacle lying exactly on the radar optical axis, the target signature appears as a straight inclined line as shown in Figure 12.13a. For a target located off the radar optical axis, a visible curvature appears more and more while the radar progresses closer and closer to the target as shown in Figure 12.13b. Therefore, assuming flat-scene topography, the system can determine the target position of the plane coordinates by processing the flight time along the radar optical axis and the curvature of target traces. We can treat alongside target tracking with side-looking antennas in the same way as discussed in Section 12.5.3.
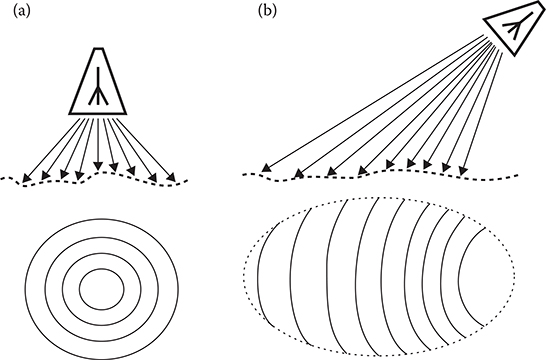
FIGURE 12.12
Antenna pointing to illuminate the scene of interest with lines of constant flight time: (a) Look angle normal to the surface. (b) Slanted at a grazing angle that minimizes backscattering and avoids multiple reflections. (Adapted from Boryssenko, A., “Impulse radar emergency system to prevent damage due to harmful objects in vegetation,” IEEE International Radar Conference, 116-121, © 2000 IEEE.)

FIGURE 12.13
Two possible target traces that depend on the target position with respect to the radar optical axis shown for five consecutive moments of time #1 . . . 5: (a) Target is on the radar optical axis. (b) Target is off the radar optical axis. (Adapted from Boryssenko, A., “Impulse radar emergency system to prevent damage due to harmful objects in vegetation,” IEEE International Radar Conference, 116-121, © 2000 IEEE.)
12.5.2 Forward-Looking UWB SAR for Detecting Objects in Vegetation
The section describes a forward-looking UWB SAR imaging system developed to protect combine harvesters, such as the one in Figure 12.14, from mechanical damage from surface rocks [10]. Rocks in many areas of the world were dispersed by glaciers during the last ice age. Freezing and thawing of the ground causes these rocks to continuously emerge from the ground and defy permanent clearing. These loose stones on the surface or those buried at shallow depths can seriously damage an expensive harvester containing a cutting blade that skims the surface. The standard procedure now requires the harvester operator to inspect the field visually and pick up all the rocks by hand while making stops. The operator’s multiple operational tasks, harvester motion and speed, low visibility in standing crops, and dust conditions make this task difficult and endanger an expensive piece of equipment.
To automate rock detection we built the UWB SAR mounted on an automobile shown in Figure 12.15. We tested this system on relatively flat terrain as shown in Figure 12.14 [10]. The prototype operates in the pulsed modes and uses a UWB impulse signal as shown in Figure 12.5. The radar look angle ranges from 30° to 60° and defines the survey areas covered by the antenna footprint. Several tests were conducted with a single rock or clusters of rocks spread over 20-30-cm high meadow grass (see Figure 12.15). A harvester operator moving at operational speeds of up to 10 km/h would have a difficult time seeing these hazards. Background scattering strongly affects the raw radar returns shown in Figure 12.16a. Using Equation 12.8 on the return data removes the background scattering because the background signal components vary at slower rates compared with the target scattering signal. Real-time computing removes the background clutter and gives the image shown in Figure 12.16b. Applying several algorithms of nonlinear signal processing, namely median filtration and statistical contrast enhancement, removes most of the clutters and gives the image in Figure 12.16c [35]. Coherent clutter suppression and integrating the target energy provides well-shaped traces for automatic tracking [35]. This UWB radar imaging concept can reliably detect small-sized vegetation-covered obstacles en-route and warn the operator at a safe range.

FIGURE 12.14
Combine harvesters need protection from rocks in grain fields. The operator cannot see and clear stones hidden by the standing crop. (Courtesy of Diascarb, Kyiv, Ukraine.)

FIGURE 12.15
This automobile-mounted forward-looking UWB SAR prototype successfully detected the rocks hidden in the meadow grass. (Adapted from Boryssenko, A., “Impulse radar emergency system to prevent damage due to harmful objects in vegetation,” IEEE International Radar Conference, 116-121, © 2000 IEEE.)
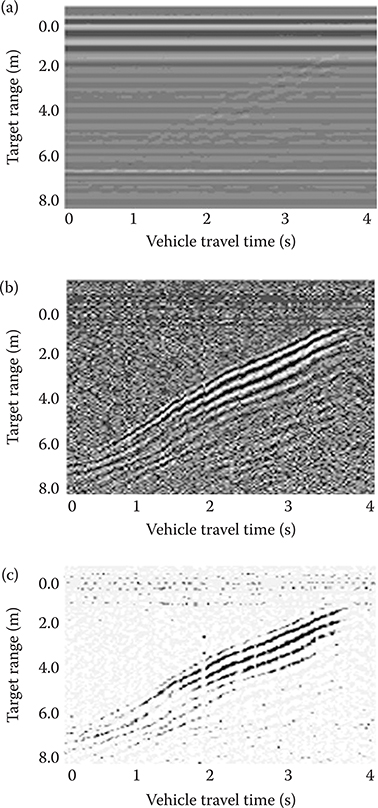
FIGURE 12.16
Radar SAR images acquired with the experimental prototype in Figure 12.15: (a) Raw unprocessed data. (b) Background scattering removed and gain corrected. (c) Median filtration and contrast enhancement applied. The target is located on the radar optical axis but its curvature has some modulation due to variable car speed. (Courtesy of Diascarb, Kyiv, Ukraine.)
12.5.3 Side-Looking UWB SAR for Landmine Detection
The detection of buried landmines, unexploded ordnance (UXO), and improvised explosive devices (IEDs) has important military and humanitarian applications [11–15]. UWB radar engineers must develop effective, noninvasive sensor technologies for reliable detection and safe neutralization of dangers. An Institute for Defense Analysis Report by Andrews, Ralston, and Tuley concluded that UWB radar imaging provides one such promising approach [11]. Most of the reported subsurface radar systems proposed to detect explosive ordnances use down-looking antennas, which require passing above the mine. Clearly, forward- or side-looking antennas represent more practical and safer alternatives. The experimental UWB SAR radar pictured in Figure 12.8 operates on the move to detect shallow off-route landmines [13]. This system exploits a similar principle of SAR target detection shown in Figure 12.13 with side-looking radar antennas. Figure 12.17 shows a typical antipersonnel landmine target along with its radar signature measured in a cluttered test environment. Figure 12.18 shows the results of mapping several antipersonnel landmines extracted from radar returns through a chain of signal processing steps [27]. The result clearly exhibits the operational capabilities of this landmine detection technique to map the location of off-route landmine targets. Because of the shallow positioning, this processing does not consider the target depth. In practice, clutter regions substantially complicate the process of radar landmine detection [12,16]. Advanced and intelligent signal processing strategies, including polarization that exploits difference in signatures, can filter out clutter to some degree through discrimination between target and clutter returns [15]. However, the clutter problem is far from being ultimately resolved in real-world field operational conditions of landmine detection [11].

FIGURE 12.17
A type TS-50 antipersonnel landmine: (a) physical appearance and (b) measured UWB radar signature. (Courtesy of Dr. Patrick W. Johnson.)
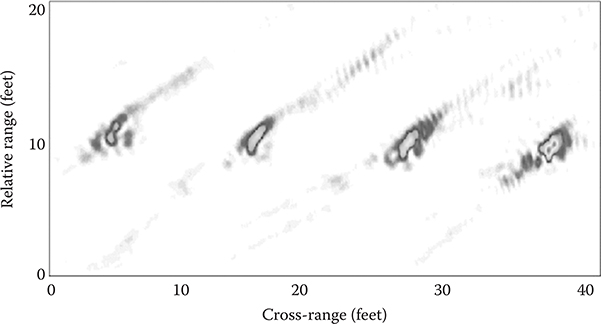
FIGURE 12.18
Results of UWB SAR imaging of four-focused landmines of the type shown in Figure 12.17 placed off-route. (Courtesy of Dr. Patrick W. Johnson.)
12.6 Inverse SAR Imaging Schemes
Inverse synthetic aperture radar (ISAR) imaging techniques can generate two-dimensional high-resolution images of a target that changes position with respect to the stationary radar antennas. This section discusses two types of target displacements including linear and rotary motions as shown in Figure 12.19. In either case, these two imaging schemes operate with mixed air-material propagation of UWB electromagnetic signals. This differs from traditional ISAR studies with an exclusively free-space operation [2–4].
12.6.1 Tracking Moving Targets with Through-the-Wall ISAR Technology
Law enforcement, military, rescue, and similar security agencies need non-line-of-sight surveillance systems. Researchers have used several different imaging technologies including UWB radar to sense through nonmetallic obstacles such as walls, doors, and similar building construction elements [16–20]. For most cases the operator wants to
Determine the room occupants and assets
Trace the moving inhabitants
Detect vital heart beat and respiratory signs
Discriminate between animals and humans
Recognize weapon
Map the room contents (tables, file cabinets, locations of doors, windows etc.)
Characterize the wall internal properties as illustrated in Figure 12.10 [41]

FIGURE 12.19
Target translational-rotational motion in front of the transmit-receive antenna units for ISAR imaging: (a) Linear target translation along a straight line. (b) Target rotation around a given axis.
The general objectives of through-the-wall surveillance requires solving complex inverse problems governed by wave propagation physics [27,39,44]. However, for some practical cases, the solution can be simplified and carried out in a computationally efficient manner, at the expense of losing some target features not needed for particular applications.
We can illustrate the ISAR capabilities with the results of motion detection from the system shown in Figure 12.6a. This system uses very precise ranging information to detect the presence of a person behind a wall. Applying the operational principle shown in Figure 12.20 produces the image shown in Figure 12.21. The most reflective area of the synthesized radar image in Figure 12.21 clearly indicates the person’s position behind the wall. Real-time signal processing applies the background removing methods of Equation 12.8 and a time-varying gain correction described in Equation 12.9. In addition, the radar shown in Figure 12.6a can sense vital signs such as the heart beat and respiratory chest motion of a stationary individual or disaster victim buried under debris [21]. Using larger arrays and incorporating the wall thickness, material composition, and electrical properties in a smart beam forming algorithm may substantially improve through-the-wall imaging capabilities [20].
12.6.2 ISAR for High-Resolution Imaging of Rotary Moving Targets
Another UWB ISAR system imaging method exploits the target rotary motion pictured in Figure 12.19b. Figure 12.22 shows the results of using a set of advanced UWB hardware, operating across the 0.8-22 GHz bandwidth to examine the contents of a suitcase [40]. The resulting radar image exhibits amazingly high quality with spatial resolution of less than 1 mm. This system used time-domain measurement to form the image. The signal processing takes target scattered signals registered from multiple observation points taken at angular step increments. This imaging technique requires careful calibration done with some reference scatterers such as a metal sphere with well-known analytical solutions for the scattered field. Applying computed calibration constants helps to reconstruct the images from the raw range and angle data.

FIGURE 12.20
The UWB radar through-wall ISAR motion detection and imaging principle. (With kind permission from Springer Science+Business Media: Ultra-Wideband Short-Pulse Electromagnetics 8, Portable imaging UWB radar system with two-element receiving array, 2007, 153-160, A. Boryssenko, D. Sostanovsky, and E. Boryssenko.)

FIGURE 12.21
Track image of a person behind the wall performed according to the measurement scheme in Figure 12.20 by using the through-wall radar vision system in Figure 12.6a. (With kind permission from Springer Science+Business Media: Ultra-Wideband Short-Pulse Electromagnetics 8, Portable imaging UWB radar system with two-element receiving array, 2007, 153-160, A. Boryssenko, D. Sostanovsky, and E. Boryssenko.)

FIGURE 12.22
High-resolution ISAR images. (a) Suitcase with a gun and bottle. (b) ISAR image obtained for the closed suitcase. (Courtesy of Dr. Boris Levitas.)
12.7 Imaging with Limited-Size Physical Apertures
Previous material-penetrating imaging radar systems exploit synthetic aperture techniques when either the radar or the target moves. We can use smaller physical apertures for cases with a stationary radar and target. However, to get high-resolution radar images requires a long scanning length for the SAR to simulate a narrow beam or a large number of antenna array elements to form a small beam. Size and cost considerations mean portable systems cannot use large physical aperture antennas.
We can explore some imaging opportunities using physical apertures with just a few array elements. Figure 12.23 shows an experimental short-range UWB radar imaging system. In this system, the antenna array has two receive antennas located at either sides of the pulse emitting antenna in the middle. These antennas use the same novel UWB antenna design concept [45,47]. The UWB radar operates in a pulsed mode across the 0.53.0 GHz equivalent band [17].
The test setup scene in Figure 12.24 has a 3-m range and covers ±50° in azimuth for the imaging experiment. The system images an aluminum cylinder 30-cm high with a diameter of 12 cm, vertically installed at 1.2-m range and -30° azimuth. Figure 12.25 shows the radar returns registered by both the receivers directly in time domain for this target arrangement. Manipulating the recorded signals to synthesize a reflectivity map produced the scene imaged in Figure 12.26. The computation forms a map made of individual “pixels” with their positions measured in range R and azimuth coordinate φ. Manipulating the received waveforms registered by both the left (L) and right (R) radar receivers determined the brightness of each pixel. In particular, the pixel brightness can be computed as their weighted and windowed cross-correlations as follows:

FIGURE 12.23
UWB radar imaging systems with one transmitter and two receivers: (a) The radar hardware set installed on a tripod. (b) Radome removed to show the antenna elements. (With kind permission from Springer Science+Business Media: Ultra-Wideband Short-Pulse Electromagnetics 8, Portable imaging UWB radar system with two-element receiving array, 2007, 153-160, A. Boryssenko, D. Sostanovsky, and E. Boryssenko.)

FIGURE 12.24
Experimental setup for imaging experiments with the radar and target isolated by an internal building wall made of two sheetrock panels. The target is an aluminum cylinder of height 30 cm and diameter 12 cm. (Courtesy of A&E Partnership, Belchertown, MA.)
where the time function W(t) spanned over ΔT gates the cross-correlation function. The radar returns are aligned to provide the equal fight time for two signal paths (D0 + D1)/c = (D0 + D2)/c for each pixel to which the image is focused accordingly the geometrical configuration in Figure 12.26. Examining Figure 12.26 shows that the derived image exhibits poor cross-range resolution because of a short baseline and a lack of azimuth observation diversity while range compression is quite acceptable. This is a typical outcome of small apertures because finer azimuth compression requires large-sized arrays to supply with additional target information from multiaspect observations [18,20]. In addition, some other techniques can be incorporated to partially overcome a lack of observational diversity by additionally considering intercorrelations with emitted pulses and other enhancements [35,45,48].

FIGURE 12.25
Received waveforms by both receivers for the test scene in Figure 12.24 with major target reflections appeared between 150 and 300 time bins.

FIGURE 12.26
Geometry and computed images derived with two-element receive antenna array for the scene with the target located at the 1.2-m range and -30° azimuth position. (Courtesy of A&E Partnership, Belchertown, MA.)
12.8 Medical UWB Radar Interferometric Imaging
UWB radar imaging could provide an alternative to computerized axial tomography and X-rays for biomedical imaging [16,37,45]. While breast cancer presents an obvious application, all physicians could use a diagnostic imaging technique that does not expose patients to ionizing radiation risks. UWB tomography may offer a solution by developing enough sensitivity to reliably produce images contrasting healthy and diseased tissue.
Breast imaging for cancer detection offers a potential experimental application because (1) breast tissues at microwave frequencies demonstrate highly translucent behavior compared with other body organs and tissues; (2) the breast provides an ideal external organ for microwave probing. Several approaches, such as (1) confocal imaging [22,25], (2) microwave tomography [23,24], and (3) microwave holography [27], exploit the above features. Nevertheless, despite some encouraging results shown in modeling studies, phantom experiments and clinical tests indicate several unresolved critical problems which include
The inherently limited resolution capability at microwave frequencies (see Table 12.1).
The severe air-skin scattering caused by immersing the breast and the radar antenna in a coupling fluid.
The complexity of decoupling signals registered by densely packed arrays of microwave probes.
The difficulties of isolating probing and returning signals registered at very short operational ranges where time windowing does not work.
• The losses in sensitivity and dynamical range caused by antenna mismatch and other factors.
Lack of reliable data regarding the difference of electrical characteristics between healthy and disease tissue.
These factors create major challenges for microwave breast imaging compared with other material-penetrating radar imaging scenarios described in the previous sections.
To these problems, we propose a solution that uses the operational concept in Figure 12.27. Figure 12.28 shows an inward-looking UWB antenna array housed in a metal chamber, which isolates the array from the environment [22]. Several identical linear PCB subarrays are employed such as tapered-slot-antennas (TSAs) operating across 5-15 GHz. The array operates in a multiple input, multiple output (MIMO) mode designed to collect backward and forward scattered radar. We calibrated the prototype in Figure 12.28 with a VNA. Figure 12.29 shows some calibration test results. A plastic cylindrical container filled with the canola oil simulated a human breast. A plastic 1.5-cm diameter sphere made of Eccostock HiK500 (ε = 30) embedded in the container simulated the “tumor.” We performed the measurement by switching pairs of selected antennas to a VNA for many, but not necessarily all, possible antenna port combinations. Postprocessing the data collected for both reflectivity and translucent contrasts created the image. We created several such partial reflectivity and transmission contrast maps for a given slice and then coherently superimposed them into the resulting map. In this case, the detection problem means separating the target signal from other unwanted background signals caused mainly by mutual coupling and “skin” reflection. We could separate the scattered signals because the VNA had a dynamic range of up to 140 dB.
Residual coupling resulted in the blurred and cluttered image in Figure 12.29. There were calibration errors and a lack of observation diversity due to the limited number of circumferential antenna elements. This demonstration took a lot of time for data collection and processing, which makes it impractical for real-time breast screening. However, we have demonstrated a principle that has many potential applications. Further experiments with living human tissue can help verify the value of interferometric imaging for medical imaging and diagnosis.

FIGURE 12.27
Microwave breast imaging using a circular array of transmit-receive modules.

FIGURE 12.28
Construction of the inward-looking array: (a) The linear subarrays of broadband Vivaldi elements transmit and receive signals from 5 to 15 GHz. (b) The partially assembled imager with three Vivaldi subarrays and a plastic container used to simulate a breast.

FIGURE 12.29
2D calibration image of metal cylinder objects embedded into the plastic container of Figure 12.28b.
12.9 Conclusion
This chapter presented the technical background and operational principles for many kinds of material-penetrating UWB imaging radar technologies that have many multi-disciplinary applications. We described such mature technologies as UWB SAR radar imagery for ground-penetrating radar and new emerging developments including non-line-of-sight surveillance sensors, landmine detectors, indoor navigation devices, biomedical diagnostic techniques, and others. For specific application needs the operating media imposes major physical constraints and limits the performance. To achieve a usable contrast between the target and surrounding material electrical properties requires proper selection of frequency and return data processing sophistication. We must understand these relations to design and build high-performance quality material-penetrating radar imaging devices. The operational material media dictate major design choices for signal modulation, hardware construction, system designs, and image processing. In particular, we need signal bandwidths to achieve fine range resolution. Improved cross-range focusing capabilities require optimized synthetic or physical aperture imagery followed by advanced image focusing (beamforming). Recent advances in modern electronic hardware, computers, electromagnetics, image processing, and pattern recognition can move UWB material-penetrating radar imagery toward new levels of sophistication and useful commercial systems for commerce, construction, and health care.
References
1. J. D. Taylor (ed.), Ultra-Wideband Radar Technology, CRC Press, Boca Raton, FL, 2000.
2. M. Skolnik (ed.), Radar Handbook, 3rd ed., McGraw-Hill, New York, 2008.
3. R. J. Sullivan, Microwave Radar Imaging and Advanced Concepts, Artech House, Norwood, MA, 2000.
4. A. Pasmurov and J. Zinoviev, Radar Imaging and Holography, The Institution of Engineering and Technology, London, 2005.
5. D. J. Daniels (ed.), Ground Penetrating Radar, 2nd ed., IEE Radar Sonar Navigation and Avionics Series, IEE Books, London, July 2004.
6. D. J. Daniels, Ground penetrating radar, Chapter 21, in M. Skolnik (ed.), Radar Handbook, 3rd ed., McGraw-Hill Professional, Boston, MA, 2008.
7. H. M. Jol (ed.), Ground Penetrating Radar Theory and Applications, Elsevier Science, Amsterdam, the Netherlands, 2009.
8. A. P. Annan, Electromagnetic principles of ground penetrating radar, in D. J. Daniels (ed.), Ground Penetrating Radar, 2nd ed., IEE Radar Sonar Navigation and Avionics Series, IEE Books, London, July 2004, pp. 3-40.
9. J. A. Richards, The use of multiple-polarization data in foliage penetrating (FOPEN) synthetic aperture radar (SAR) applications, Sandia National Laboratories, Report SAND2002-2239, 2002.
10. A. Boryssenko, Impulse radar emergency system to prevent damage due to harmful objects in vegetation, IEEE International Radar Conference, pp. 116-1121, May 2000.
11. A. Andrews, J. Ralston, M. Tuley, Research on Ground-Penetrating Radar for Detection of Mines and Unexploded Ordnance: Current Status and Research Strategy, Institute for Defense Analyses, D-2416, 1999.
12. C. C. Deluca, V. Marinelli, M. Ressler, T. Ton, Unexploded ordnance detection experiments using ultra-wideband synthetic aperture radar, Proceedings of SPIE, Detection and Remediation Technologies for Mines and Mine like Targets III, Vol. 3392, pp. 668-6677, 1998.
13. P. W. Johnson, B.A. Emessiene, Vehicle-mounted ultra-wideband radar systems and methods, U.S. Patent Application Publication, U.S. Patent 7479918, 2009.
14. A. G. Yarovoy, T. G. Savelyev, P. J. Aubry, P. E. Lys, L. P. Ligthart, UWB array-based sensor for near-field imaging, IEEE Transactions on Microwave Theory and Techniques, Vol. 55, pp. 1288-11295, 2006.
15. X. Feng, M. Sato, Pre-stack migration applied to GPR for landmine detection, Inverse Problems, Vol. 20, pp. 99-9115, 2004.
16. A. R. Hunt, A wideband imaging radar for through-the-wall surveillance, Proceedings of the SPIE, Vol. 5403, pp. 590-5596, 2004.
17. A. Boryssenko, D. Sostanovsky, E. Boryssenko, Portable imaging UWB radar system with two-element receiving array, In Baum C. E., Stone, A. P., Scott, T. J. (eds.), in Ultra-Wideband Short-Pulse Electromagnetics 8, Springer, Science+Business Media, New York. pp. 153-1160, 2007.
18. E. Erman, B. Çiftçioglu, M. Özcan, í. Tekin., High resolution ultra-wideband wall penetrating radar, Microwave and Optical Technology Letters, Vol. 49, pp. 320-3325, 2006.
19. C. Le, T. Dogaru, L. Nguyen, M.A. Ressler, Ultra-wideband (UWB) radar imaging of building interior: Measurements and predictions, IEEE Transactions on Geoscience and Remote Sensing, Vol. 47, pp. 1409-11420, 2009.
20. F. Ahmad, M. G. Amin, S. A. Kassam, G. J. Frazer, A wideband, synthetic aperture beamformer for through-the-wall imaging, IEEE Phased Array Systems and Technology Symposium, pp. 187-1192, October 2003.
21. E. M. Staderini, UWB radars in medicine, IEEE Aerospace and Electronic Systems Magazine, Vol. 17, pp. 13-118, January 2002.
22. E. C. Fear, S. C. Hagness, P. M. Meaney, M. Okoniewski, M. A. Stuchly, Enhancing breast tumor detection with near-field imaging, IEEE Microwave Magazine, pp. 48-456, March 2002.
23. K. D. Paulsen, P. M. Meaney, L. Gilman (eds.), Alternative Breast Imaging: Four Model-Based Approaches, Springer, New York, 2005.
24. S. Y. Semenov, A. E. Bulyshev, A. Abubakar, V. G. Posukh, Y. E. Sizov, A. E. Souvorov, P. M. van den Berg, T. C. Williams, Microwave tomographic imaging of the high dielectric contrast objects using different imaging approaches, IEEE Transactions on Microwave Theory and Techniques, Vol. 53, No. 7, July 2005.
25. M. Elsdon, M. Leach, S. Skobelev, D. Smith, Microwave holographic imaging of breast cancer, IEEE International Symposium Microwave, Antenna, Propagation and EMC Technologies for Wireless Communication, pp. 966-9969, 2007.
26. J. Claerbout, Fundamentals of Geophysical Data Processing: With Applications to Petroleum Prospecting, McGraw-Hill, New York, 1985.
27. W. Allison, Fundamental Physics for Probing and Imaging, Oxford University Press, Oxford, 2006.
28. A. R. Thomson, J. M. Morgan, G. W. Swenson Jr., Interferometry and Synthesis in Radio Astronomy, Wiley-VCH, Weinheim, Germany, 2004.
29. S. Gabriel, R. W. Lau, C. Gabriel, The dielectric properties of biological tissues: III. Parametric models for the dielectric spectrum of tissues, Physics in Medicine and Biology, Vol. 41, pp. 2271-22293,1996.
30. J. D. Taylor, American and European Regulations on Ultrawideband Systems. In Chapter 4 Ultrawideband Radar Applications and Design, CRC Press, Boca Raton, FL, 2012.
31. Ultra Wide Band (UWB) Interference Assessment and Mitigation Studies, Technical Report, AFRL-SN-RS-TR-2006-42, 2006.
32. C. H. Tseng, T. H. Chu, An effective usage of vector network analyzer for microwave imaging, IEEE Transactions on Microwave Theory and Techniques, Vol. 53, pp. 2884-22891, 2005.
33. R. Zetik, J. Sachs, R. S. Thoma, UWB short-range radar sensing—The architecture of a baseband, pseudo-noise UWB radar sensor, IEEE Instrumentation & Measurement Magazine, pp. 39-345, April 2007.
34. D. S. Garmatyuk, Simulated imaging performance of UWB SAR based on OFDM, IEEE Conference on Ultra-Wideband, pp. 237-2242, 24-27, September 2006.
35. B. Juhel, E. Legros, M. Le Goff, Algorithms and experimental results in ultra-wideband SAR imaging, IEEE Radar Conference, pp. 673-6677, 1997.
36. G. S. Smith, Directive properties of antenna for transmission into a material half-space, IEEE Transactions on Antennas and Propagation, Vol. 32, pp. 232-2246, 1984.
37. R. J. Roberts, D. J. Daniels, Modelling near field GPR in three dimensions using the FDTD method, Geophysics, Vol. 62, pp. 1114-11126, 1997.
38. E. C. Ifeachor, B. W. Jervis, Digital Signal Processing, A Practical Approach, Addison-Wesley, Boston MA, 2001.
39. R. C. Aster, C. H. Thurber, B. Borchers, Parameter Estimation and Inverse Problems, Elsevier, Amsterdam, the Netherlands, 2005.
40. B. Levitas, J. Matuzas, UWB radar high resolution ISAR imaging, 2nd International Workshop Ultra-wideband and Ultrashort Impulse Signals, pp. 19-122, September 2004.
41. A. Boryssenko, E. Boryssenko, Inspection of internal structure of walls by subsurface radar, International Conference Ground Penetrating Radar, SPIE, Vol. 4084, pp. 32-335, 2000.
42. W. Burger, M. J. Burge, Digital Image Processing: An Algorithmic Introduction using Java, Springer, New York, 2008.
43. E. Berry, A Practical Approach to Medical Image Processing, Springer, New York, 2007.
44. K. A. Innanen, P. S. Routh, An inverse scattering framework for direct multi-parameter geo-radar inversion, Proceedings of 78th Annual SEG Meeting, Las Vegas, NV, 2008.
45. A.O. Boryssenko, C. Craeye, D. H. Schaubert, Ultra-wideband near-field imaging system, IEEE International Radar Conference, pp. 402-4407, Washington, D.C., April 2007.
46. U.S. Department of Transportation, Federal Railroad Administration. Subsurface Evaluation of Railway Track Using Ground Penetrating Radar, Report DOT/FRA/ORD-09/08, U.S. Department of Transportation, Federal Railroad Administration, Washington, D.C., April 2009.
47. A. O. Boryssenko, D. L. Sostanovsky, A new two-flare-shaped UWB antenna element, Proceedings of Antenna Applications Symposium, pp. 451-4471, 2005.
48. M. Lin, Z. Zhong-Zhao, T. Xuezhi, Two-step imaging method and resolution analysis for UWB through wall imaging, 4th International Conference on Wireless Communications, Networking and Mobile Computing, pp. 1-5, October 2008.