
Chapter 7. AJAX Debugging Guide
▪ 7.2 Looking at AJAX Communications
▪ 7.3 JavaScript Debugging Tools
One of the biggest difficulties of developing in AJAX is figuring out how to put your code back together when your applications go wrong. You don’t know if the problem is code on the server or code on the client, or if it’s caused by a cascade of problems between the two. Debugging server-side problems can be especially difficult because the client-side JavaScript code has a tendency to hide the errors, but there is a solution. This chapter covers a number of tools and techniques that let you see exactly what is happening. Once you have information, solving the actual problem becomes easy.
7.1 Two Sides to Debugging
When you look at an AJAX application, it is important to remember that there are two sides to the equation: the server, which interacts with the back end, and the client, which adds interactivity to the user’s environment. Although this two-sided model has always existed, what has changed dramatically with the rise of AJAX is the complexity of the code running on the client. A secondary complexity is the number of interaction points between the two sides. Added complexity always makes debugging harder, so your focus when debugging an AJAX application needs to be on the various ways you can reduce that complexity.
The first step to debugging any problems is to separate the two sides as much as possible. This is generally an easy process on the server side; if you are generating HTML page chunks, you can go to the URL and inspect the output, looking for errors generated by the server code. If you’re using a JSON or other RPC-based approach, it’s slightly harder. However, you can always check the code that is being run by the RPC call, using normal development tools to look at its state before it’s encoded. Many people find unit tests to be especially helpful in verifying the operation of the server-side code. It’s especially useful for applications that expose chunks of functionality as services to the client. Unit tests work well on the server side because every major language has mature tools for managing these processes, and it narrows the type of problems you’ll see on the data-production side.
On the JavaScript side, unit tests have a harder time being effective. This is due both to the lack of tools and the difficulty of testing an environment that relies on user-created events. There are a number of jUnit ports to JavaScript, and by using these testing frameworks and working hard, you can successfully use unit tests on the JavaScript side as well. Unit tests are a tool, and in AJAX development, they can be powerful because they provide a framework to test both sides of the equation separately. Note, however, that they are not your only option. The most important item to remember is to debug the easy stuff first. If you get an error, always verify that your server-side code is working properly before moving on to the JavaScript.
7.2 Looking at AJAX Communications
Commonly, when you get an error, it’s caused by a small problem, and all you need to do to solve it is to look at what the client sent to the server and then look at the server’s response. Some libraries provide logging mechanisms to record this information, and you can easily create a generic request logger using PHP, but I find tools that directly interact with my browser to be more effective. However, you don’t always have access to these tools, or you may need to debug in a nondevelopment environment. In such cases, you’ll want to know how to build a logger.
7.2.1 Building an AJAX Logger
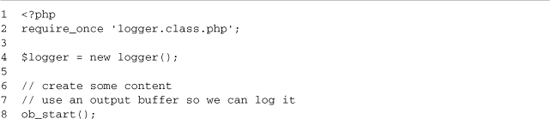
To build an AJAX logger, you first need to identify the information that is sent from the client. This information includes three types of information: query parameters, HTTP headers, and possibly a POST payload. In PHP, the query parameters are automatically parsed and made available in the $_GET variable; if the data sent to the server is a form submission, the POST variables are made available under a similar variable, which is $_POST. You can also read the raw POST submission by reading from php://input; this raw access is required to see the information if the client sent a JSON or XML payload. Finally, you can access the headers through the $_SERVER variable. Listing 7-1 shows an example of reading this information.
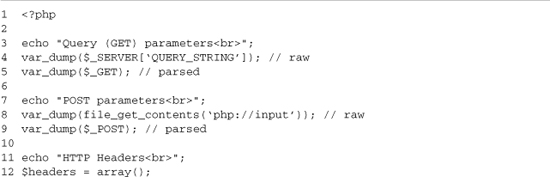
The query parameters are the easiest inputs with which to work; the raw version is available as an index in the $_SERVER array (line 4), and that same data turned into an array is available through $_GET (line 5). POST data is available only when a POST HTTP request has been made. This can be done by using either a form or XMLHttpRequest. The raw POST header is read from php://input (line 8), and the parsed version is on line 9. $_POST is populated only when the POST has a Content-type of application/www-form-urlencoded or multipart/form-data.
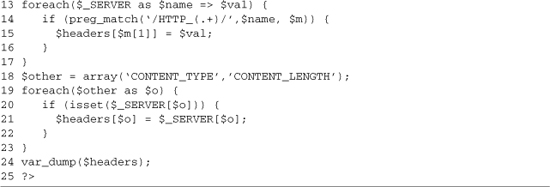
Reading the headers is a little harder because they are stored in $_SERVER along with a bunch of other data. The majority of the HTTP headers are prefixed with HTTP_, so we can display them by looping over $_SERVER and doing a regular expression match (lines 13–17). This match will store the matching headers into an array. A couple of important HTTP headers don’t have an HTTP prefix, so we look for the Content-type and Content-length headers using a secondary check (lines 18–23).
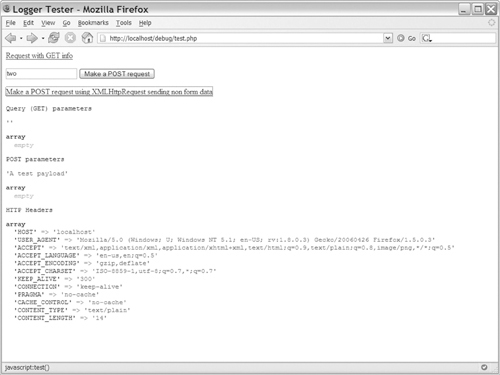
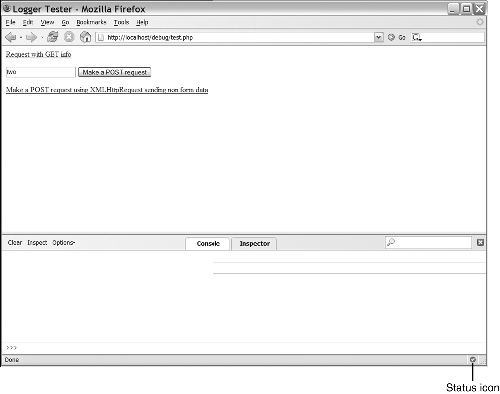
The examples for this chapter, which can be downloaded from the book’s Web site, include a small test page (test.php) so that you can see the output of this script. The output for a GET request with a query, a form POST, and a POST from XMLHttpRequest are shown in Figures 7-1 through 7-3.
Figure 7-1. A GET request with a query string

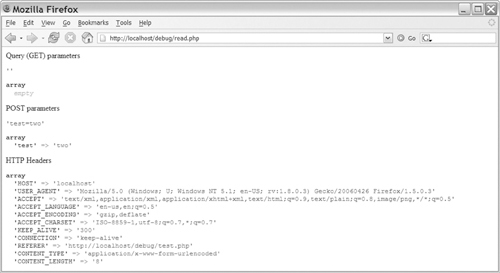
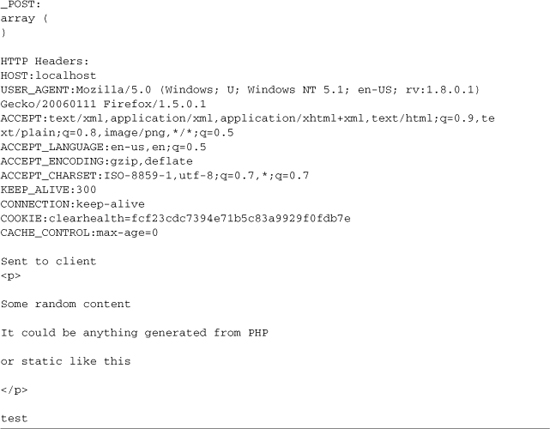
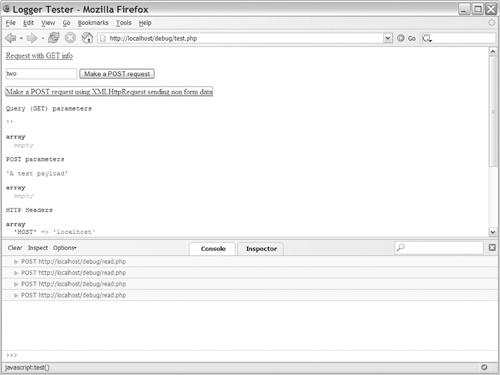
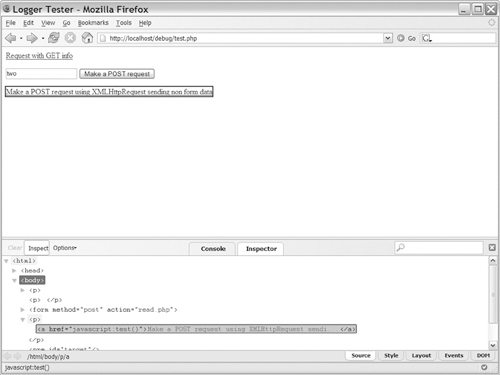
Figure 7-3. A POST request from XMLHttpRequest
To make this code usable for AJAX logging, we just need to format the output and add the ability to write it to a file. It’s also useful to let the server code log what data it is going to send to the client. The final setup is a class called logger. It has two methods: storeServer, which sets the content we’re going to send to the client, and write, which puts the information in a file. Listing 7-2 shows an example of a page that generates HTML chunks for an AJAX page.
7.2.2 Using the Logger
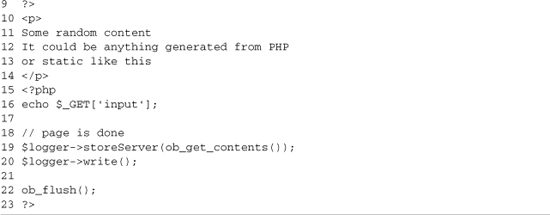
Adding our logger is a fairly simple process. We include the logger class (line 2) and then create a new instance of it (line 4). When the logger instance is created, it automatically grabs the information from the client, so if the $_GET, $_POST, or $_SERVER variables are changed by other parts of the code, our logging is not messed up. Then, we start an output buffer (line 8). This will allow us to log what is being sent back to the client without changing any of our existing code. Lines 10–16 contain some example input, and then we finish our logging process. Line 19 uses the ob_get_contents method to read all the output that has been created and to set it on our logger. Then, on line 20, we write out a log entry. The script ends by calling ob_flush (line 22), which sends out all the generated content we’ve been buffering. This simple logging process stores most of the details of an example entry from the log file, as Listing 7-3 shows.

Logging like this is easy to build into the AJAX library that you are using (if it doesn’t already have its own). It’s easy because the process happens automatically. If you’re using an HTML page chunk approach, you could also build it right into your framework; in that case, the logging could be done on a preconfigured set of pages, or it could be turned on by sending a custom header when you make a request using XMLHttpRequest. Logging like this is especially useful in large-scale testing or production environments in which you don’t have access to the browser to see error messages.
7.2.3 Firebug: A Firefox Debugging Extension
While logging provides you with a lot of information, it’s not the most efficient way to get the information you need. It means keeping another file open and parsing through large text entries for the required information. Logging also doesn’t have access to what is happening to the JavaScript on the browser, so it doesn’t contain the full picture. Tools that can be added to the browser can get around most of these problems and have the ability to offer you a rich user interface.
If you’re using Mozilla Firefox, extra functionality can be added to your browser through the use of an extension. The Firebug extension (www.joehewitt.com/software/firebug/) adds a popup bar at the bottom of the browser that lets you see JavaScript errors. With it, you can also view details of each XMLHttpRequest request, inspect DOM elements, and run JavaScript commands against the current page. An installation link is available from the project’s Web site. The basic interface is shown in Figure 7-4.
Figure 7-4. Firebug: a Firefox debugging extension

Firebug attacks the debugging process from the JavaScript side. Whenever a JavaScript error happens, an error icon is shown in the lower-right corner (see Figure 7-5). Clicking this icon will bring up the console, showing you the errors. In its default configuration, these errors include errors generated by CSS, the browser, and its extensions (see Figure 7-6). To limit the displayed errors to just JavaScript ones, use the Errors drop-down box to deselect Show Errors From Chrome and Show CSS Errors. You can also get to the dialog box even when an error hasn’t happened by clicking the error icon in the lower-right corner (see Figure 7-7). Doing this gives you an easy way to get to the XMLHttpRequest inspector.
Figure 7-5. Firebug error icon
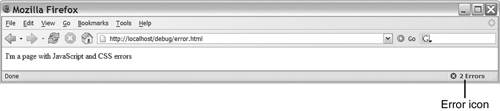
Figure 7-6. Firebug error selector

Figure 7-7. Firebug status icon
The XMLHttpRequest inspector lets you see the POST payload that was sent to the server, the response from the server, and the properties of the XMLHttpRequest object that sent it. A new row is added to the Firebug pane each time a request is made using XMLHttpRequest, so you can also use it as an overview of your AJAX activity. Each request entry includes the HTTP request type (generally GET or POST) and the URL to which the request was made. Figure 7-8 shows Firebug with several requests in it.
Figure 7-8. Firebug with multiple XMLHttpRequest entries
Now if you have a request that isn’t working as expected, you can start the debugging process by doing the following:
1. Open Firebug and find the request in the pane. Requests are added to the bottom of the list, so scroll down to the most recent one. Selecting the request expands it, giving you three tabs from which to choose.
2. Select the Post tab on the right side to see the POST payload that you sent to the server.
3. Select the Response tab to see the data that the server returned.
4. Select the Headers tab to see the HTTP headers that the server returned.
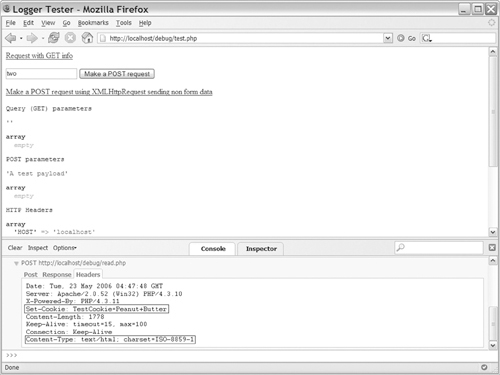
Depending on the configuration of the server, you may see a large number of headers returned with the data, as in Figure 7-9. The most important ones are Content-type and Set-Cookie. Content-type has to be set to text/xml for XML-based requests to work. Many libraries also use this header to determine if the server is sending JSON that the library needs to decode, or if the content is just plain HTML. The Set-Cookie headers mark which cookies were set on this request; you can use them to verify that new authentication or other cookies were set as needed.
Figure 7-9. Firebug showing the Headers tab of an XMLHttpRequest entry; the important fields are outlined
Firebug also has the capability to run any JavaScript command against the current page. To do this, type a JavaScript command such as document.getElementByName('test').style.color = 'red'; into the field at the bottom of the page (see Figure 7-10). You can also inspect page elements, get layout information, and view all elements, DOM properties, and events (see Figure 7-11). These features are useful in the overall development processes, but the biggest aid to debugging AJAX requests is the XMLHttpRequest inspector.
Figure 7-10. Running a JavaScript command in Firebug
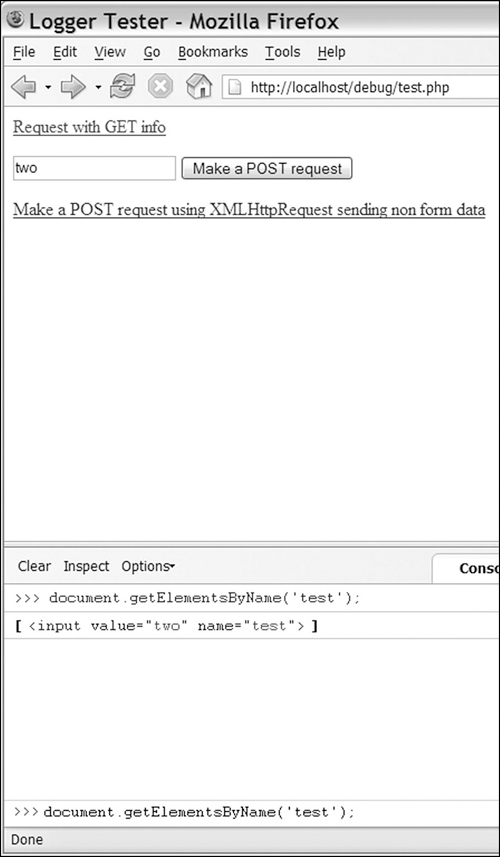
Figure 7-11. Inspecting a DOM element with Firebug
7.2.4 Fiddler
If you develop in Internet Explorer or just need to track down an Internet Explorer-specific bug, you obviously won’t be able to use Firebug, but there still are a number of useful tools to help you. One tool is Fiddler, which is an HTTP debugging proxy that lets you see each request made by Internet Explorer and the response it receives from the server. Because it is an external tool, it can’t look at the JavaScript the way Firebug can, but it does have an easy-to-use interface and it does give you an easy-to-use view of each request.
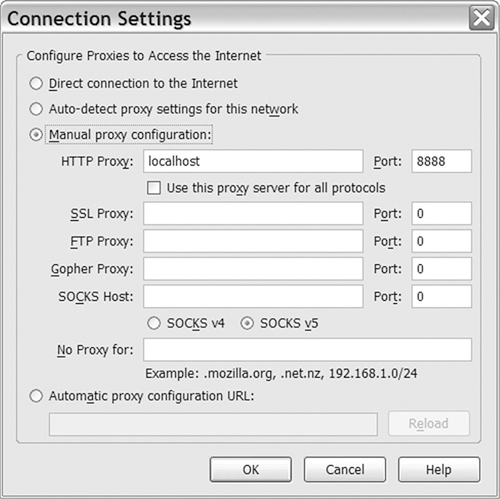
You can download Fiddler from www.fiddlertool.com/; this Web site also includes a wealth of information on how to use its advanced scripting and transformation features. Once you have it installed, you just need to run it, and Internet Explorer will automatically be set up to use it. You can also use it with other browsers by setting them up to use Fiddler as an HTTP proxy. You just set the proxy host to localhost and the port to 8888. An example of setting up the proxy in Firefox is shown in Figure 7-12.
Figure 7-12. Setting up Firefox to use Fiddler as its proxy
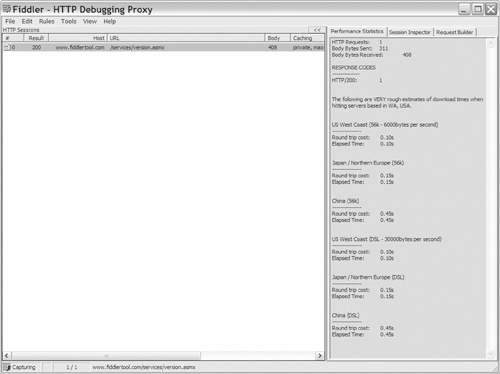
Once you’ve run Fiddler, open your browser and perform the request that is giving you problems. Each HTTP request is shown as an entry in the main pane; secondary requests for images and CSS files will be shown with gray text, and the two HTML pages will be shown in blue. You can clear entries from the pane by right-clicking them and selecting remove. The basic session browsing interface is shown in Figure 7-13.
Figure 7-13. Main Fiddler interface
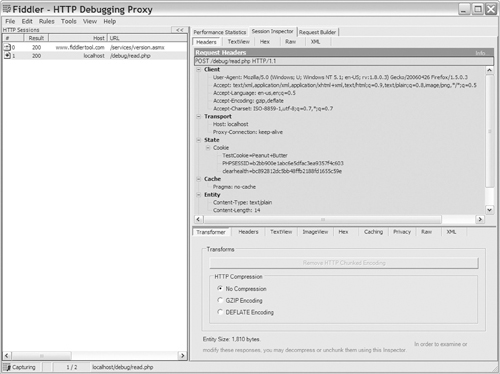
Once you’ve identified the HTTP request you want to inspect, select it in the sessions pane on the left side and then look at the pane on the right side. This pane has three main tabs. For debugging purposes, the most useful tab is the Session Inspector. After you select the Session Inspector tab, the pane will be split into two sections: the top showing the information that was sent to the server and the bottom showing the server’s response (see Figure 7-14). For both the request and the response, you can view the request in a number of different formats, the most useful being the Headers and TextView views. If you’re using XML to move data between the client and the server, you will also find the XML view to be useful because it will show the XML data in a formatted display.
Figure 7-14. Fiddler session Inspector interface
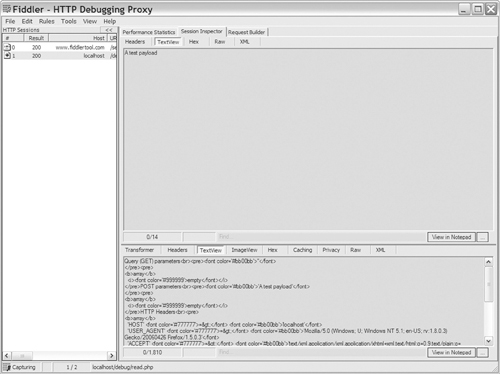
The Headers view shows you a formatted version of the HTTP headers used in the request (see Figure 7-15). You can use this view to verify cookies are being sent, to see the Content-type of the data, and to view any HTTP status codes. The online help gives more details, but outside of verifying expected Content-types, you shouldn’t need to spend much time here. The TextView view shows you the content that was sent to the server in a POST request and the results that the server sent back. The view offers the ability to search the content inline (the blue Find bar) and to open another program, such as your favorite text editor. (The open with command is the button to the right of the blue Find bar). You can see an example of the TextView in Figure 7-16. Fiddler offers a number of other features, which are useful for transforming the request and responses, but they are not all that useful in basic AJAX debugging situations.
Figure 7-15. Fiddler Headers view
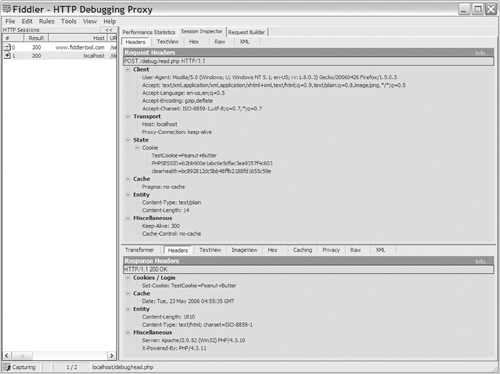
Figure 7-16. Fiddler TextView view
7.2.5 General Debugging Scenarios
Firebug, Fiddler, and custom logging code all provide extra information about an AJAX request. These types of tools are useful in scenarios in which you make an AJAX request and the request dies without giving useful information to your JavaScript code. In most cases, looking at the response from the server will quickly point out the problem. It could be an error in your server code or just some unexpected data being returned.
Debugging tools such as Fiddler or Firebug can help you figure out what data you’re sending to the server. This can be especially useful once you start using more complex JavaScript widgets and AJAX libraries. These libraries offer a lot of functionality, but they move the AJAX operations far away from the actual event. This can make it hard to see what is really happening, so by using a tool like Firebug or Fiddler, you can see the HTTP request that was sent to the server and know what is really going on.
7.3 JavaScript Debugging Tools
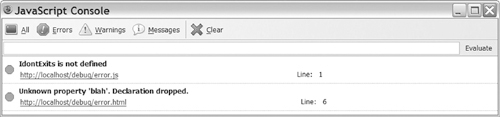
The tools we’ve looked at so far are good at giving you a picture of the communication between the client and the server, but they’re not a huge help if the bug is somewhere in your JavaScript code. JavaScript isn’t known for having a large number of tools to help the developer, and if you’re working with Internet Explorer, that lack of tools is still true; however, Firefox (and other browsers) gives you a lot of tools that are helpful with debugging and developing JavaScript. For instance, the most basic Firefox development tool is the JavaScript console (see Figure 7-17). Any JavaScript errors are shown in it, and clicking one of them will show you the line in your code where the error happened. You can view the console by selecting it from the Tools menu; it’s labeled either JavaScript Console or Error Console, depending on your Firefox version. (Note that a number of Firefox extensions, including Firebug, provide quicker access to this information.)
Figure 7-17. Firefox JavaScript Console
Out of the box, Internet Explorer gives you a particularly hard time debugging JavaScript because it doesn’t provide correct lines numbers when external files are used. The solution to this is to install the Microsoft Script Debugger (www.microsoft.com/downloads/details.aspx?FamilyID=2f465be0-94fd-4569-b3c4-dffdf19ccd99&DisplayLang=en). After you install the debugger, you need to turn it on. To do so, follow these steps:
1. Open Internet Explorer and go to Tools -> Internet Options.
2. Select the Advanced tab.
3. In the Advanced tab, you see an option labeled Disabled Script Debugging (Internet Explorer). Uncheck this option to enable the debugger. This debugger dialog box is shown in Figure 7-18.
Figure 7-18. Enabling the Microsoft Script Debugger

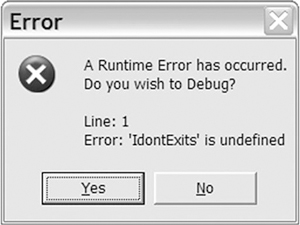
4. Once you have the debugger enabled, you receive a dialog box for each JavaScript error. The dialog box asks if you want to debug your error (see Figure 7-19). Selecting Yes will open the debugger and show you the line in the file where the error occurred.
Figure 7-19. Script Debugger Error dialog box
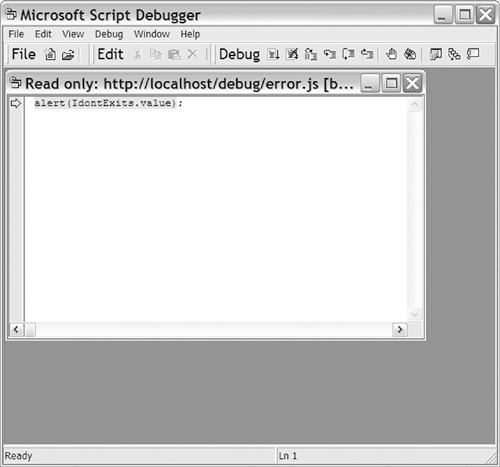
The basic debugger interface is shown in Figure 7-20. From this screen, you can step through the code using the Debug menu, just as with any other debugger. The debugger has two main drawbacks: It creates a popup dialog box for each JavaScript error that has to be dealt with, and it tends to become unstable when actually using it for debugging. That being said, the Script Debugger quickly gives you the actual line where JavaScript errors happen, which is a big advantage over the normal IE error message.
Figure 7-20. Basic Script Debugger interface
7.4 JavaScript Exceptions
JavaScript has a number of language features that are useful in the debugging process. The biggest one of these is the ability to catch any JavaScript error as an exception. This is done by wrapping code that can cause errors inside of a try block followed by a catch block. In the catch block, you have access to an Error object, which contains additional information about the error. This Error object contains the name of the error and a message. On Firefox, it also includes the file in which the error happened, the line on which it happened, and a call stack. Listing 7-4 shows an example of catching an error. Listings 7-5 and 7-6 show the output of the catch block in Firefox and IE.
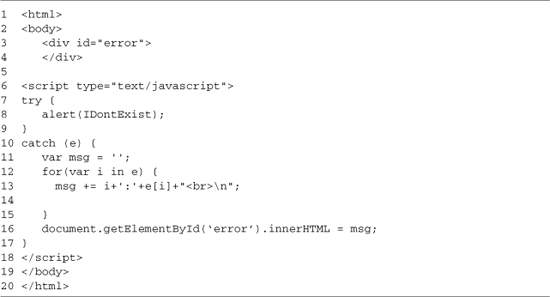
Listing 7-4 is simple. It contains a basic HTML page with a JavaScript block that creates the error and then prints out the resulting error object. Lines 3–4 give us an element to which to write an error message. Line 7 starts the try block; it’s ended by the bracket on line 9. All JavaScript errors that happen in the try block will cause the catch block to be run. If no error happens, the code in the catch block is ignored. The catch block on lines 10–17 takes the error object and prints out each property. This text is then added to the error element, showing the value of the error object.
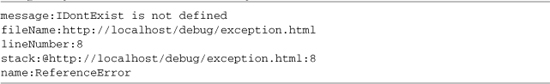
Listing 7-5. Output of exception.html in Firefox
Listing 7-6. Output of exception.html in Internet Explorer
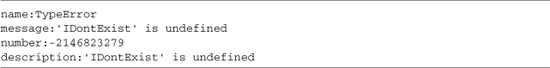
Looking at the error messages, you can see that exceptions in Firefox are more useful for general debugging, but exceptions are still useful even without line properties because you end up knowing which block of code caused the error. They also allow you to handle the error programmatically, letting you give the user an error message or even perform a workaround instead of having your code silently break.
7.5 Dumping Variables
As shown in lines 10–17 of Listing 7-4, there are lots of cases in JavaScript in which you have an object but don’t know what properties it contains. This is especially common when you are passing JSON-encoded data from the server to the client. JavaScript provides the “for in” loop for looping over the properties of any object. Using this loop, you can construct a basic dump function that allows you to quickly see the properties of an object. Listing 7-7 shows an example function.
Listing 7-7. A JavaScript Property Dumping Function
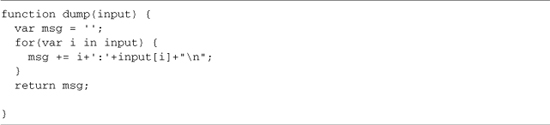
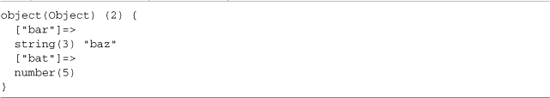
You can then use this function to alert the contents of the object or assign the debug output to a debug element on a page. A simple function like this can save a great deal of time in the debugging and development processes. Building on this same concept, the HTML AJAX library provides a utility function called varDump that provides additional information. This method is based on the var_dump function in PHP and provides the type of each element as well as its value. It also supports recursion, giving you the output of any child objects. Listings 7-8 and 7-9 show the output of varDump against different inputs. Sample usage is shown in the following code:
alert(HTML_AJAX_Util.varDump(input));
Listing 7-8. Sample varDump Output (an Array with Another Nested Inside It)

Listing 7-9. Sample varDump Output (an Object)
7.6 Summary
One of the biggest risks in adding AJAX to an application is the increased complexity of debugging. Using the tools covered in this chapter, you can help reduce that risk. The following tools and techniques offer a solution to many of the problems you will hit when debugging AJAX:
• Server-side logging. This logs AJAX requests and results, allowing you to debug AJAX communications without additional tools. It also allows you to collect debugging data from multiple clients.
• Firebug. This is the Firefox extension that adds a viewer for AJAX requests and results. It also provides DOM viewing and JavaScript console improvements.
• Fiddler. This is the debugging proxy, cross-browser way to view AJAX requests and results.
• Script Debugger. This adds basic JavaScript debugging to IE and is the only way to find a line of JavaScript that caused the error in IE.
• JavaScript exceptions. The use of these is the programmatic way of managing JavaScript errors, and they allow you to isolate problematic sections of JavaScript code.
• Dumping variables. With these, you can build JavaScript functions to see the contents of an object on the fly.
The most important item to remember in the debugging processes is to test the server side and the client side separately whenever possible. When that’s not an option, you’ll find that looking at the data sent between the server and the browser is helpful. Most importantly, like debugging in any language, strive for a clean simple design. AJAX is already adding the complexity of client/server communications; if you add tons of complexity in your design, debugging your application will quickly become unworkable.