
Chapter 10. Speeding Up Data Display
In this chapter
▪ 10.1 Overview of the Sun Rise and Set Data Viewer
▪ 10.2 Building the Non-AJAX Version of the Sun Rise and Set Viewer
▪ 10.3 Problems with the Non-AJAX Viewer
▪ 10.4 Improving Viewing with AJAX
A common Web development task is showing large data sets. To navigate through the dataset, the user is forced to reload the entire Web page, which makes data browsing a slow process. The example we will build in this chapter is a graph of the time the sun rises and sets for different cities. It will also include a table showing the data from which it’s built; this data browsing is especially handicapped by the constant reload process. The actual graph generation is a slow process, and because it shows data for the entire year, it doesn’t need to be updated as you look through the data month by month. In this chapter, I will show how you can use the AJAX technique of subpages to greatly speed up data browsing.
10.1 Overview of the Sun Rise and Set Data Viewer
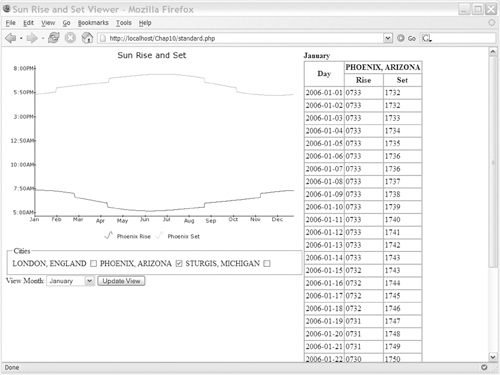
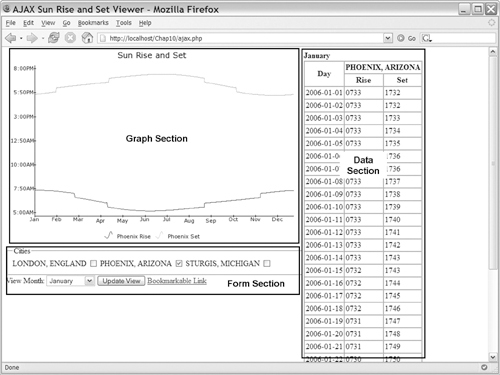
In this chapter, we look at a specific case that illustrates the general problem of slow data display. Our case is a small PHP and HTML site that displays the data for the time that the sun rises and sets in various cities. The page includes a graph of a full year of this data, and it includes a table that shows one month of the data. The overall layout of the site is shown in Figure 10-1.
Many times, when you display large amounts of data in a table, you use a user interface (UI) element called a pager. A simple example of this is shown in Figure 10-2. This sun rise and set viewer uses a simpler version of this because the data can easily be divided into months. The pager for the viewer (see Figure 10-3) divides the data set by month and puts all the options in a drop-down widget because the number of possible pages is only 12.
Figure 10-1. Basic site interface


10.2 Building the Non-AJAX Version of the Sun Rise and Set Viewer
This use case starts by building a standard HTML version, which means we’re using AJAX as an enhancement at the end of the development process. This is a common AJAX approach, and it follows the basic pattern of building a site, finding its problem areas, and then updating those problem areas with AJAX to improve the user experience. This approach can have some disadvantages, especially on complex multipage sites, because adding in AJAX might cause workflows to be changed, causing large parts of the site to be updated. However, it does work well if you focus on specific tasks that can be upgraded.
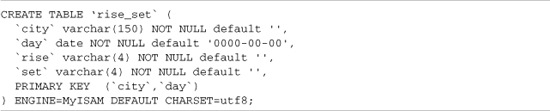
This example stores its data in a MySQL database, so we need to start by setting it up. If you’re not used to using a database with PHP, don’t worry; the AJAX changes are usable with any server-side language. PHP just provides the needed code to have a fully working example. First, you need to create a database named rise_set. This can be accomplished in an admin tool such as phpMyAdmin or by running create database rise_set;. Once you have the database created, you need to create the table in which to store the data. To do this, load the SQL that is in Listing 10-1.
After the table is set up, you’re ready to import some sun rise and sun set data. The data has been gathered from the U.S. Naval Observatory Web site (http://aa.usno.navy.mil/data/docs/RS_OneYear.html). Data for two example cities has already been prepared and can be used by running the SQL located in data/phoenix.sql and data/sturgis.sql. The script that generated these SQL files (data/dataToSql.php) is also provided, and you can use it to prepare data for other cities. First, get a dataset for a city by filling out the form at the U.S. Naval Observatory Web site, and then copy the data into a text file. (You want just the data, not HTML tags). Then you can run the dataToSql.php script over the file and redirect its output to an SQL file, which can then be loaded into your database server. Here’s an example command loading in data for London, England:
php DataToSql.php london.txt > london.sql
mysql -u root rise_set < london.sql
Now that we’ve done the prep work, let’s look at the overall design of this site. It consists of three parts:
• The SunRiseSet class grabs data from the database and performs any needed formatting.
• The Graph.php page generates the graph using data from the SunRiseSet class.
• The Standard.php page builds the interface and displays a month of data at a time in a table.
Each part will get more coverage in the following sections, but the important part is Standard.php because it creates the HTML user interface that you will enhance with AJAX.
10.2.1 SunRiseSet Class
The SunRiseSet class is a simple class that connects to the database and provides methods for the other pages to access the data that’s been loaded into the database. Because all database access takes place through this class, you can easily update it to support a different back end. If you want to run the examples on your own server, you may need to update the database connection information; these variables are located on lines 4–7 of SunRiseSet.class.php.
The SunRiseSet class, shown in Listing 10-2, contains two setter methods that are used to configure the user-selectable components of the data access. The setMonth method allows you to set the month of data that will be returned by the monthsData method, and it is used by the table that is rendering code. The setCities method allows you to set the city to which the data will be limited. Along with these setters, five data access methods are provided: possibleCities(), monthList(), monthsData(), graphData(), and minRise(). More details about these methods are shown later as we walk through the code of the class. The class also contains a number of methods for querying the database; these internal methods are prefixed with an underscore (_) to show that they shouldn’t be used outside of this class.
Listing 10-2. SunRiseSet.class.php


The class starts with some basic setup. Lines 4–7 contain the basic database connection parameters. $dbHost contains the DNS name or IP address of the MySql server, $dbUser contains the username with which to connect, $dbPass contains the password, and $dbName contains the name of the database. After that, we start the class definition (line 9). Inside the class, we define five properties (lines 10–14), which the methods of the class use to hold settings and shared variables. $_conn holds the database connection resource and is set by the _connect method (line 95) and used by the _query method (line 112). $month holds the selected month and is set by the setMonth method on line 16; $year holds the current year and is simply set to 2006. $cities contains an array of all the selected cities; it is set by the setCities method on line 20. Note that $citiesIn also contains a list of selected cities, this time formatted to be used in an SQL in clause.
Lines 16–46 contain the two setter methods and several basic data access methods. The method setMonth (lines 16–18) takes a single parameter, the integer value of the selected month, and sets it to $this->month. The setCities method (lines 20–29) performs a similar action, only this time, it takes an array of cities. It also builds the citiesIn method. This method takes an array and turns it into a quoted comma-separated string. If the array had two values, one for Phoenix and one for Sturgis, it would equal 'PHOENIX, ARIZONA','STURGIS,MICHIGAN'.
The possibleCities method (lines 31–38) returns an array that contains an entry for each city in the database. This array is used to build the interface for selecting cities. The list is built from the query “select distinct city from rise_set”, which returns one row for each city in the rise_set table. The helper function _querySingleArray is used on line 37 to return the values from this query. The monthList function (lines 40–47) creates an associative array containing 12 months; the key of the array contains the values 1–12, with their matching values being generated by the PHP date function. You can see sample output from these functions by running the SunRiseSetDemo.php example page. Listing 10-3 continues the SunRiseSet class.
Listing 10-3. SunRiseSet.class.php Continued
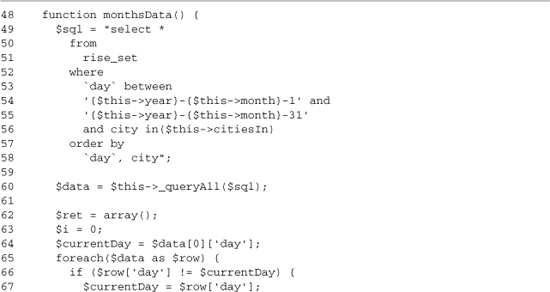

Lines 48–76 define the monthsData method. This method queries the database and returns an array of data containing one month of rise and set data for the selected cities. The cities are chosen using the values set by setCities, and the month is chosen by the value set by setMonth along with the $this->year property. The SQL query is built on lines 49–58. This query is then executed using the _queryAll helper method (line 60). This returns a multidimensional array, with the first level being the row index and the second level being the values of the row in an associative array. We then loop through the results (lines 65–74), which builds an array one row per day, with subentries under that row for each city. Listing 10-4 shows an excerpt of that output.
Listing 10-4. Sample Output of monthsData()

Listing 10-5. SunRiseSet.class.php Continued

Lines 77–93 define two functions that are used by Graph.php to load its data. The Image_Graph graphing engine loads its data based on the concept of data sets, so instead of grabbing a combined array, like the month data case, we return the data one city at a time. The graphData method on lines 77–83 accomplishes this process by building a query limited to the passed-in city and then returning all its results using the _queryAll helper function.
The minRise method defined on lines 85–93 is used by the graphing code to set the bottom value on its Y axis. Because this minimum SunRise value needs to take into account all the cities being displayed, the query looks for the minimum rise value where the city is among the currently selected cities in the $this->citiesIn list. A single time value is returned from the function.
Listing 10-6. SunRiseSet.class.php Continued
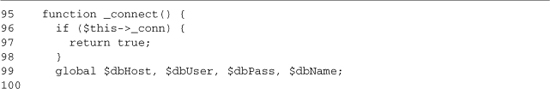


The rest of the class (lines 95–140) defines the database connectivity and utility methods. They provide a basic wrapper around the MySql database functions. The _connect method on lines 95–109 connects to the database. If there is a problem, it stops script execution and shows an error message. The _query method (lines 112–119) executes an SQL query and does basic error handling. Lines 121–129 define the _queryAll method, which uses _query to execute an SQL query and then loops over its results, grabbing an associative array for each row. The _querySingleArray method (lines 131–138) is similar to _queryAll. The only difference is that instead of returning an associative array for each row; it uses the value of only the first column for each row.
10.2.2 Graph.php
The graph on the viewer is generated using a PEAR library called Image_Graph (http://pear.php.net/Image_Graph). To run the examples locally, you need to install the library, which can be accomplished by running pear install Image_Graphalpha. I won’t walk through all the graphing code, because it’s not necessary to understand it to understand how the example works. The graph is generated by the Graph.php script, which will be used as the URL for an image on the HTML page in which it’s displayed. The graph takes the GET parameter of cities and uses it to select which cities will appear on the graph. The graphing period is one year, meaning the graph uses 365 points per city. This large number of points causes much of the slowdown in the graphing processes, but dynamic image generation is usually a slow area in any Web site, no matter how much data it’s working with. This slow speed is due to the complexity of the image generation process.
In this example, the slow processing point is this graph, but this slow processing could be replaced by any number of other problems. On another site, you may have some database queries that are slow and impossible to speed up, or you might have some other visualization with lots of processing overhead. In many cases, page loads can be slow simply due to the large amounts of information and the formatting of the HTML that is being used. In other cases, the page performs fine, but the user experience isn’t great due to the constant reload process that browsing through data causes.
10.2.3 Standard.php
Standard.php generates the HTML that makes up our sun rise and set viewer. This page contains a form that is used to change which cities are displayed and which month of data the table shows. It also links in the graph and generates the data table. This page contains a minimal amount of PHP code, most of it being foreach loops to build the options for the form or the data in the table. This separation of the bulk of the logic from the building of the HTML is important because it will make the creation of an AJAX version much easier. Listing 10-7 presents the code.
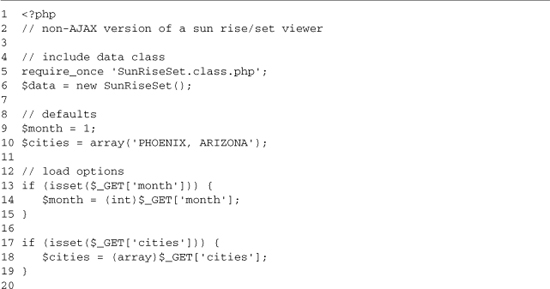


The first 33 lines of Standard.php do the basic PHP setup. On line 5, we require the SunRiseSet class that gives us access to the data in the database. On line 6, we create an instance of it, and then we start the process of setting its defaults. First, we set some default values to use throughout the page if nothing is passed in by the form (lines 9–10); then we check for month and cities being passed in by the form and, if so, overwrite our default values with those from the form. On lines 22–23, we use those values and set the month and cities on the SunRiseSet instance. To finish up the setup portion, we format the $cities variable so that it can be passed in a query string (lines 26–29), set the URL from the form to which to submit (line 31), and put our list of months into the variable $months so that it can be used later on.
Lines 34–68 add the graph and the form to the page. These elements float to the left, so as long as you have a wide enough screen, you’ll be able to see the data table next to them on the right. The graph is added to the page on lines 40–41. We add $graphOptions to its query string, which lets us set the cities the graph will display. On lines 43–68, we build the form that provides the viewing options for this page. The page submits using GET to the $action variable, which we set to the current page on line 31.
The first element in the form is a fieldset that contains a checkbox for each possible city (lines 44–56). We get the list of options using the possibleCities method (line 46) and loop over the array; in each iteration, a checkbox element is created (lines 49–53). Line 48 outputs the name of the city to use as a label, and line 50 outputs $city again (this time as the value of the checkbox). Lines 51–52 finish up the output for the checkboxes, checking whether the city is currently selected; if it is, it outputs CHECKED.
The next section of the form builds the selected drop-down element for picking which month to view. The element is started on line 58 and is named month. Lines 59–64 contain a loop that produces the drop-down’s option elements. The values from those options are pulled out of the $months variable that was set on line 32. Lines 61–62 check to see if the current element is selected and if it is, outputs SELECTED. The form finishes up with a Submit button on line 67.
Listing 10-8. Standard.php Continued


The page finishes by producing the data table. On line 71, a label for the table is created, showing the currently selected month. Then on line 72, the actual table starts; the table is given some basic formatting, some cell padding, and a border of 1 pixel. Then we move on to its dynamic aspects. First, we create the header for the table (lines 74–87). The header has two rows: The first displays the name of each selected city, and the second subdivides each city column into a rise and set column. We create the list of cities in the foreach loop on lines 77–79, looping over the $cities variable, which contains our currently selected cities, and outputting each one with a colspan of 2. We then loop over the same variable again (lines 82–85); this time, two cells are outputted: one for rise and one for set.
The table is finished up by a loop on lines 89–97 that generates the table body. We get the data for this loop from the monthsData method (line 89); if you look back at the explanation of monthsData shown in Listing 10-3, you’ll remember that it contains a subarray for each city. Thus, we start off a row by outputting a cell for the date (line 91). We then read the date from the first city’s data, knowing that all the dates are the same. Then we loop over the $cities arrays, printing out rise and set times (lines 93–94) for each. This completes the page, giving us a graph, a form, and a data table.
10.3 Problems with the Non-AJAX Viewer
Now that we’ve implemented the viewer, we can see that it has a number of problems. The first problem is performance. Generating the graph—especially for a large number of cities—can take three to five seconds. This is further aggravated by the fact that obtaining a new set of monthly data takes a page reload. It might be possible to eliminate some of this performance penalty though caching or other graphing speedups, but that’s not a reusable solution, and if we would add any more interactive features, such as highlighting a day on the graph, the caching would be unworkable.
The viewer also gives poor user feedback because of how the browser handles loading the slow images. In Internet Explorer, the user will see an empty box where the image will be shown (see Figure 10-4), whereas in Firefox, the old image will be shown until the reload finishes. Firefox’s behavior around image loading (see Figure 10-5) is especially problematic because it makes the page look like it’s done loading even though the cursor still has a loading icon and is waiting for the graph to finish loading.
Figure 10-4. Internet Explorer’s slow image-loading behavior

Figure 10-5. Firefox’s slow image-loading behavior

10.4 Improving Viewing with AJAX
Because the biggest problem with the viewer is that it’s reloading content that’s not changing, we want to look at AJAX patterns that we can use to avoid this. We have a number of options, but they all end up having the same effect: Instead of treating the viewer as one monolithic page, we get to treat it as a number of sub-pages. This allows us to load data for each section independently, which will keep us from needing to reload the slow graph when we just want to view the next month’s data. This independent loading gives us a speed advantage over a monolithic approach. We end up with three different sections, one for each of the main elements. (These sections are shown in Figure 10-6.) Each section can be updated independently from the others, and in this case, input from the form section controls what the other sections do. Any change to the form, either in the selection of a different city or in the changing of the month, causes the data section to update. The graph will only be updated when the selected cities are changed.
Figure 10-6. Viewer with sections labeled
Sectioning a page is an easy AJAX pattern to implement, but it’s not without its disadvantages. The biggest disadvantage is that the actions you perform are no longer directly bookmarkable. You can add a bookmark link that always contains the URL to get to your current view, but users might not recognize it and will just bookmark the page like normal, getting its default value instead of the current one. There are some solutions to this problem. They involve using the fragment part of the URL (the value after the #), but they suffer from browser compatibility problems and complex programming models. The fragment solutions also have a hard time fixing both the Back and Forward buttons and booking at the same time. Eventually, there will be an easy solution to the bookmark problem, but it’s not ready today.
10.4.1 Viewer HTML Updated for AJAX
To implement our AJAX actions, we start by adding a submit handler to the form:
<form action="<?php echo $action; ?>" onsubmit="return updatePage(this)" id="form">
This function returns false, canceling the normal form submission process. Now that we have client-side code in control of the submission process, we can figure out what needs to be updated. This means we need some code to always update the data section and to update the graph section only when the selected cities have changed. Using HTML_AJAX, updating the data section is simple, as shown here:

We start the process by using the HTML_AJAX.formEncode method to turn the values of the form into a queryString. This string is the same one that you can see after the “?” in the URL when doing a normal form submission. Then, we build a callback function that will be called when the HTTP request to the server is complete. We then call HTML_AJAX.grab against the AjaxTable.php page, passing in the queryString we built from the form and the callback we just built. The new PHP script will be explained later in section 10.4.2 (Viewer PHP Script Updated for AJAX), but it follows the same subpage split, generating just the data table section.
Figuring out if the currently selected cities have changed is more difficult. The basis of this process is a function that looks at the form and creates a hash of its current check status. This function will run on page load and then again each time we detect a change so that we have a value to compare against the next time. The code for this function is shown here:

The cities variable is defined outside of this function as var cities = {};, which puts it in the global scope and lets other functions use it. The updateCurrentCities function works by first getting all the elements of the form and then looping over them to look for cities elements. Because each checkbox has the same name (cities[]), we can use those elements that are checkboxes for city selection; if the elements had different names, an easy solution would be to give them all the same CSS class. The value of each checkbox is the name of the city, so we use that as the key in the cities hash and then store if the box is checked as the value.
In our form-handling function, we’ll loop over the elements again, comparing each value against the value stored in the hash. If any one of the checkboxes doesn’t match, we stop the comparison, update the src property of the graph, causing it to reload, and then run updateCurrentCities again. The code that does this is shown here:

Now that we have the basic AJAX functionality added to the page, we are ready to start improving its usability. The first step is adding a link that can be bookmarked and will return you to the current set of data you’re viewing. Upon page load, this link will contain the same URL as the form, so we can use the $action PHP variable again:
<a id="blink" href="<?php echo $action;?>">Bookmarkable Link</a>
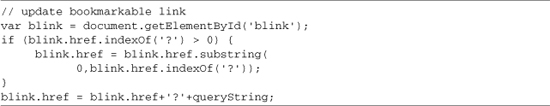
Once the link has been added to the page, we need to add code to update it when the form is submitted. This code is pretty simple: It checks the current href on the blink tag to see if it has a “?” in it. If it does, all the content after it is removed. Then, we append the new queryString to the link. This is the same string we send to the AjaxTable.php script. The code that performs this bookmark link updating is shown here:
Adding in the bookmark link helps solve some of the usability problems caused by AJAX, but it doesn’t do anything for the page’s original usability problem, which is poor feedback. To do this, we need to add a feedback mechanism to the loading of the graph. The basic way this works is that we create a DIV element and position it over the graph. It will contain the message “Loading, please wait” and can be further formatted using CSS to make it look nice. This DIV will be hidden by an onload handler that we will add to the image. To improve the look of this loading notice, we’ll use some visual effects from the scriptaculous library. These steps are accomplished by using the startLoad function, which is shown in Listing 10-9. The startLoad function takes as its single parameter the element to which to add the loading effect.
Listing 10-9. The startLoad JavaScript Function

In basic operation, the startLoad function takes the loading div and shows it using the Appear effect (line 14); it then sets up a Fade effect to hide the div when the page is loaded (lines 9–11). The rest of the function (lines 2–8) handles the initial case where we dynamically create the loading div. As we create the div, we assign it to a property on the element to which we’re adding the message. Doing this makes the code reusable and helps make it clear to what element the loading div belongs. Line 3 creates the div, line 4 sets its CSS class and lets it be styled, and line 5 sets the height of the element. Width can be easily set in CSS because a width of 100% works, but percentage heights don’t work in IE, so we need to calculate the absolute height that is needed to cover the area where the element will be loaded. The setup finishes by appending the loading node to the parent of the element to which it will be applied. This means that the image tag for the graph must be created inside another element, but this works fine because we will want that wrapper div for CSS purposes.
The final usability change to make is to replace the default HTML_AJAX loading feedback effect with a custom one. Because updating the data table is normally a fast process, we want to highlight the table when it has been updated. Without this visual queue, users might not notice that something has changed. We’ll also change the cursor to the standard page load progress cursor while the table is updating; that way, the user will get feedback if the loading is delayed by a slow network connection. This is implemented by creating an options hash and passing it to HTML_AJAX.grab:

This options hash creates a custom event handler that is called when a connection to the server is opened, and this handler sets the cursor to progress. Then we create a custom function to be called when the page load is finished. This function sets the cursor back to default and then runs a highlight effect on the table. This effect highlights the table in yellow and then fades out the highlight over a short period of time.
10.4.2 Viewer PHP Script Updated for AJAX
Now that we’ve looked at the AJAX changes we will be adding, let’s look at what other changes need to be made to build an AJAX version of the viewer. The first step is to break the Standard.php file into three different files. The first 34 lines of the file are pulled out into a file called AjaxSetup.php. This allows the basic setup code and form value loading to be easily done in multiple files. Lines 71–101 of Listing 10-8 are also pulled out into their own file, AjaxTable.php. At the top of this new file, we require AjaxSetup.php, giving it access to the same variables that were used while the code was still in one file. This file now contains the code used to create the data table section. Finishing up the sectioning, Standard.php is renamed to Ajax.php so that we can compare the two versions, and the removed code is added back into the page using the require function so that the initial page generation happens in the same way. Neither the backend class nor the Graph.php script needs to change. Listing 10-10 shows the updated AJAX code.

The AjaxSetup.php file contains the first 34 lines of Standard.php. Because it’s in a standalone file, it can be used in both Ajax.php and AjaxTable.php, performing the setup duties for each of them. The AjaxTable.php file will generate the table data and is shown in Listing 10-7, while Ajax.php, shown in Listing 10-1, will be the main entry point for the viewer, creating the main UI and the AJAX code for controlling the viewer.

AjaxTable.php contains lines 71–101 of Standard.php (see Listing 10-13). The only change to this code is the addition of the require_once of AjaxSetup.php, at the top. This allows AjaxTable.php to be called directly. Because we use require_once to include AjaxSetup.php, it will be included only once during a page load. This lets Ajax.php require AjaxSetup.php and AjaxTable.php without worrying about the setup code running multiple times.

In comparison to Standard.php, the setup for this page has changed quite a bit. All the PHP setup is now handled in AjaxSetup.php, and on the HTML side, we’re now including a couple of JavaScript libraries. On line 3, we include the AjaxSetup.php file, and we use the require_once function to make sure the file gets pulled in only one time. On lines 8–11, we include the scriptaculous library; this library will be used for a number of visual effects. The setup completes on lines 12–13, including the HTML_AJAX JavaScript library. The PHP script, Server.php, is identical to the one shown in Listing 9-1.
Listing 10-13. Ajax.php Continued


Lines 15–94 contain the JavaScript needed for the viewer. Its different components have already been explained; they provide AJAX loading of page sections and various feedback effects. Line 16 defines the cities hash; it is used to see if the selected cities to view have changed. Lines 18–65 define the updatePage function; this function is called by the onsubmit handler on the form and takes that form as its parameter. Line 19 processes the form into a query string. Then, lines 21–32 check whether any of the cities have changed and reload the graph as needed. Lines 34–54 set up the AJAX call and then make the call to update the data table. In this area, lines 36–39 set up the callback, lines 41–50 define the feedback options, and lines 53–54 make the AJAX request using HTML_AJAX.grab. The updatePage function finishes by updating the bookmark link (lines 57–62). Lines 68–75 define the updateCurrentCities function, which populates the cities hash. The JavaScript section finishes with the startLoad function on lines 78–93, which handles creating and showing the graph-loading message.
Listing 10-14. Ajax.php Continued
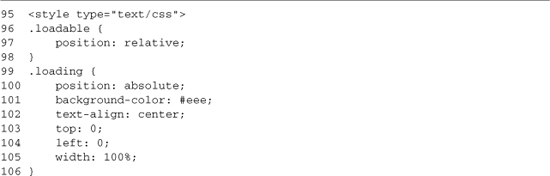

Lines 95–110 (Listing 10-14) contain some CSS rules that style the elements used in the loading effects. The .loadable rule on lines 96–98 is applied to the container outside the element that will be loaded; making its position relative allows it to be the parent element for the absolutely positioned loading DIV. Lines 99–106 contain the rules for the loading DIV; they position it absolutely to cover the entire graph and give it a gray background. The CSS rules finish up with a rule (lines 109–110) that floats the table to the left. This rule is needed to keep the highlight effect from bleeding out onto the rest of the page, and it is needed only because we’re using floats on other parts of the page.
Listing 10-15. Ajax.php Continued


Little has changed in the rest of the document when compared to the non-AJAX version. Line 112 contains an onload call to updateCurrentCities; this populates which cities are selected at the time of the page load. The graph output on lines 115–123 also has a number of changes from the standard version. The graph now has an ID so that its src value can be changed later, and its container div has the loadable class applied to it. Finishing up the graph code is a call to startLoad to pass in the graph; this provides a loading message on the initial page load.
Lines 125–153 contain the form code; the form contains several small changes. The form definition now contains an ID and an onsubmit property that calls pageUpdate (lines 125–126). It also has a bookmark link added to it (lines 151–152). On page load, this link is the same value as the form submit and is updated by the pageUpdate JavaScript function as AJAX requests are made. Finishing up the document, we include AjaxTable.php, which renders the data table.
10.5 Summary
In this chapter’s use case, we looked at how you can use the subpage AJAX pattern to improve the performance of displaying data. This AJAX pattern breaks up large pages and lets you update one section of the page at a time. It can greatly improve the user experience by increasing the efficiency of the site and reducing the time users spend waiting for content to load. This pattern will be used over and over in your AJAX implementations, because it represents basic AJAX functionality, updating one part of a page without affecting the rest. The major points we can take from experience are as follows:
• Browsers handle slow-loading images poorly.
• JavaScript can be used to add nice image-loading effects.
• Sectioning pages can reduce overall loading times by allowing fast-loading content to be updated without affecting slow-loading content.
• Loading page sections with AJAX is a reusable pattern that is useful in many situations.
In the next use case, we will reuse much of what we learned here; however, instead of focusing on improving performance, we will look at how you use AJAX to add new features without a major application redesign.