
Chapter 3. Organizing and Annotating Diagrams
In this chapter, you learn about some of Visio 2010’s new structured drawing features—Containers, Lists, and Callouts—that take organization and annotation beyond just text and lines on the page. This chapter also describes groups, layers, and markup and review features, which offer even more possibilities.
Incorporating hierarchies, groupings, and classifications into your diagrams makes them easier to create, understand, and update. Because many documents are continually evolving and in need of updating, you need tools to help you annotate and comment on drawings as they change with your business.
Containers and Lists
There are many cases in which you need to visually associate shapes that are logically related. It is easy to draw a box around items and then label them with a text block, but Visio offers a better way.
Visio 2010’s new Container and List shapes make organizing sets of shapes a snap. Shapes can be easily added and removed from them, and all member shapes conveniently move along with their parent containers.
Let’s look at how containers and lists can add structure and organization to your diagrams.
Containers
Containers are special shapes designed to visually group other shapes together and to make it easy for you to maintain these relationships. Container shapes consist of a rectangular region where member shapes are contained, plus a title area called a header.
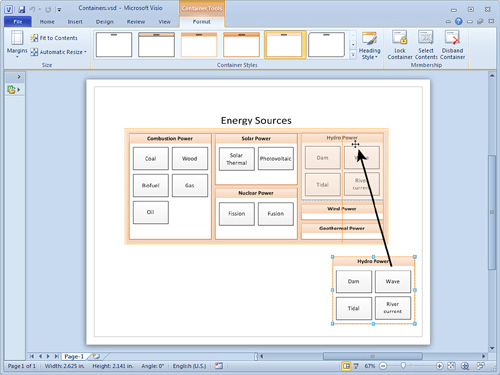
You’ve already seen containers in action in the “Energy Sources” block diagram that appeared in Chapter 1, “Introducing Visio 2010.” Figure 3.1 shows it under construction.
Figure 3.1. The Hydro Power container contains member shapes lower in the hierarchy. It is being dragged into the main Energy Sources container, showing that containers can contain other containers, as well as regular shapes.
Show Me: Media 3.1—Organizing Shapes with Containers
![]()
Access this video file through your registered Web Edition at my.safaribooksonline.com/9780132182683/media.
![]() LET ME TRY IT
LET ME TRY IT
Organizing Shapes with Containers
Although containers are shapes, they’re so cool and important that you don’t access them from a stencil. Instead, they are built right into the user interface on the Insert tab. Let’s look at adding shapes to and removing them from containers.
- Start a new drawing from any template, such as the Basic Network Diagram.
- On the Insert tab, expand the Container gallery in the Diagram Parts group.
- Select a container item from the gallery. You should see a new container shape in the middle of your page.
- Drag shapes from any stencil and drop them on top of the container. Notice the orange highlighting as you drag a shape over the container. This highlighting tells you that the shape will be added to the container.
- Click on a shape in the container. Notice that it is easily accessible and not “buried” inside the container as grouping does (discussed later in this chapter). Also notice that the container is highlighted with a thin, orange outline. This tells you which container contains the selected shape.
- Select the container shape. Note that if you click in the middle of the container, you are not able to select it. This is so that you can select member shapes without accidentally moving the container itself. To select the container, you need to click on the very edge or on the header. You see the mouse cursor changes to crosshairs when you are over a selectable part of the container.
- Move the container by dragging it around the page. See how all the member shapes follow the container?
- Make the container bigger or smaller by pulling on any of the eight blue resizing handles. Notice that you can’t make the container smaller than its member shapes.
- Drag a shape out of the container so that it is in a blank area of the page. This shape no longer moves with the container. Removing a shape from a container is that easy.
- Duplicate the container several times. You can do this quickly by Ctrl+dragging. Or try selecting a container and then pressing Ctrl+D to duplicate it. No matter how you copy a container, all the member shapes are duplicated along with it; you don’t need to select the member shapes at all.
- Now delete one of the duplicate containers. All the member shapes are deleted along with the container. This is very convenient but might be unexpected the first few times you do it.
- Right-click a container and notice the Container menu item. This contains many container-specific actions, which are also available on the contextual Container Tools tab in the Ribbon.
- Expand the Container menu to see its subitems; then choose Disband Container. The container is deleted, but this time, the member shapes are not deleted. This is handy if you want to get rid of the container, but keep the members.
- Select the shapes that remain from the container that you disbanded in the previous step.
- On the Insert tab, select a new container from the Container gallery. A new container is placed behind the select shapes, effectively “slipping a new container under” the selected shapes.
![]() LET ME TRY IT
LET ME TRY IT
Changing an Existing Container
In Figure 3.1, you might have noticed the Container Tools contextual Ribbon tab. This tab is available when you have one or more container shapes selected or when shapes that belong to containers are selected. You might also have noticed the Containers context menu that appears when you right-click a container.
Let’s explore some things you can do to existing container shapes.
- Start with any drawing that has a container that contains a few shapes.
- Select the container; then click the Format tab under the Container Tools contextual tab.
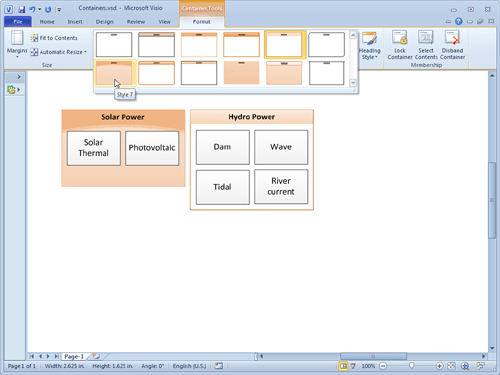
- In the Container Styles gallery, click a new style. As you move your mouse cursor over the various styles in the gallery, notice how Live Preview shows the way your container will look, as depicted in Figure 3.2. Click a new style to change the look of your container in-place.
Figure 3.2. You can change containers on the fly, in place. No need to delete the container, add a new style, and then re-add member shapes.
- Similarly, you can change the look of the container’s heading by browsing the Heading Style gallery to the right of the Container Styles gallery.
- Resize your container so that there is lots of extra space, beyond what the member shapes require.
- Click the Fit to Contents button in the Size group on the Container Tools tab. The extra space in the container disappears, and the container neatly and tightly encloses its members.
- Click the Margins drop-down to the left of Fit to Size. Mouse over the various items in the list. Notice how the padding, or margins, of the container increase and decrease. If you drag member shapes near the edges of the container, orange lines will appear to help you align shapes to the margins of the container.
- With the container selected, click the Lock Container button in the Membership group. Now try to remove member shapes from the container by dragging or deleting them. You can’t do it. If you try to move a shape off the container, the container just gets bigger and keeps the shape within its boundaries. You can click the Lock Container button again to unlock the container.
- From the Automatic Resize drop-down, choose Always Fit to Contents.
- Move the container’s member shapes around. Notice how the container expands and contracts to accommodate the shapes. If you unlock the container, this behavior will change slightly because you will be able to remove member shapes from the container.
With Always Fit to Contents, expanding the container is a bit tricky. If you move a member shape too far, then it will jump out of the container. If you move it partially off the edge of the container, then the container will expand. A neat trick is to select a member shape and then move it by pressing the arrow keys. The container will keep expanding as you move the shape towards the edge, but the shape won’t jump out of the container.
Containers are powerful, useful, easy to use, and fun! It is important to note that they are not just boxes with text: they are structured drawing elements understood by Visio as more than just graphics. This has implications when it comes to validating diagrams against corporate standards and when programming custom solutions on top of Visio. Diagram validation is a feature available in Visio 2010, Premium edition; building custom solutions is touched on in Chapter 11, “Developing Custom Visio Solutions.”
Lists
Lists are special container shapes that keep members stacked together in a single column or row. What’s great about lists is that you can drag member shapes up or down in the order, and the other shapes automatically rearrange themselves in the list.
Lists don’t have their own gallery, like containers, and there aren’t a lot of list shapes that come with Visio. However, if you create cross-functional flowcharts, or swimlanes, you will run into lists.
Lists in Cross-Functional Flowcharts
Figures 3.3, 3.4, 3.5, and 3.6 illustrate how lists are used to manage the swimlanes in a cross-functional flowchart.
Figure 3.3. Inserting a new swimlane into a cross-functional flowchart. When the mouse is between list items, a blue arrow and orange highlight show where a new list item can be inserted.
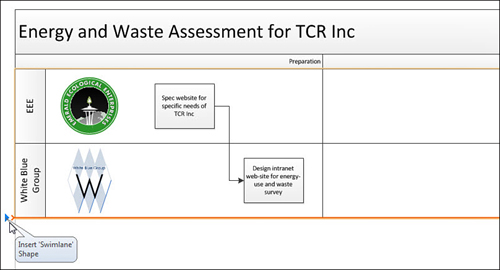
Figure 3.4. After the insert arrow is clicked, a new lane is added to the process. The text for the lane can be immediately edited.
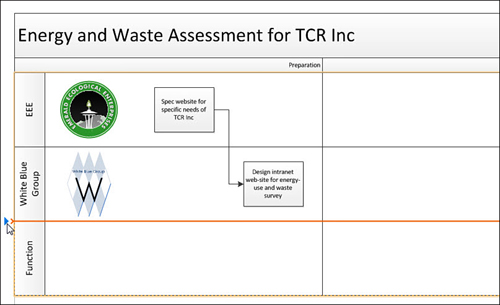
Figure 3.5. Dragging a lane up to a higher position. Highlighting shows where the lane will be inserted.
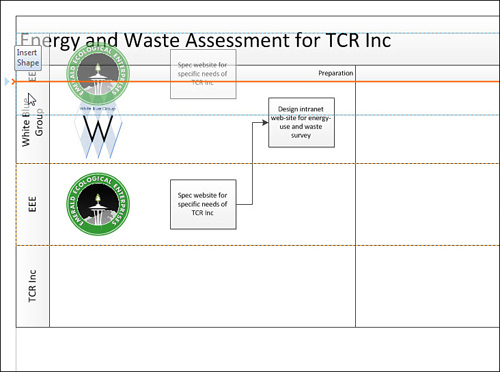
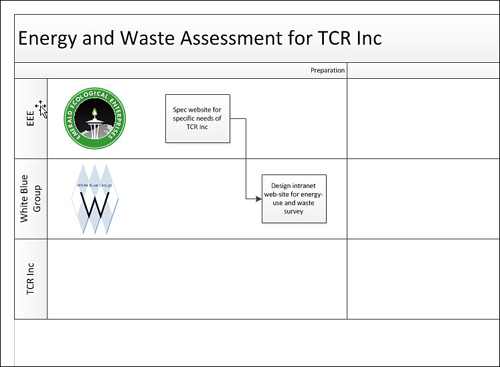
Figure 3.6. The EEE lane is inserted above the White Blue Group lane. Notice that the shapes moved with their respective lanes, and the connector remained intact.
In Figure 3.3, a new swimlane needs to be added to hold steps that apply to TCR Inc. The figure shows how lists have a nifty “insert” feature. For vertical lists, a horizontal blue arrow and an orange line appear where a new item will be inserted.
Clicking the blue arrow adds the new lane, which appears in Figure 3.4. You might not see the colors in this book, so I encourage you to start a new Flowchart, Cross-Functional Flowchart drawing and experiment with inserting swimlanes.
Because Emerald Ecological Enterprises is the main contractor, its swimlane needs to be moved to the top of the process. You can simply grab the lane header and drag it to the top. Figure 3.5 shows a similar blue arrow and orange line showing where the shape will be inserted when you release the mouse button.
Figure 3.6 shows the final, rearranged swimlane. The items in the swimlane list are rearranged, and kept tightly together. You don’t need to fiddle around with moving shapes apart, then pushing them back together.
Lists in Wireframe Diagrams
If you have Visio Pro or Premium, you have the Wireframe Diagram template, located in the Software and Database template group. This template enables you to create user-interface mockups.
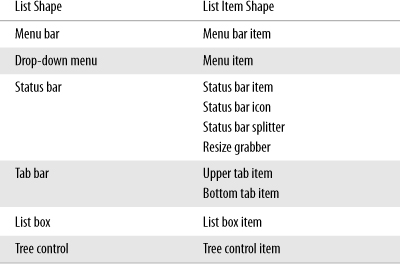
The stencils that open with this template contain a few list shapes that you might want to experiment with. These lists are designed to contain only certain list members. If you drag shapes from the stencil to a list, only certain list item shapes can be added to the list container shapes. Table 3.1 shows the pairings.
Table 3.1. Wireframe List Shapes and List Member Shapes
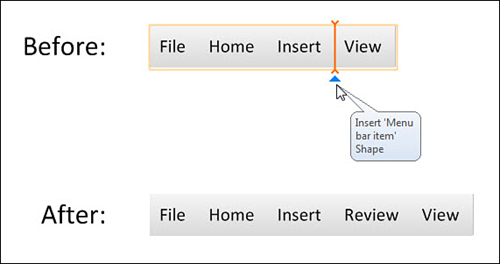
But lists have the insert arrow feature, so you don’t have to drag and drop in the first place. Just move your mouse until you see an insertion highlight. Figure 3.7 shows the Menu bar shape, with several menu bar items. You can see that the menu bar is a horizontal list, and that the insert highlighting is rotated at 90 degrees to what you saw earlier in the vertical swimlane list.
Figure 3.7. Inserting items in a horizontal list.
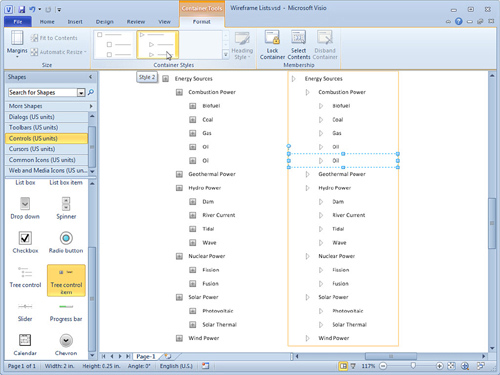
Wireframe shapes are intended for window, form, and web page design and are meant to be combined with other UI elements to build up a design. Hence, the wireframe list shapes don’t have headers like containers do, because the headers would muddy the design. Without headers, though, it can be hard to find the list containers when you’re working on a diagram. Figure 3.8 shows two Tree control lists full of Tree control items. You can see that when a list item is selected (in the right half of the figure) the list container is also highlighted with a thin, orange line. Click on the orange line to select the actual list shape.
You also see the familiar Container Tools contextual tab when you select a list or a list item shape. See how the Container Styles choices are slightly different for Tree control shapes? The two trees in Figure 3.8 show the different bullet styles shown in the Container Styles gallery.
Figure 3.8. The list container is hard to see until a member is selected. Note the Container Tools contextual tab also shows up for lists.
Groups
Another way to keep related shapes together is to group them. Containers and lists are brand new in Visio 2010, but groups have been around since Visio’s inception.
In Visio any two or more shapes can be grouped together. As your Visio experience grows, you will see that groups come in two flavors:
- Assemblies of premade or finished shapes grouped together. Think of a set of office furniture shapes grouped together to represent a standard cubicle configuration.
- Elemental graphical bits grouped together to form a single shape. Think of any network PC shape. There is a thick outline, a screen, a bezel, a keyboard, and some shading. These are all separate shapes, grouped together to form a single symbol.
Groups are useful and have their place, but they also cause some problems. When shapes are grouped together, they get buried inside a group shell, which hides data, makes formatting awkward, and can be confusing to users.
In fact, the shortcomings of groups provided impetus for the invention of containers and lists. Nevertheless, you should understand how groups work in Visio, and how to recognize them, as well as how and why to use them.
Show Me: Media 3.2—Creating Grouped Shapes
![]()
Access this video file through your registered Web Edition at my.safaribooksonline.com/9780132182683/media.
![]() LET ME TRY IT
LET ME TRY IT
Creating a Grouped Shape
- Create a new drawing from any template.
- Drop three shapes on a page.
- Select all three shapes.
- In the Arrange group on the Home tab, click the Group drop-down and select Group.
- Move the group. Note that all the subshapes move with the group. That’s the point of grouping!
- With the group still selected, choose a new fill color either from the Home tab or by right-clicking. Note that all the subshapes are colored. This is a potential drawback of groups.
- Type some text while the group is selected. Notice that the text goes to the group, not to any of the subshapes.
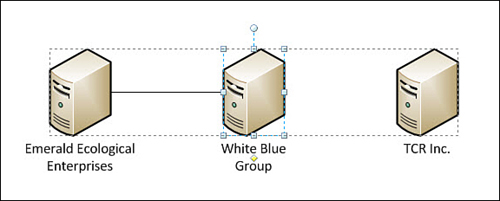
- Move one of the subshapes. To do this, you need to subselect a shape. First, click the group, pause for a second, and then click on one of the subshapes. You should see lighter-blue selection handles around the subshape and a dashed line around the entire group, as shown in Figure 3.9. You can now move the subshape within the group.
Figure 3.9. Three network shapes grouped together, with the White Blue Group server subselected. Subselected shapes have lighter-colored handles, and a dashed line shows the parent group.
- Reselect the group. To do this, first deselect everything by clicking on a blank area of the page or pressing the Esc key. Then click once on the group to reselect it.
- Ungroup the shape. In the Arrange group on the Home tab, click the Group drop-down and then select Ungroup. You now have four shapes. Of course, you get your original three shapes back, but you also have one more “clear” shape that holds the text that you typed on the group.
Tell Me More: Media 3.3—When to Use Groups
![]()
Access this audio file through your registered Web Edition at my.safaribooksonline.com/9780132182683/media.
When to Use Groups
You should use groups in the following scenarios:
• For creating a single shape. If you are creating a shape that will be used as a single graphic, and users don’t need to have access to its innards, grouping is appropriate. If your shape needs to have multiple text blocks, or details with different fill and line colors, you have to group separate pieces together.
• For temporary movement or arrangement. Perhaps you need to align a set of shapes with another set, while maintaining spacing within the set. You can quickly group your shapes together, move them around, align them, and ungroup them.
• For planned ungrouping. An example could be an office plan where you have several standard arrangements of furniture. These arrangements could be stored as grouped units on a “library” page. Users could copy an arrangement to the floorplan page for placement in an office and then ungroup to get the individual equipment and furniture items.
You could even store such assemblies in stencils as masters and ungroup them after dropping them into a drawing. But Visio presents a warning when you ungroup masters, which can be unpleasant for users.
When Not to Use Groups
You might not want to use groups in the following scenarios:
• For creating categorical relationships. For example, you want to show which servers are in North America and which are in Asia on a network diagram. This is a good application for containers, not groups.
• If your shapes have Shape Data fields that need to be readily edited by users of your diagram. Grouping buries data fields and forces users to subselect to get at the data.
• If your shapes have other custom features such as right-click actions or control handles that users will need to manipulate. Grouping buries these features as well.
• If you expect that users of your diagram won’t understand groups and subselecting subshapes.
If you are creating shapes for others to use, they might not know about subselecting within groups and might find it awkward. If you don’t mind subselecting and are the only user of your shapes, then these caveats take on less importance.
Editing Inside a Group
If you want to change the look of a grouped shape, especially one that came from a stencil, you should add graphics inside the group. Many beginners try to ungroup a shape, add graphics, and then regroup the shape. This approach works for groups of shapes that have been temporarily grouped together, but not for custom shapes that may have special behaviors.
For example, the Server shape from the Network and Peripherals stencil is a grouped shape that has 22 Shape Data fields. It also has a special control handle that enables you to reposition its text block easily.
If you ungroup the Server shape, you destroy the text/control handle behavior and obliterate the shape data fields. Regrouping doesn’t bring them back.
Editing Inside of a Group
- Start a new drawing from the Basic Network Diagram template.
- Drop a Server shape on the page.
- With the Server selected, right-click it and choose Group, Open Server. Because every shape on the page has a different name, you might see something like Open Server.5 or Open Server.19.
- A new window opens showing just the innards of the Server shape. You are inside the group, in a group editing window. Notice that the caption atop the Visio window has the text “<GROUP>” to remind you that you are inside a grouped shape.
- From the Home tab, select the Rectangle or Ellipse tool and draw a shape or two on top of the server.
- Close the group editing window by clicking the X (or “Close window” button) in the top-right corner of the window. Make sure you don’t accidentally close the Visio application window!
- You should now see your modified server from the “outside,” with your additions safely inside the group.
If you like the idea of adding icons to server shapes, be sure to check out my “Visio Network Server Shape Icon Customization Tool” at http://www.visguy.com/2009/09/11/visio-server-shape-icon-customization-tool/. It uses a VBA macro to automatically perform steps 1-7 at the click of a button!
Callouts
Callouts are blocks of text linked to a graphic via a line or other pointing visual. They are used to annotate diagrams without interrupting the flow of the main visual. A classic callout is the word balloon that you see in comics to indicate speech. You also see them in product brochures, discreetly pointing out essential features of a fancy new gadget but not distracting from the glossy visuals.
Using Visio 2010’s New Callouts
In Visio, callouts can be used in innumerable ways to annotate diagrams. In Visio 2010, callouts have been upgraded significantly. They are now part of the structured diagramming features along with containers and lists and are fully integrated into the user interface.
Show Me: Media 3.4—Adding Callouts to Shapes
![]()
Access this video file through your registered Web Edition at my.safaribooksonline.com/9780132182683/media.
![]() LET ME TRY IT
LET ME TRY IT
Adding Callouts to Shapes
- Starting with any drawing, make sure one shape is selected. This shape will be the target of the callout.
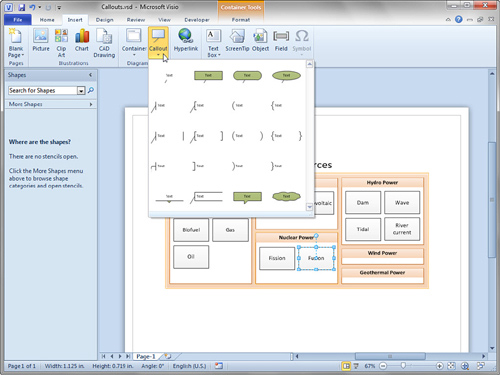
- In the Diagram Parts group on the Insert tab, drop down the Callouts gallery. You should see 20 or so callouts, similar to what is shown in Figure 3.10.
Figure 3.10. The Callouts gallery.
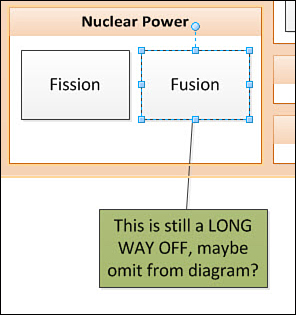
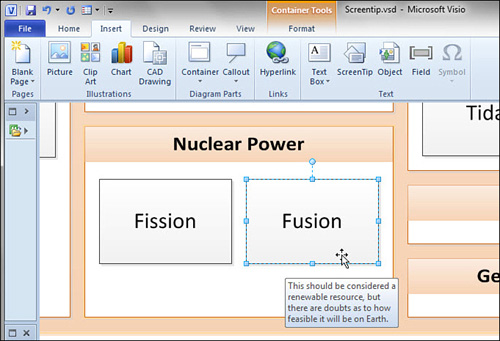
- Choose one of the callouts to apply to your target shape. You can now move the callout around and type text into it, as shown in Figure 3.11. If you move the target shape, the callout follows along.
Figure 3.11. A callout applied to the Fusion shape.
- When you select the callout, the target shape is highlighted with a thin orange outline. This highlight is especially helpful for callouts that don’t have a leader line because you can still tell which shape owns the callout.
- Duplicate the target shape (not the callout) by Ctrl+dragging or pressing Ctrl+D. You should see that the callout is duplicated along with the target, as shown in Figure 3.12.
Figure 3.12. When callout-target shapes are duplicated, callouts come along for the ride.
- You can change the style of the callout by right-clicking it and expanding the Callout Style cascading menu. There, you see the same 20 styles shown in the Callout gallery in step 2.
- Note there are three more callout-specific menus below Callout Style: Orientation, Callout Line, and Resize with Text. Take some time to experiment with these functions.
- Select the callout and notice the yellow control handle at the end of the leader line, in the middle of the target shape.
- Move the control handle so that it is over a blank area on the page. You have now disconnected the callout from its target.
- You can use this handle to change the callout’s target shape. Drag the control handle so that it is over a different shape. Notice that as you do this, the new target is highlighted with an orange outline, indicating that it will receive the callout and become its target.
- Move the new target shape and notice that the callout is now attached.
Using Legacy Callout Shapes
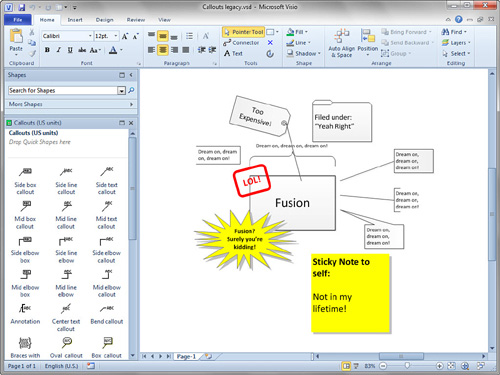
Visio callouts have been around for a long time, but they were much less sophisticated before Visio 2010. Visio treated them as ordinary shapes and didn’t provide any of the special callout behavior we’ve just seen. You were responsible for moving them and duplicating them manually. Nevertheless, these old-style callouts are useful, and you might appreciate the variety. You can find them in the More Shapes menu, under Visio Extras, Callouts. Figure 3.13 shows a wild sampling from the Callouts stencil.
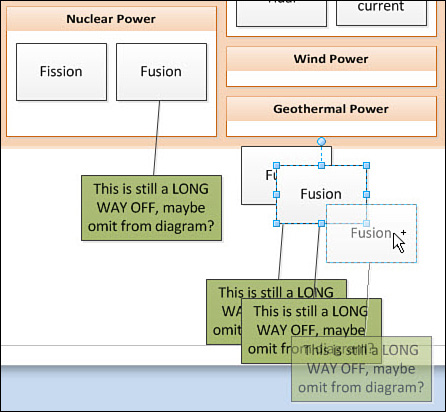
Figure 3.13. The poor “Fusion” shape being picked on by legacy callout shapes from the Callouts stencil.
Many of the old callout shapes are 1D shapes, which means you position each end independently, like you do with lines and arrows and connectors. You can glue callout ends to connection points on target shapes and to guides. (Guides can be pulled out of the rulers. They don’t print, and you can glue shapes to them.)
The practical result is that the leader line stays glued to the target, and the text end stays put, which is sometimes exactly what you want a callout to do. Figure 3.14 shows old style callouts arranged in two columns. Each callout has one end glued to a target, the other end glued to a guide.
Figure 3.14. Only the glued end of legacy callout shapes move with shapes, which can sometimes be advantageous.
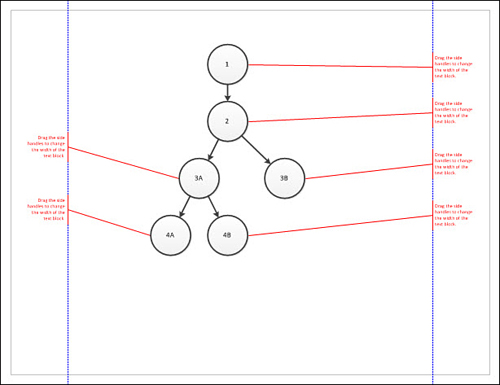
The text remains near the page edges, but the leader lines move with the target shapes. And since the text ends are glued to the guides, each column can be easily repositioned by moving a single guide. Older technology, but still quite useful!
Show Me: Media 3.5 Cool Tricks with Legacy Callout Shapes
![]()
Access this video file through your registered Web Edition at my.safaribooksonline.com/9780132182683/media.
ScreenTips on Shapes
Visio ScreenTips offer a simple and clandestine way to add comments to your shapes. ScreenTips are just like ToolTips that you see everywhere in Windows when your mouse stops moving over some bit of the user interface.
If you hover over a Visio shape that has a ScreenTip, a little window pops up, displaying informational text for your enlightenment. Figure 3.15 shows one of these exciting ScreenTips in action.
Figure 3.15. A ScreenTip pops up when the mouse cursor hovers over a shape. Note there is no visual cue to indicate that a shape has a ScreenTip.
ScreenTips are intended as a shape designer feature—a vehicle for communicating to users how to use the shape, or what it is for. The theory is that a forlorn user will pause in confusion over a shape, and your ScreenTip will pop up and enlighten him or her!
However, there’s no reason they can’t be used to enhance your diagrams creatively in a nondistracting way. The only drawback is that there is no visual clue that a shape has a ScreenTip in the first place—you have to pause over a shape to find out whether it has one.
Adding ScreenTips to Shapes
Adding a ScreenTip to a shape couldn’t be easier. Just select a shape and then go to the Insert tab. In the Text group, click ScreenTip; then enter your message in the dialog that appears.
Adding a ScreenTip to a Shape
- Select a shape in any drawing.
- In the Text group on the Insert tab, click ScreenTip. You can see this Ribbon and button in Figure 3.15.
- In the pop-up dialog that appears, type a message and then click OK.
- Hover your mouse cursor over the shape. You should see your ScreenTip display after a second or two. Note that the shape need not be selected to show the tip.
Strategies for Using ScreenTips
ScreenTips are great because they add value to your drawing without unnecessarily cluttering it. However, they don’t print and there is no visual cue that a shape even has a tip.
If you are thinking about incorporating ScreenTips into your work, consider the following suggestions to make them more discoverable and usable:
• Get in the habit of hovering over every single shape (no, I’m not serious!).
• Always append an asterisk (*) to the text of shapes that have ScreenTips.
• Add ScreenTips only to dedicated “ScreenTip shapes.” For example, you could use small, brightly colored circles that have no text. Users easily see these circles, but your drawing isn’t cluttered by the full text of the tip.
• Use a Callout shape as a “ScreenTip Shape.” Give it no text and make the word bubble as small as possible. The tip moves along with its target shape, the user sees a small circle or square that indicates a tip, but the tip’s full text doesn’t clutter the drawing.
• Use dedicated ScreenTip shapes, but assign them to a nonprinting layer (discussed in the “Layers” section later in this chapter) so that they don’t show up in printed output.
• Use the Comment feature from the Review tab (discussed in the “Markup & Review” section of this chapter). Review comments are visible to the user in a collapsed form but don’t print.
ScreenTip text wraps automatically, but you might want to force a new line manually, say for a title or for some tabular information. The ScreenTip editing box doesn’t accept the Return key by default, but if you hold down the Ctrl key while pressing Return, you can insert new lines as you like.
Headers and Footers
You’ve just seen that ScreenTips are visible only when you are editing. But sometimes you need information to appear only when printing. That’s where headers and footers come in.
Word and Excel users already know that a header is a line of text that appears at the top of each printed page; a footer appears at the bottom. They are typically used to hold information such as filename, document title, or page number—information that is obvious when you are working in Visio, but not when you are holding the hard copy in your hand.
Visio provides three fixed information areas each for headers and footers. Providing a grand total of six possible fields.
You add headers and footers from the Print Preview tab of the Ribbon, which you can get to via File, Print, Print Preview. Clicking Header & Footer opens the dialog shown in Figure 3.16. Note the two columns of three fields in which you can enter information.
Figure 3.16. The Header and Footer dialog, with Print Preview in the background. Notice the combination of free-form text and field codes used to build this document’s three-part header.
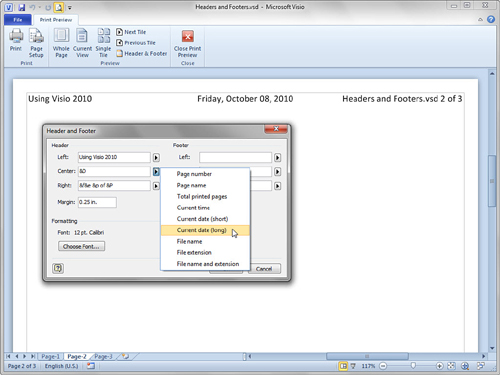
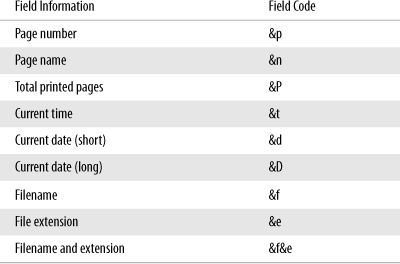
You can enter any text you want into each box, and you can also add field codes for dynamic information. Field codes are used for information that might change, such as the filename and date, or information that varies from page to page, such as number or name. Visio has a small set of field codes, but even so, you don’t have to memorize them. The arrows to the right of each text box in the Header and Foorter dialog help you to insert them. Table 3.2 summarizes the available field codes for headers and footers.
Table 3.2. Field Codes for Headers and Footers
You can mix text and field codes to make more readable headers. One of the most common combinations is &p plus &P which shows which page you are on, out of the number of pages in the document. Here are a few ways you might mix codes with text:
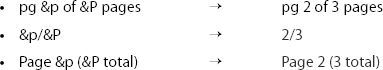
Remember that headers and footers appear on every page in a document, but they don’t show on the drawing page when you are working on your diagram. You only see them in Print Preview, on printed documents, and documents exported as PDF or XPS files.
Headers and footers print over drawing page content. For this reason, if you have graphics close to the top or bottom of the page, be aware that headers and footers might obscure them when you print.
Inserting Fields into Shape Text
Text on Visio shapes can be linked to dynamic information as well. Using the Field button on the Insert tab, you can add dynamic fields to a shape’s text block.
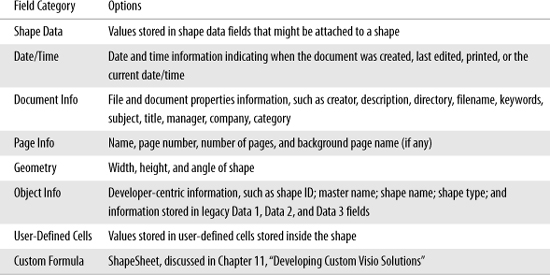
When you click the Field button, a dialog pops up offering several categories of information that can be inserted, as shown in Table 3.3. The array of choices puts the field codes in the Header & Footer dialog to shame.
Table 3.3. Insert Field Categories for Smartening Shape Text
Inserting Text Fields in Shape Text
- Start a new, blank drawing.
- Using the Rectangle tool from the Tools group on the Home tab, draw a rectangle on the page.
- With the rectangle still selected, type the text I am SO big by SO wide.
- Now replace the “SO” text with the actual width and height of the shape.
- If you have deselected the shape, click the Text tool in the Tools group on the Home tab, then click your shape. You can also double-click the shape or just press F2 to get into text edit mode.
- Use the mouse to select the first “SO”. These characters will be replaced with a field.
- On the Insert tab, click the Field button in the Text group.
- Select the Geometry category from the list on the left.
- Click Width in the Field Name column on the right.
- Click the Data Format button if you would like to change the number format. For instance, you can show or hide the measurement units for the field and change the number of decimals displayed.
- Click OK until all dialogs are closed. When you stretch and shrink your shape, the field should update with the actual width of the shape. Check the status bar in the lower-left corner to compare the width values.
- Repeat steps 6–11, but replace the second “SO” with the height. When you resize your shape, both the width and the height should update in the shape’s text.
Inserted fields are indeed powerful, and the information that you can display has much more variety than that of headers and footers.
Using Shapes with Preconfigured Fields
The Title Blocks stencil, located under Visio Extras in the More Shapes menu, contains many shapes that have preconfigured text fields. You can find shapes with preinserted information such as Date, Description, Drawn by, Filename, File+path, Page number, Revised date/time, Drawing scale, and Drawing title. A real timesaver indeed!
Furthermore, these shapes have a nice feature that enables you to position the field label either above the value or to the left. Just right-click the shape, as shown in Figure 3.17.
Figure 3.17. Building a quick title block with shapes preconfigured with dynamic text information.

Layers
You can add organization to your Visio documents by using layers to categorize shapes. A layer is a named category to which any number of shapes can be assigned.
Layers help you do things to entire categories of shapes at the click of a button. For example, you can
• Hide and show shapes
• Lock shapes from being moved, edited, and selected
• Temporarily color shapes to emphasize (and find) them
• Set shapes so that they print or not
• Quickly select all shapes belonging to a particular layer
The neat thing about layers is that unlike callouts and containers, they don’t have to visually impact your diagram at all. You can assign shapes to layers, use layer operations when you need them, and then return things to their original state.
Basic Layer Skills
As with most things Visio, it is easier to describe layers after you’ve created and manipulated a few yourself. So let’s start by creating some layers and assigning shapes to them.
![]() LET ME TRY IT
LET ME TRY IT
Creating Layers
- Start with a new, blank drawing.
- Using the Rectangle tool, draw several rectangles; then use the Ellipse tool to draw several circles.
- Apply a theme to the drawing to make it more interesting. In the Design tab, click the second theme in the theme gallery (Basic Colors, Basic Shadow Effects). Your shapes should now have a slight gray gradient fill.
- Switch back to the Pointer tool and then select all the rectangles.
- Go to the Layers drop-down in the Editing group on the Home tab.
- Click Assign to Layer in the drop-down list. Next, you will assign the rectangles to a new layer.
- In the Layer dialog, the New Layer should pop up automatically because you have no layers in this drawing.
- Enter the name Rectangular things and then click OK. In the Layer dialog, Rectangular things should now be checked, indicating the shapes will be assigned to that layer. Click OK again to exit.
- Now select just the circle shapes.
- Click the Assign to Layer button again. The Layer dialog pops up.
- Click the New button to define a new layer; then enter Circular things in the text field. Click OK twice to get back to your drawing.
You should now have a bunch of shapes assigned to one of two layers: Rectangular things or Circular things. Hold on to this document; we’ll take the layers for a spin in the next exercise.
![]() LET ME TRY IT
LET ME TRY IT
Manipulating Layers
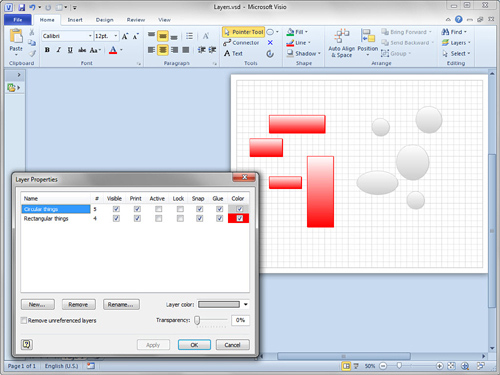
- Open the Layer Properties dialog by choosing Home, Editing, Layers, Layer Properties. You should see the dialog shown in Figure 3.18, which lets you control all the layers for a page.
- Note the two layers you created earlier and the different columns. The # column shows the number of shapes assigned to each layer.
- Uncheck Visible for one of the layers; then click Apply. The shapes on that layer should disappear. Apply lets you test settings without leaving the dialog, whereas OK makes the changes and then exits the dialog. Recheck Visible to bring them back.
- Check Color for one of the layers; then select a color from the Layer Color drop-down list in the lower-right of the form. Click Apply, and the shapes on the corresponding layer should now be colored.
Figure 3.18 shows what happens when layers are colored. This coloring is actually overlaid on your shapes. The formatting of the shapes themselves has not actually changed. When you uncheck the color boxes, your original formatting returns.
Figure 3.18. The Layer Properties dialog. Note the shape counts for each layer in the # column. Also, each layer has been assigned a color, which can be seen on the drawing page in the background.
- Check Lock for both layers; then click OK. The Layer Properties dialog disappears, and you return to the drawing. Note that you can’t move any of the shapes on the page, because you locked the layers to which they are assigned.
- Return to the Layer Properties dialog, remove all coloring, unlock all the layers, and return all layers to the visible state. Your shapes return to their natural state, unfettered by layer settings.
- You can easily select all members of a particular layer. To do this, choose Home, Editing, Select, Select by Type.
- In the dialog, click the Layer radio button and then check Rectangular Things. When you click OK, all the shapes on the Rectangular things layer should be selected. This is a really handy feature for complex drawings and just by itself is a good reason to assign shapes to layers!
Practical Application of Layers
You can see that layers offer an easy and flexible way to perform category-specific operations on shapes.
Locking shapes is a great way to protect parts of a drawing from accidentally being edited while you are working on other details. A great example of this is locking down the walls, windows, and doors of an office plan while you’re working on furniture arrangements. Just as in real-life, these features are mostly immobile, whereas furniture can be rearranged more easily!
I like to use imported images in my drawings—often as backgrounds. Assigning the image to a layer and then locking it makes it much easier to work without continually selecting the image by accident. For more information on this topic, see the article “Importing Images as Backgrounds for Tracing” at www.visguy.com/2008/04/16/importing-images-as-backgrounds-for-tracing/.
As diagrams get more complex, making certain layers invisible can make your work a lot easier. If you are laying out furniture for an office or home plan, hiding layers for, say, switches, electrical outlets, and cabling removes a lot of clutter while you work. Visio will also be more responsive, since it has less to redraw every time you pan or zoom.
The ability to hide and show layers is also helpful if your drawing has many different audiences. The plumber, electrician, and facilities manager can all use the same drawing but you can print out different sets of layers for each of them.
With layer-coloring and select-by-layer, calling attention to and finding specific types of shapes are easy tasks. For large, complex drawings, these tools are invaluable.
If you’ve made a bunch of notes to yourself that you don’t want to share with contractors or other consumers of the diagram, you can assign your callouts and other annotations to a nonprinting layer. They are visible while you’re editing (so you don’t forget about them), but they don’t appear in the printed copies you send out into the field.
Visio Layers for Power Users
If you are excited about layers and see them as a key feature that you will be using a lot, you might be interested in a few fine points, some of which can be a bit confusing:
• Layer sets are per-page, not per-document. If you add pages to a document, you have to re-create layers on each page.
• When you copy a shape, the new copy retains its layer membership.
• If a shape is assigned to a layer and is dropped on a page that doesn’t contain that layer, the layer is added to the page. You can create “layer set” shapes to make it easy to add a standard set of layers to new pages. Just create a rectangle, assign it to every layer that you need, and then drop it onto a new page. All layers are created instantly.
• The Layer Properties dialog has an Active Layer column. If you check any active layer boxes, new shapes added to the drawing page are automatically assigned to active layers—if they don’t already belong to layers. Shapes that are already assigned to layers keep their settings.
• Shapes can belong to multiple layers; this affects behavior when you check and uncheck items in the Layer Properties dialog. Generally, it operates on a “positive logic” principle: if something is checked for any of a shape’s layers, that attribute takes hold. So if a shape belongs to two layers, and one of them is locked, the shape is locked. To hide the shape, you have to uncheck both layers’ visibility because a positive value for either layer will result in a visible shape. I generally find it easier and less confusing to limit my shapes to one layer as much as possible.
• The exception to the previous point is layer coloring. If a shape belongs to multiple layers and you want to color it via layers, all layer boxes need to be colored and assigned the same color. For this reason, I find that multiple layers and layer coloring do not mix well.
• If a shape is on a nonvisible layer, but the layer is set to print, the shape will print, even though it is invisible in Visio. This can sometimes come as a surprise. If you are a heavy layers user, get in the habit of checking Print Preview before you print.
• Many of the shapes associated with the Office Layout template are assigned to multiple layers. For instance, the Door shape is assigned to “Building Envelope” and “Door,” the Wall shape is assigned to “Building Envelope” and “Wall,” and the Oblong dining table is assigned to “Movable Furnishings” and “Furniture.”
This is great if you want to select shapes by varying degrees of specificity. You can select all doors and walls by selecting shapes on the “Building Envelope” layer, or just get the doors by selecting shapes on the “Door” layer. Cool!
However, if you want to hide shapes on these layers, you have to uncheck Visible for two layers in each case. Assigning shapes to multiple layers has its pluses and minuses.
Markup & Review
You’ve seen how callouts and ScreenTips can be used to annotate your diagrams and how layers can be used to turn details on and off.
If you have a living document for which several people need to give input, the markup and review features will be of interest, particularly comments, markup, and ink. Visio’s reviewing capabilities aren’t as powerful or fluid as Word’s, but you might still find them useful.
Comments
Comments allow multiple users to critique a document. They are similar to ScreenTips but are more noticeable, and they aren’t attached to shapes.
Comments float on the page as little yellow boxes with the initials of the commenter and an ID number. To read one, just click it and it expands to reveal its contents.
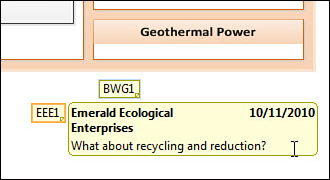
Figure 3.19 shows a diagram with comments from two different users. The comment from “BWG” is collapsed, and the comment from “EEE” is expanded so you can read the message, along with the commenter’s full name and the date it was made.
Figure 3.19. Expanded and collapsed reviewing comments.
![]() LET ME TRY IT
LET ME TRY IT
Adding Comments to Your Diagram
- On the Review tab, click New Comment in the Comments group. A little yellow box with your initials appears on the page, with an expanded area for adding text.
- Enter a message in the box. As soon as you click somewhere else on the page, the comment collapses to show just the initials.
- You can freely drag the comment box around the page and position it wherever you want.
- If you hover your mouse cursor over the comment box, the full name of the commenter appears, along with the date the comment was last updated.
Note: The name and initials of a user are set in the File, Options, General tab, in the Personalize Your Copy of Microsoft Office area. There you see text fields for User Name and Initials.
- If you click a comment box, it expands and the entire comment appears.
- Notice also that in the Markup group on the Review tab, the Show Markup button is now pressed, and the Reviewing pane is visible on the right.
- Toggle the Show Markup button on and off. Notice that your comments appear and disappear.
- Toggle the Reviewing Pane button on and off. The Reviewing pane shows and hides itself, but your comments remain as long as Show Markup is pressed.
- With Show Markup pressed, go to File, Print, Print Preview. Notice that the comments are not visible. Review comments do not print.
Be aware that comments are part of Visio’s Review features and are visible only when the Show Markup button is pressed. This is a little confusing because comments are actually different from markup, as you see in the next section.
Markup
In Visio, markup is slightly different from the comments you just explored, even though they are related by the Show Markup button and the Review tab.
Markup consists of graphics that a user adds to a page. When you click the Track Markup button (just above the Reviewing Pane button), Visio creates a special markup overlay tab for the current user on top of the page. Any edits to the drawing made while Track Markup is pressed are put on this tab and given a color that corresponds to the user. Markup is like a hybrid of pages and layers; each reviewer gets his or her own markup overlay tab, associated with a particular page and a particular reviewer.
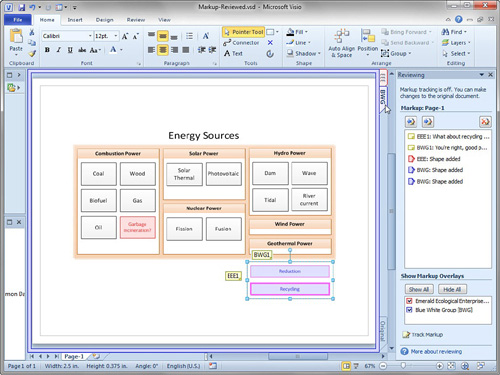
Figure 3.20 shows a familiar diagram that has been commented on and marked up by two users.
Figure 3.20. A diagram that has comments and markup from two users. Note the two markup tabs in the upper-right corner of the page.
There’s a lot going on in Figure 3.20, so let’s go over the important bits, one by one:
• In the Reviewing pane, there is a history list under “Markup Page-1.” This shows both comments and markup added, and which user made the modification. You can see that EEE and BWG have both added comments and shapes to the drawing.
• Each user has an associated color. When a user creates a shape on the page, it is shown in this color. You might not be able to see this in the printed form of this book, but user EEE is red and user BWG is blue in Figure 3.20.
• There are two tabs in the upper right corner of the drawing page, one for each user. These tabs are colored to match the red and blue of EEE and BWG, respectively.
• Along the same edge, but at the bottom, you see the Original tab. This is, of course, where the nonmarkup drawing bits can be accessed. Clicking the Page-1 tab also returns you to the regular drawing.
• Tab BWG has just been clicked. When this happens, the markup shapes from BWG are selected in the drawing page. You can see that the Reduction and Recycling boxes are selected. These boxes are also colored blue, because they were created by user BWG.
• When the BWG tab is active, only the shapes created by BWG can be selected and edited. The drawing’s shapes can’t be touched, and neither can EEE’s markup shapes.
• Notice the shape under “Combustion Power” that says “Garbage incineration?” This shape is red and was added by user EEE. To edit this shape, you would need to click the EEE tab in the upper-right corner.
• If you turn off Show Markup, the markup overlay tabs disappear, along with the corresponding markup shapes. Alternatively, you can turn off markup from select users by checking and unchecking users in the list beneath Show Markup Overlays.
• Any visible markup will print, although comments do not print, as we discussed earlier.
The markup features for Visio are great for commenting on living diagrams that are in continuous flux. The colorization and separate overlay tabs for each user are useful and keep things tidy. I found these features to be a bit complicated at first, but if you just experiment for a few minutes, they’ll start to make more sense.
What is missing from Visio markup, however, is the ability to delete shapes and Accept Changes, as you can in Microsoft Word.
If you’ve used Word’s reviewing features, you are probably used to being able to accept or reject a change. Graphics on the markup overlay tabs are stuck in their own parallel universe, separated from the actual drawing. This has frustrated Visio users for quite some time.
The workaround is to cut shapes from an overlay tab, click the Original tab, and then paste them. Not difficult, but not as smooth as right-clicking and choosing Accept or Reject. As for deleting shapes, you can simply add a rectangle or comment that says “delete this” and hope that the document’s owner takes your advice.
Ink
If you use a tablet PC or like to scribble with your mouse, you’ll like Ink. Inking allows you to draw and write freehand on Visio pages. You can leave your inking as Ink entities, convert it to Visio shapes, or let Visio try to recognize your handwriting and convert it to text.
You access Ink from the Markup group of the Review tab, but your inking does not have to be part of a markup overlay; it can be used in normal drawings independent of markup and review.
When you click the Ink button, you are taken to the Ink Tools contextual tab. There you can choose to scribble with the Ballpoint Pen or Highlighter. You can change the color and weight of your ink creations and erase strokes using the Stroke Eraser. Each ink stroke that you add is combined with the previous ones into a single shape. You can click the Close Ink Shape to finish one inking entity and begin a new one.
Figure 3.21 shows two ink entities: one is text created with the Ballpoint Pen tool, and the other is a Highlighter streak over the “Energy Sources” title. To make sure the highlighter streak was not combined with the handwritten text, I used the Close Ink Shape in between.
Figure 3.21. Ballpoint pen and Highlighter entities created with Ink.
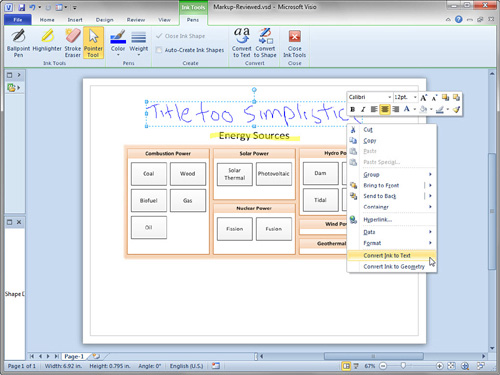
You can also see that I’ve right-clicked the chicken scrawl and am ready to click Convert Ink to Text. Believe it or not, this actually worked! A moment later, a legible block of text in 12-point Calibri appeared in its place. You can also convert your ink items to Visio shapes that can be edited with the Line, Pencil or Freeform tools.
Summary
In this chapter, you saw that Visio has an abundance of features for organizing and annotating diagrams.
You learned how to keep related sets of shapes together using containers, lists, and groups and how to categorize and manipulate shapes using layers.
You also saw that headers and footers can be used to add dynamic information to pages and that inserted fields and ScreenTips can be used to do the same for shapes.
When it comes to annotating your diagrams, you have a bevy of choices. You can choose from the new Visio 2010 callouts, older callout shapes, Comments, Markup, or Ink tools.
Finally, you can control the visibility and printing of specific sets of shapes using layers or markup overlays.