
Chapter 5. Aligning, Arranging, and Laying Out Shapes
In this chapter, you learn how to align and arrange shapes neatly using a variety of features, and l explore Visio’s automatic layout features for arranging connected diagrams.
Shape position plays a big role in a diagram’s meaning. Position on the page and proximity to other shapes can signify importance, order in time, or hierarchy.
Tidiness and consistency are also important. A jumbled drawing is hard on your eyes and confusing to look at. An orderly diagram dispenses with noise and lets the meaning shine through..
Aligning and Arranging Shapes
Visio 2010 has several features for keeping your shapes neatly in order. Some help you maintain tidiness while you draw; others enable you to clean up the mess afterward.
Using the Dynamic Grid to Align Shapes as You Draw
If you’ve noticed thin, orange lines and arrows briefly appearing as you drop shapes on the page, you’ve already seen the Dynamic Grid in action. The Dynamic Grid aims to prevent the mess before it happens.
Show Me: Media 5.1—Using the Dynamic Grid to Align Shapes in Visio 2010
![]()
Access this video file through your registered Web Edition at |my.safaribooksonline.com/9780132182683/media.
Working with the Dynamic Grid
- Create a new drawing using the Basic Flowchart template.
- For flowcharts, the Dynamic Grid is on by default, but you can double-check. Go to the View tab and make sure that Dynamic Grid in the Visual Aids group is checked.
- Drag and drop a Process shape onto the page.
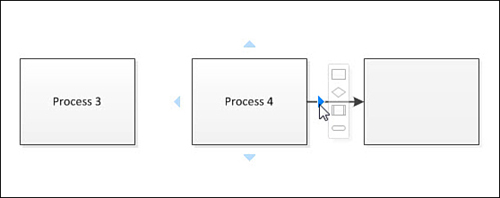
- Drag a second Process shape directly to the right of the first one. As you drag, notice the orange line and arrow that appear, as shown in Figure 5.1. The horizontal line indicates vertical alignment between the shapes. The horizontal arrows indicate uniform spacing, which doesn’t mean much when you have only two shapes on the page. For the first two shapes on a page, the Dynamic Grid uses a standard spacing that is defined for the drawing.
Figure 5.1. The Dynamic Grid appears while you drag. Here it indicates vertical alignment and standard spacing between the shapes.

- Drag a few more Process shapes onto the page, continuing to the right. Drop them when you see the alignment line and spacing arrows, as shown in Figure 5.2. The uniform spacing arrows now make a lot more sense!
Figure 5.2. The Dynamic Grid helps to enforce uniform spacing between shapes.

- In a flowchart, you would normally connect as you go, which you haven’t done so far. Mouse over your last Process shape and use the AutoConnect arrows to add another Process shape to the right. Notice that it is aligned vertically with the other shapes and spaced equally. Figure 5.3 shows the result; you can see that AutoConnect uses the same standard spacing as the Dynamic Grid to place new shapes.
Figure 5.3. AutoConnect uses the same standard spacing that the Dynamic Grid uses when offsetting new shapes.
- Drag any of the existing Process shapes so that it is below one of the others. As you drag, notice that a vertical line and vertical arrows appear. The Dynamic Grid ensures alignment and uniform spacing for vertical rows of shapes as well.
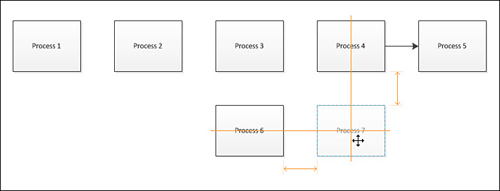
- Drag one last Process shape so that it aligns vertically and horizontally with the shapes already on the page. You should see alignment lines and spacing arrows in both the horizontal and vertical directions, as shown in Figure 5.4.
Figure 5.4. The Dynamic Grid works in both directions simultaneously.
Controlling Dynamic Grid Spacing
The uniform spacing used by the Dynamic Grid is flexible. Visio looks for patterns in related shapes to establish local spacing values. You effectively set uniform spacing for a region when you drop a second shape next to a first. Subsequent shapes in that area of the drawing will use that spacing. This means that you can have several different uniform spacing values on a page, as Figure 5.5 illustrates.
Figure 5.5. Several different local uniform spacing values can exist on a page. Visio is smart enough to recognize related groups of shapes.

If no grid spacing has been established or Visio detects no spacing pattern, Visio uses standard horizontal and vertical spacing values, which are defined for each page. AutoConnect always uses these standard spacing values when you insert shapes by clicking AutoConnect arrows. However, AutoConnect doesn’t respect local spacing values, unfortunately.
You can change the standard spacing for a diagram. Right-click a Page tab and choose Page Setup. On the Layout and Routing tab, click Spacing. Under Space Between Shapes, you can change the Horizontal and Vertical values. Visio also uses these values for spacing shapes when automatically laying out connected diagrams, and AutoConnect uses it when adding new shapes.
Dynamically Aligning Other Parts of Shapes
When you have lots of shapes on a page that are roughly the same size, such as in a flowchart or network diagram, the Dynamic Grid is most likely to assist you with center-to-center alignment. The Dynamic Grid also can align shapes by their edges: left, right, top, and bottom. Figure 5.6 shows a small shape being aligned to larger shapes at its top and right edges.
Figure 5.6. Irregularly sized shapes can be aligned using the Dynamic Grid.

Using Auto Align & Space to Clean Up Connected Diagrams
If you have been furiously flowcharting away, rapidly rearranging process steps and not paying attention to the Dynamic Grid, you might find yourself with a rather disheveled flowchart.
To save you the trouble of straightening everything one shape at a time, Visio 2010 has added the Auto Align & Space button. Located in the Arrange group on the Home tab, this button wonderfully straightens out your diagrams, as illustrated in Figure 5.7.
Figure 5.7. The messy flowchart on the left is cleaned up with a single click of the Auto Align & Space button.

Auto Align & Space has no options or settings or drop-down submenus. Just click that big button and POW! Your connected diagrams instantly get straightened out. Auto Align & Space operates on only the shapes you select, but if no shapes are selected, it tidies up the whole page.
While AutoConnect and the Dynamic Grid make it easy to maintain clean diagrams while you draw, I think Auto Align & Space nicely rounds out the feature set. It allows you to work lightning fast and concentrate on the information in your diagram, knowing that cleanup can be effectively taken care of later. Also, if you have AutoConnect or the Dynamic Grid turned off for whatever reason, Auto Align & Space is still there to help you out afterward.
Tell Me More: Media 5.2—Tricking Auto Align & Space into Tidying-up Non-connected Shapes
![]()
Access this audio file through your registered Web Edition at my.safaribooksonline.com/9780132182683/media.
Aligning and Distributing Shapes Using Position Functions
Just to the right of the Auto Align & Space button is the Position drop-down button, which contains elemental functions for aligning, distributing, rotating, and flipping shapes. Figure 5.8 shows all of Position’s items and subitems.
Figure 5.8. The Home, Arrange, Position menu and its submenus.

Though Dynamic Grid, Auto Align & Space, and AutoConnect decrease the need for many of these functions, some diagrams are too complex for the Dynamic Grid. Also, some non-connected diagram types, such as office plans, aren’t suited for Dynamic Grid, AutoConnect, or Auto Align & Space. In these cases, the functions under Position are especially useful.
Tell Me More: Media 5.3—Figure 5.8 is a Visio Drawing!
![]()
Access this audio file through your registered Web Edition at my.safaribooksonline.com/9780132182683/media.
Aligning Shapes
You can align shapes by their left, right, top, or bottom edges as well as their horizontal and vertical centers.
![]() LET ME TRY IT
LET ME TRY IT
Practice Aligning Shapes
- Start a blank drawing and draw several differently sized rectangles on the page.
- When you align the shapes, they can get bunched together so that some obscure others. If you give them a transparent fill, you can still see all the shapes, even if they become stacked.
Select all the rectangles, click the Fill drop-down, and choose Fill Options at the end of the list. The Fill dialog appears, and lets you select a color and set a transparency level among other things. Try setting a 50% transparency for your rectangles.
- Shapes are aligned to the primary selection, or first shape in the selection. When you select multiple shapes, the primary selection is the shape with the thicker magenta outline. You can explicitly control which shape is the primary selection by doing this:
a. Click the shape that you want to be the primary shape—the one that the other shapes will align to.
b. Hold down the Shift key.
c. Drag a selection rectangle around the rest of the shapes, or click each one individually while continuing to hold the Shift key.
- Drop-down the Position button in the Arrange group on the Home tab. Slowly mouse over the first seven menu items that deal with alignment (they are the ones below the Align Shapes header in bold). Live Preview shows how each alignment option will affect your shapes. Figure 5.9 demonstrates how two of these alignment operations work.
Figure 5.9. Using the alignment functions of the Position drop-down. Note the box with the thicker selection highlight in the bottom-left corner. This is the primary selection, to which the other shapes get aligned.

Distributing Shapes
If you need a set of shapes to be equally spaced, the distribute functions can help. You find them in the Space Shapes group within the Position drop-down. For veteran PC users, “space” seems to be the Visio 2010 verb for what used to be called “distribute.”
Figure 5.10 shows a practical application of shape distribution (spacing). The left half of the image shows horizontal and vertical reference line shapes that aren’t nicely distributed. The goal is to create a grid so that a coordinator can communicate locations within a building to contractors; for example, “The elevator at C-4 is due for regular maintenance.”
Figure 5.10. Distributing zone shapes horizontally and vertically to create a reference grid for an office plan.

Manually positioning the reference shapes is difficult and time consuming, and the Dynamic Grid’s uniform spacing features aren’t quite right for this task. You could use the Size & Position dialog to numerically specify locations for the shapes, but the Space Shapes functions, make this a simple task.
The key is to place the shapes roughly in order and then make sure the first and last shapes span the appropriate region. In Figure 5.10, shapes 1 and 6 are at the horizontal extremes of the plan, and shapes A and F are at the vertical extremes. The remaining shapes just need to be spaced equally between them.
To distribute each set of shapes, simply select all shapes that you wish to equally space, and then click Position, Space Shapes, Distribute Horizontally, or Distribute Vertically. The distribute functions calculate the necessary shape-to-shape spacing required to evenly distribute the selected shapes between the extremes.
If you need to space the shapes a specific distance from each other, you can use the Position, Spacing Options command. This presents a dialog where you enter precise horizontal and vertical measurements. Oddly, it seems to work only with connected diagrams; it would be a great feature for organizing grids of nonconnected shapes, too!
Rotating Shapes
At the bottom of the Position menu is the Orient Shapes group with two curiously similar-sounding items: Rotate Shapes and Rotate Diagram.
The items under Rotate Shapes enable you to rotate a selection of shapes as a single unit. You can also mirror the shapes in the horizontal or vertical direction using the flip commands.
Rotate Diagram sounds confusing. Isn’t that the same as Rotate Shapes? If you are mathematically inclined or an Excel expert, you will understand that Rotate Diagram transposes shapes. It rotates the positions of the shapes, but not the shapes themselves.
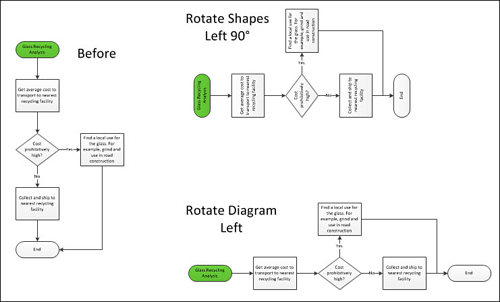
Figure 5.11 contrasts Rotate Shapes and Rotate Diagram. Note that Rotate Diagram applies only to connected shapes.
Figure 5.11. Shapes rotated using Rotate Shapes and transposed using Rotate Diagram.
Using the Grid, Ruler, and Guides
Visio has a few other elements that are useful for keeping diagrams straight and orderly. The grid, ruler, and guides have been around since the first release of Visio and are starting to be considered old-fashioned.
Although the newer Dynamic Grid and Auto Align & Space features are snazzy and impressive, they are most useful for connected diagrams. The grid, ruler, and guides are still great for measured drawings, block diagrams, user-interface mockups, and other unconnected drawings.
You can show or hide the grid, ruler, and guides using check boxes in View, Show. Let’s discuss what they are used for so you can better decide whether to turn them on or off in the first place.
Grid
Visio’s grid gives you quick visual and tactile feedback for aligning shapes and maintaining consistency. As you draw and resize shapes, your cursor snaps to the grid.
This feature makes it easy to create shapes that have identical or similar sizes, and makes it easy to abut shapes against each other. Because Visio doesn’t have any kind of abutting function, “designing shapes that fit the grid” goes beyond a compulsion for senseless order and makes it easy to place them against each other.
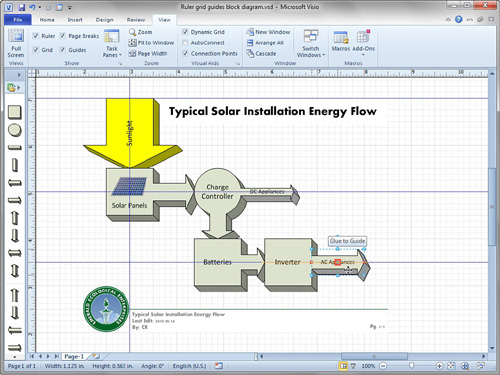
The blocks in Figure 5.12 demonstrate the usefulness of fitting to the grid. Because all the squares are exactly 1 inch × 1 inch, it is easy to snap the arrow shapes against their edges. If the squares had nongrid sizes like 1.05 inch × 1.2875 inch, it would be difficult to accurately slide the arrows against them, and the diagram would look sloppy.
Figure 5.12. A block diagram with the ruler, grid, and guides in action.
You should be aware of a few quirks about the grid. When you zoom in and out, the grid changes such that you always see roughly the same number of squares. Because of this, it is easy to forget how far in you are zoomed. To keep your perspective, pay attention to the numbers on the ruler and the size of selected shapes in the status bar.
If you really want a fixed grid, click the dialog box launcher for the View, Show group. There, you can specify custom fixed units for both the ruler and the grid, and the grid won’t vary as you zoom in or out.
Just because the grid is visible doesn’t mean that you will snap to it. This is usually the case, but you can turn grid snapping on and off via the Snap & Glue dialog. You access it by clicking the dialog box launcher in the View, Visual Aids group.
Ruler
The ruler appears along the left and top sides of the drawing window and helps you maintain perspective while zooming in and out. The ruler displays coordinates from the lower-left corner of the page, in the size and units of the drawing scale, not the size of the paper.
You can change the zero point of the ruler by Ctrl+dragging from the top-left corner where the rulers intersect to any point on the page. This capability is useful for measured drawings such as office plans, site layouts, or mechanical drawings. You can reset the origin by double-clicking the ruler intersection.
Guides
Guides are used to provide visual cues for horizontal and vertical alignment and as tools for repositioning shapes aligned in columns and rows.
You pull guides out of the rulers, as needed. They look like blue, dashed infinite lines in the horizontal or vertical directions. They don’t print, and you can glue shapes to them.
In Figure 5.12, the four guides are just barely visible. Three are horizontal and one is vertical. They help to highlight the major axes of the diagram but also make adjustments easier because shapes are glued to the guides. In the figure, the AC Appliances arrow is being glued to the guide.
![]() LET ME TRY IT
LET ME TRY IT
Gluing Shapes to Guides
- Start a new diagram using the General, Block Diagram template.
- Double-check that the grid, ruler, and guides are visible. If they aren’t, go to View, Show and check the corresponding boxes.
- Drag a horizontal guide onto the page by dragging from the ruler at the top of the page. You see a horizontal blue dashed line on the page.
- Drag the 2D Double Arrow master onto the page and glue it to the guide. As you position the shape over the guide, note the red handles that appear. These indicate that you can glue the shape to the guide. You can glue the center or the edges of the shape to the guide.
- Drag the 1D Double Arrow onto the page and glue it to the guide, too. This shape is 1D and has different handles than the 2D Double Arrow you dropped in step 4, but they nevertheless glue to the guide.
- Move the guide up and down. Note how the shapes follow along.
- Pull one end of the 1D Double Arrow off the guide. Notice that the handle is now blue instead of red. It is no longer over the guide and, therefore, no longer glued to the guide.
- Move the guide up or down again. Only one end of the 1D shape follows along, but the 2D shape remains glued.
- Add a vertical guide by dragging from the ruler at left.
- Drag an Arrow box master onto the page and glue it to both guides. You can glue any corner of the box or its center to both guides at the same time. You see red handles indicating glue in both directions.
- Move both guides. If you’ve properly glued the Arrow box to both of them, it should follow the guides in the horizontal and vertical directions.
Nudging Shapes
Two keyboard tricks will help you get shapes aligned when they are off by just a little bit.
You can nudge shapes up, down, left, or right by tapping any of the arrow keys while shapes are selected. If you hold the Shift key while nudging, the shapes move in even finer increments.
The distance moved is in pixels, not a specific distance on the page. So if you are zoomed way out, nudging moves the shapes further than when you are zoomed way in. This is very much an “eyeballing it” feature. If your drawing demands precision, nudging might not be the best way to get shapes properly positioned.
Controlling Front-to-Back Positioning
You’ve learned about a range of features for horizontally and vertically arranging and aligning your shapes, but other than a brief mention in Chapter 3, the third dimension has been neglected.
As you create shapes, the most recent ones appear “on top.” They obscure any previously-created shapes that happen to be in the immediate area. However, you don’t have to carefully plan the order in which you add shapes to a diagram because you can easily manage their Z-order. Z-order is just a mathy way of saying front-to-back order. If X is horizontal and Y is vertical, Z is into and out of your computer screen!
In your travels around the Visio interface, you’ve likely seen four commands for dealing with Z-order: Send Backward, Send to Back, Bring Forward and Bring to Front.
Bring Forward and Send Backward move shapes in or out in the Z-order by one level, whereas Bring to Front and Send to Back move shapes all the way out or in.
There are several places to get at them, including:
• Home, Arrange group
• Right-click context menu for any shape
• Shift+Ctrl+F to bring a selection of shapes to front
• Shift+Ctrl+B to send a selection of shapes to back
Note that when you group shapes together, you effectively create a new shape (the group), which ends up on top. Even if all the group’s members were behind other shapes to start, they end up on top. Also, subshapes within a group must belong to the same Z-order pocket and can’t be interwoven. So subshapes inside of a group can’t be both in front of and behind other shapes on the page.
![]() LET ME TRY IT
LET ME TRY IT
Enhancing a 3D Block Diagram Using Z-order
- Start a new diagram using the General, Block Diagram template.
- In the Shapes window, activate the Blocks Raised stencil.
- Ensure that the grid is visible. If it isn’t, go to View, Show and check the Grid check box.
- Drop the Right Arrow shape. Resize it and marvel at how well behaved it is. The 3D “shadow” and arrowhead maintain proper proportions and don’t stretch as clip art would. This is Visio SmartShape behavior at its best.
- For fun, give it a new fill color and notice that the 3D part automatically takes a darker shade of the color you choose. More smarts in action.
- Drop the Square Block shape.
- Move the arrow so that it abuts the edge of the square. With the grid activated, this should be easy to do. Notice that the extrusion from the square obscures part of the arrow and looks visually incorrect.
- Right-click the arrow and choose Bring to Front. Alternatively, right-click the square and choose Send to Back. The extrusions should no longer conflict, and your block diagram starts to look better.
- Notice that the square and the arrow do not blend together because of the line between them and (perhaps) the different fill color.
- Make the square the same color as the arrow. First, select the arrow and then click the Format Painter button in the Home, Clipboard group. Finally, click on the square. The square should now have the same formatting as the arrow.
- Heal the line between the two shapes so that they seamlessly blend together. Right-click the arrow shape and choose Open Tail. The line at the base of the arrow should disappear, and the two shapes should flow together, much like the raised block shapes in Figure 5.12. Open Tail only works if the arrow is on top of the square, z-order-wise.
Laying Out Shapes
Layout refers to the arrangement of shapes in a connected diagram. If you think about the way flowcharts, org charts, and network diagrams are typically laid out, you notice a difference in style that helps with the meaning and organization of each diagram type.
When you connect shapes together using the skills you developed in Chapter 4, “Connecting Shapes,” you actually impart meaning to the diagram that Visio can glean to automatically lay out your diagram. In this section, you explore the features, options, and tips for laying out connected diagrams.
Using Visio’s Layout Features
If you look at Figure 5.13, you see a well-connected diagram that needs help. Surprisingly, this diagram has enough information to determine the hierarchy of the system. The top-level shapes have been rigorously connected to the next level of shapes, on down the chain. Connectors are glued so that the 1D Begin handle is at the superior shape, and the 1D End handle is glued to the inferior shape. To prove that the hierarchy is really there, I’ve used thicker lines and bigger fonts for higher-level boxes. Regardless, this diagram is still a mess and needs to be cleaned up.
Figure 5.13. A well-connected diagram that desperately needs layout.

If I knew in advance all the boxes needed for this diagram, the Dynamic Grid, AutoConnect could have helped me keep order as I drew. However, I was working quickly and adding boxes as they popped into my head. This is a perfectly valid and organic way to work in Visio.
You could try tidying up using Auto Align & Space, as I’ve done in Figure 5.14. You see that some order is gained, but the overall meaning still isn’t clear.
Figure 5.14. Auto Align & Space makes the diagram neater, but the hierarchy is still not apparent, and the connectors are still spaghetti-like.

The trick, then, is to use Visio’s layout features, which you find in the Layout group on the Design tab. Figure 5.15 shows the heretofore messy energy diagram laid out using the Hierarchy style, chosen from the Re-layout Page gallery.
Figure 5.15. Choosing the Hierarchy layout style from Visio’s layout gallery arranges shapes in an org chart fashion.
Now, the meaning and hierarchy of the diagram are clearly visible. The only complaint is that it is a bit wide for such a small number of shapes—this fairly simple diagram now spills over onto three pages.
In Figure 5.15, notice the Compact Tree layout styles, located just below the Hierarchy options. Compact tree styles work very nicely for this diagram, as Figure 5.16 demonstrates. This is an improvement over the previous one because all the information fits nicely on one page and is more easily seen at a glance.
Figure 5.16. The Compact Tree layout style does wonders for the energy sources diagram.

Notice the Radial and Circular groups at the bottom of the Re-layout Page gallery. A circular arrangement might also work for a diagram like this, although I find that circular or radial arrangements work better for mind maps and network diagrams.
As food for thought, Figure 5.17 shows our example energy hierarchy diagram laid out using the Circular style. I’ve changed the shapes to circles because I think it looks better with this arrangement. Note that I changed the shapes by hand; there’s no magic “change shape” feature.
Figure 5.17. The energy sources diagram with a circular layout and a change in shape style. For extra clarity, darker shapes are higher in the hierarchy.
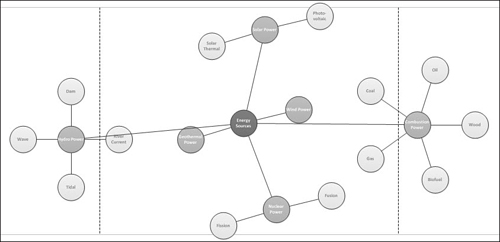
Before I go on, I’d like to call attention to a few points about the circular layout in Figure 5.17:
• The arrangement takes up more space than the Compact Tree layout.
• Connectors cross over nodes (the circles), so a bit of hand tweaking is required to perfect the diagram.
• The connector style changed from right-angle to straight.
• Because Visio calculates the new layout from existing positions, repeatedly clicking Circular layout gives you a different layout each time. Some might frown on this inconsistency; others might enjoy the game of chance!
Show Me: Media 5.4—Experimenting with Layout in Visio 2010
![]()
Access this video file through your registered Web Edition at my.safaribooksonline.com/9780132182683/media.
Laying out connected diagrams in Visio is theoretically a matter of clicking a button or two. Take a moment to try it for yourself and see how it saves you time, but pay attention to the glitches you run into along the way as well.
![]() LET ME TRY IT
LET ME TRY IT
Experimenting with Layout
- Start a new diagram using the Network, Basic Network Diagram template.
- Add a Server shape to the page and type Department Server for its text.
- Drop Laptop Computer, Cell Phone, and PDA shapes on the page and type some descriptive text—for example, Cell phone and PDA.
Note that all these shapes are not on the same stencil, so you have to click the various stencil tabs to find them all.
- Connect the Laptop to the Cell Phone and PDA. For this example, make sure that you connect from higher-level shapes to lower-level shapes.
Although networks don’t necessarily have a hierarchy like an org chart, think of connecting from the bigger piece of equipment to the smaller. This will help you to experiment with and understand Visio’s layout functions later on.
- Connect the server to the laptop shape.
- Duplicate the laptop, cell phone, PDA, and associated connectors several times. You can do this by selecting them all at once, copying and then pasting them repeatedly.
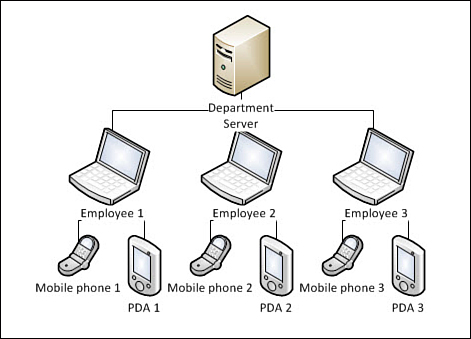
- Connect the server to each of the new laptop shapes you created. Your diagram should look similar to Figure 5.18. Note the three groups of equipment, all connected to the server
Figure 5.18. A server haphazardly connected to three groups of employee equipment.

- The connectors are drawn over the network equipment, so send them all to back. The network shapes have connection points on each side, plus one in the middle. It is easy to (accidentally) create point-to-point glue connections with these shapes (instead of dynamic glue). As a result, connectors might be on top of shapes, so the diagram looks sloppy. If you’ve created dynamic glue connections, you won’t have this problem.
a. Select all the connectors by clicking Home, Select, Select by Type.
b. Click Shape Role and check only Connectors.
c. Click OK. All the connectors in the page should be selected.
d. Send them to back by pressing Shift+Ctrl+B or using the button in the Home, Arrange group. All connectors should now be behind the network shapes.
- Experiment with various layouts available in the layout gallery. On the Design tab, click the Re-layout Page drop-down button in the Layout group. Notice that as you mouse over each item in the gallery, Live Preview shows you how the new arrangement will look.
- If you can’t see the different layouts very well, be sure to zoom out.
- Try the Circular layout style. I think it shows this network very clearly, as you see in Figure 5.19.
Figure 5.19. The Circular layout style applied to the mini network.

- Try the Hierarchy or Flowchart styles also. Notice that they have multiple choices for direction of flow. The Flowchart, Left to Right layout works nicely. It offers space for the text, and the text doesn’t overlap the connectors very much.
- Save the diagram as Ch05 Layout.vsd so that you can use it in future examples.
Fine-tuning Layout
The Re-layout button gives you quick access to several preconfigured layout styles. However, you can fine-tune the results by digging into three different dialogs, full of layout and connector settings just waiting to bewilder you.
![]() LET ME TRY IT
LET ME TRY IT
Improving Layout
- Open Ch05 Layout.vsd.
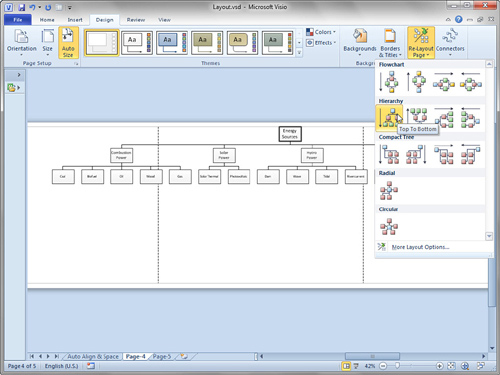
- Apply the Flowchart, Top to Bottom layout style to the diagram. This layout looks like an org chart and is fairly orderly, but it could be improved. As Figure 5.20 shows, text is hard to read because of interference with connectors, and the spacing feels a bit cramped.
Figure 5.20. The network diagram with the Flowchart, Top to Bottom layout style. Text and spacing could be better, though.

- Give the text an opaque background so that it obscures the connectors.
a. Select all the shapes in the diagram.
b. On the Home tab, click the dialog box launcher for the Font or Paragraph group and then click the Text Block tab in the pop-up dialog.
c. Click Solid Color and select white from the drop-down color list.
These settings might already be set, depending on the primary selection, because connectors already have opaque text backgrounds. Regardless, be sure to click them both so that Visio knows you intend to make a change.
d. Click OK. The text blocks now have white backgrounds that obscure the connectors, as shown in Figure 5.21. If all connectors haven’t been sent to back, they might be on top of the shape’s text and still be in the way.
Figure 5.21. White text backgrounds obscure connectors and make reading easier.
- Increase the spacing between shapes. The diagram is still cramped, and the opaque text makes connectors hard to see in some cases.
a. Click the dialog box launcher for the Layout group (on the Design tab). The Page Setup dialog appears, showing the Layout and Routing tab. Take a moment to become utterly confused by all the settings!
b. Click the Spacing button near the lower-right corner of the dialog. The Layout and Routing Spacing dialog appears, showing four pairs of horizontal and vertical spacing options.
c. Because you want more space between the shapes, change the values under Space Between Shapes. Enter 0.75 in. for the Horizontal value and 0.5 in. for the Vertical.
d. Click OK twice to get back to the diagram. Notice that nothing happens. You have to use Re-layout to get the changes to take effect.
e. Click the Re-layout Page drop-down and notice that the current layout setting is highlighted in orange. Click it again to tell Visio to lay out the diagram using the new settings. The shapes are arranged in the same style, but with more space between them, as shown in Figure 5.22. You see that text is more readable, connectors are clearer, and the diagram is easier on the eyes in general.
Figure 5.22. Increased spacing between network shapes makes text easier to read and connectors easier to follow.

- To give the diagram a more network-ish feel, make the connectors straight. In the Layout group (Design tab), click the Connectors drop-down button and choose Straight Lines. All connectors on the page change from right-angled to straight, as shown in Figure 5.23.
Figure 5.23. Mixing layout styles by applying straight lines to a flowchart layout.

- Experiment further with layout. Move shapes around on the page manually and then click Re-layout to see what happens.
Visio has a plethora of ways to fine-tune and tweak layout and connector style settings. Describing all of the options and settings would take many pages and bore you to tears. My best advice is to know where the options are, watch the following Show Me video, and take some time yourself to experiment with how layout settings affect the look of your diagrams.
Here are the places you will find layout and routing settings:
• Layout & Routing tab in the Page Setup dialog
• Spacing dialog, accessed via the Layout & Routing tab in the Page Setup dialog
• Configure Layout dialog, which you get to by clicking “More Layout Options...” at the bottom of the Re-layout Page drop-down gallery
• Re-layout Page and Connectors drop-down buttons in the Layout group on the Design tab
Show Me: Media 5.5—More Layout Settings
![]()
Access this video file through your registered Web Edition at my.safaribooksonline.com/9780132182683/media.
Summary
In this chapter, you learned many ways to arrange and align shapes as well as how to lay out connected diagrams. You saw how the Dynamic Grid helps you to maintain order while you draw, while Auto Align & Space and Re-layout Page help you clean up afterward. You learned that Auto Align & Space and Re-layout Page are aimed primarily at connected diagrams, whereas the Dynamic Grid, ruler, grid, and guides can be applied more generally.
You also explored various styles for laying out a connected diagram and how to manipulate some of the variables to fine-tune that layout.