CHAPTER 2
Financial Detective Work Before You Buy: Finding the Truth Behind What the Seller Is Telling You
Whether you own a shopping mall in the suburbs or a duplex around the corner, the basic principle of income property remains essentially the same. You expect to collect money, mainly in the form of rent, and you expect to spend money to pay for the operating expenses and the loans against the property. When you’re done for the year, you hope to have a surplus and to keep as much of it as you can in your own pocket and out of the hands of the tax collector. Perhaps someday you can also sell the property at a handsome profit. In other words, you’re looking for cash flow, appreciation, amortization, and tax shelter—the four basic returns.
To achieve these goals, you, as an investor, need to take a careful and critical look at the income and expense data of any property you consider purchasing. Later, when you’re ready to sell, a buyer can examine your own figures with the same critical eye to get a fairly realistic picture of the price your property may then command.
In this chapter, you’ll take a detailed look at the income-and-expense statement for real estate, commonly called the Annual Property Operating Data (APOD). You’ll consider how these data can be used as a guide in evaluating the performance of a property and how they can serve to signal the presence of possible problem areas.
Basic Definitions
Begin your analysis of income and expenses by reviewing a few terms:
• Gross scheduled income is the total annual rent value of all units in the property. This amount includes the actual rent generated by occupied units, as well as the potential rent from vacant units.
• Vacancy allowance is usually expressed as a percentage of the gross scheduled income. As its name suggests, it is an estimate of the amount of potential income that will be lost due to vacancy. Some investors prefer to call this category “vacancy and credit loss” so that it also accounts for uncollectible rent.
• Gross operating income (GOI) is the gross scheduled income less the vacancy allowance. It is also known as effective gross income. In short, it is the amount you actually collect.
• Operating expenses are items such as property insurance and taxes, repairs, utilities, and management fees. Operating expenses include any costs that are necessary to keep the revenue stream flowing. Mortgage payments and depreciation are not considered operating expenses, nor are capital improvements.
• Net operating income (NOI) is the gross operating income less the operating expenses. In other words, it is what is left of your total potential income after all vacancy and expense items have been subtracted. Again, mortgage payments and capital expenditures have no impact on the NOI.
• Annual Property Operating Data is the real estate equivalent of an income-and-expense statement. You’ll use the terms APOD and income and expense interchangeably.
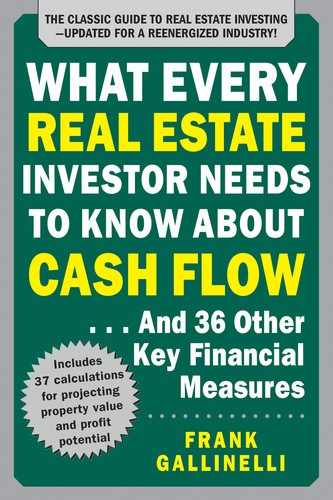
Let’s take these definitions and see how they might fit into an actual property analysis. Suppose that you’re considering the purchase of Property A, a four-unit apartment house. The present owner tells you that each apartment rents for $400 per month and that his operating expenses last year totaled $5,200. You might organize your information in this fashion:
The gross scheduled income of $19,200 represents 4 units at $400 per month for 12 months. Your vacancy allowance is an estimate, as it almost always will be. Ideally, you should base this estimate on your knowledge of market conditions and of comparable properties in the area.
Subtracting a vacancy allowance of 3% from the gross scheduled income gives you a GOI of $18,624. Subtracting your operating expenses of $5,200 then yields an NOI of $13,424.
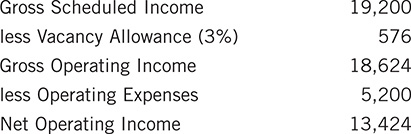
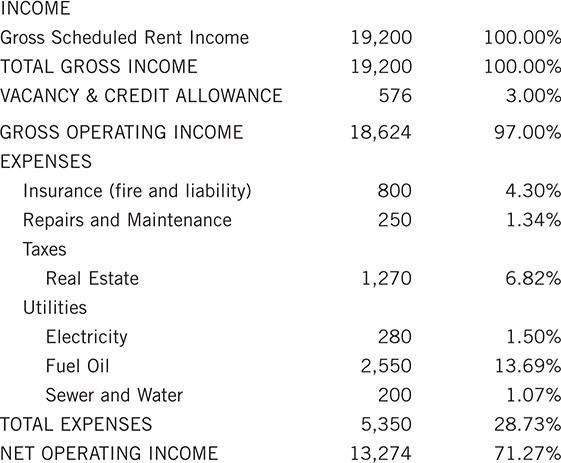
You might draw some useful inferences from these basic facts, but you probably should first take a closer look at how this property operates. The next question you would certainly ask is, “Just how was that $5,200 spent?” The seller responds by telling you he spent $2,550 on fuel oil, $130 on electricity, $200 on water, $250 on repairs, $1,270 on property taxes, and $800 on fire and liability insurance.
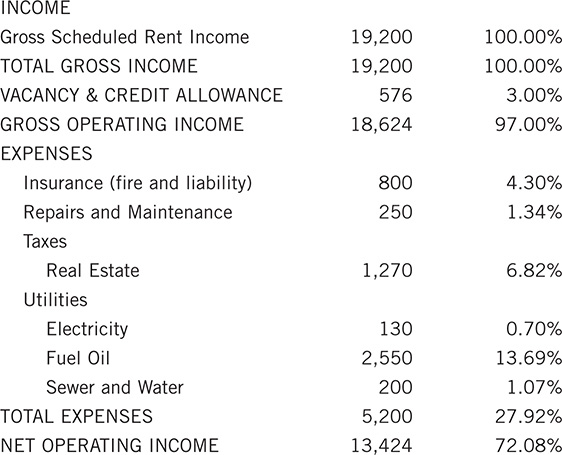
Now your APOD looks like this:
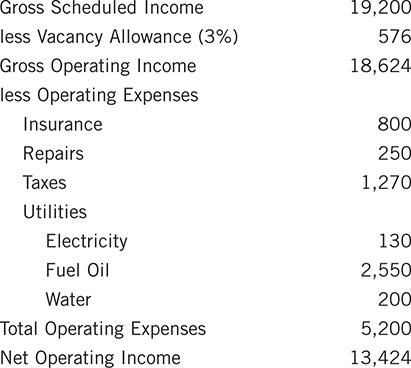
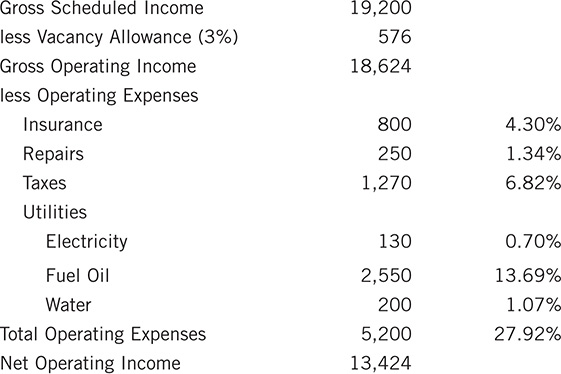
You can help yourself understand more about this property if you go a step further. You know that your actual collected rent, the GOI, is partially eaten up by your operating expenses. You can determine how big a bite each expense takes out of your income by computing the percentage of GOI that each expense represents. You accomplish this by dividing each expense by the GOI and multiplying the result by 100:
Analyzing Similar Properties
It would be nice if you had some hard-and-fast rules to measure this property against (something like “Heat should not exceed 11% of GOI—this building must need a new furnace”). The fact that there are no such neat, fixed rules doesn’t mean there are no rules at all, however. The piece of real estate in this example doesn’t exist in a vacuum, and as a potential buyer, you are sure to ask how the operating statement of this property compares with those of other potential investments. At least, that’s what you ought to be asking.
What you really want here is the ability to compare your data to some kind of norms. Your expense percentages may not tell you very much in an isolated example, but they might shed a good deal of light if you could compare them to some reasonable expectations.
Where are you going to get these norms? We discussed a few sources in the previous chapter. You can ask the real estate broker who is trying to sell you this property. He or she may have compiled data on similar buildings in the area and should certainly be interested in giving you the data you need to make an informed decision to buy. You might talk to a property manager in the area, someone who would have firsthand experience with the costs of operating such a building. You may be fortunate enough to own other properties, whose track records you can turn to for guidance. At the very least, you can go back into the marketplace, look at other properties currently for sale, and examine the operating statements of these other properties that are competing for your investment dollar.
Let’s consider Properties B, C, and D, which are all small multiunit apartment buildings, and Property E, which is a small commercial piece with two stores and an office. Using the same format as before, you can develop income-and-expense statements for each:
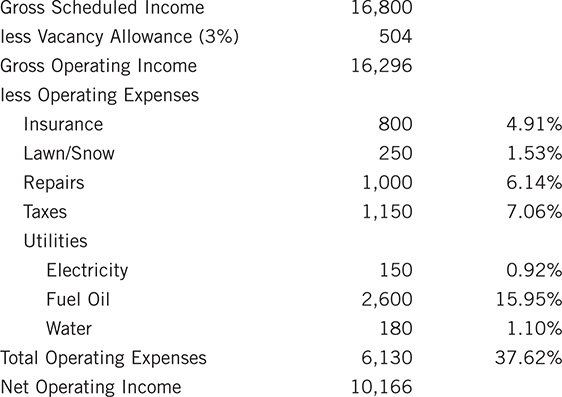
Property B:

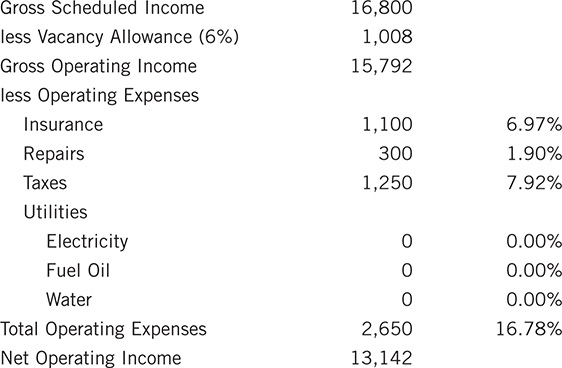
Property C:
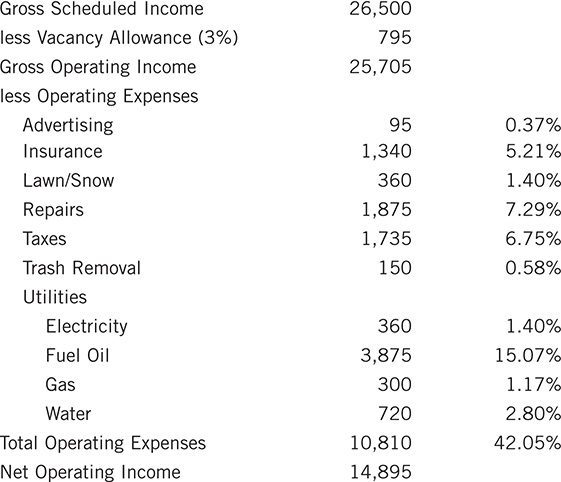
Property D:
Property E:
The most obvious difference among these statements is that the commercial parcel, Property E, has the fewest expense categories and the lowest total expense ratio. This shouldn’t surprise you, since it is quite typical for a commercial tenant to be responsible for its own utilities and interior repairs and often for any increase in property taxes. That’s very nice for the landlord, of course, but before you allow yourself to become too euphoric, you’d better make a note to examine the leases on this property to be sure that those costs are indeed being borne by the tenant and not just hidden from view. (“Well, ya know I coulda shoulda woulda passed those expenses through, but my dog ate the leases. You can do it right after you buy the place, no problem.”)
Also, you might be wise to allow yourself a bit larger vacancy allowance than you do with your residential properties, since an empty store can often take a lot longer to rent than an empty apartment.
What’s most important here, however, is the fact that the character of this property is essentially different from the others under consideration. You shouldn’t try to draw inferences from a property that is not really comparable to the subject. If you attempt to use a commercial piece in developing norms for the residential parcel, you risk the mistake of an “apples-oranges” comparison. This may very well be a worthwhile investment, but it is not a suitable yardstick for measuring Property A.
Comparing Expense Ratios
Let’s turn instead to the residential investments and see how they compare with each other and with your original proposition. Begin by scanning the operating statements for Properties A through D, looking for similarities in the expense ratios. In doing so, you discover the following:
1. Three of the four properties show insurance expense to be about 4 to 5% of GOI.
2. Two of the four show lawn/snow expense to be about 1.5%.
3. Two of the four show repairs to be about 6 to 7%.
4. All four indicate property taxes in the 5.5 to 7% range.
5. Three show electricity costs under 1.5%.
6. Three of the four properties expended 13.5 to 16% of their GOI on heating fuel.
7. The cost of water fell between 1 and 1.5% on three properties.
8. Total operating expenses ranged from about 37 to 42% on three of the properties.
What about differences? Obviously, almost every parcel shows one or more expense categories with a ratio inconsistent with that of the other properties. Also, you notice that lawn/snow appears only on two operating statements and that advertising, trash removal, and gas each appear only on one.
To what use can you put this information? To good use indeed if you keep in mind the first and best way that an APOD form can benefit you: The APOD is not just a source of answers about an investment property, but rather the source of the most important questions. Read carefully, it can provide the clues that guide you directly to the most revealing line of inquiry about how a property really functions now and how it is likely to function for you in the future.
Look at the facts that you have, and see where the clues lead you.
Property B, which shows the highest GOI, presents you with several odd expense percentages. You notice that insurance and heat costs use up a larger portion of your income. Repairs, on the other hand, consume a low percentage of income. Electricity costs are nonexistent; this is because the tenants have their own meters and thus pay for their own electricity. The same is true of all the buildings. But why are there entries of $130, $150, and $360 on the other statements?
When you ask each building owner, you learn that the electricity expense is for a separate meter governing the lighting of common areas, such as hallways and entryways. You would definitely want to know why such an expense hasn’t been listed for Property B. Has it simply been overlooked, or is there no separate meter? If the latter is the case, does the absence of such a meter violate local codes or ordinances, and would you, as the new owner, be compelled to correct that violation at your expense?
The fact that insurance costs are higher here than on the other properties would tend to support your suspicion that building code violations may exist. It’s always a good practice for you to get a quote on insurance from your own agent rather than relying on the current cost. After all, it’s your own agent’s bill that you’ll have to pay. In this case, since you’re starting to feel a bit suspicious, you might want to go one step further and have someone from your insurance company do a field inspection and advise you of violations that might affect insurability.
You may want to ask your agent if the condition of the heating system has anything to do with the high insurance costs. Also, you should always verify heating and other utility costs by contacting the utility suppliers directly. If the costs are higher than you might expect, as they are here, you want to know why. Is the condition of the heating system suspect? Where are the thermostats? Who controls their setting? Can you correct certain deficiencies and cut your costs? You can answer many of these questions with a careful inspection.
Finally, on the issue of repairs, you notice that less has been spent here than on some of the other properties. Several explanations are possible, and you need to make it your business to find out which one (or perhaps, which combination) is true:
1. The property really did not require much maintenance this year. If that is truly the case this year, it is unlikely to be the case next year.
2. The owner actually spent a bundle keeping the place together this year. In fact, so unusual were his expenditures that the owner feels it would be misleading unless he gave the “typical” annual repair costs instead. In this case, you might wonder what other unpleasant surprises you’re being shielded from.
3. The owner spent the amount stated, but it was not enough to care for the building properly. Investors call this phenomenon “deferred maintenance,” a polite term that means the owner is letting the property go to the dogs and someone is going to have to pay for the repairs sooner or later. Unfortunately, the longer those repairs are postponed, the higher the cost and the greater the likelihood of management problems and lost income. A building that has uncommonly low repair costs must be scrutinized at least as carefully as one that has costs that appear too high.
By doing little more than taking note of atypical expenditures, you have uncovered plenty of questions to investigate if you want to consider this property further. As an interesting postscript, you should notice that the total operating expenses for Property B represent 39.29% of the GOI, clearly within the range that you thought typical. It’s only because you examined the breakdown of those expenses that you were alerted to the possibility of several problem areas.
If you turn next to Property C, you don’t find any red flags waving in the expense percentage column. Your attention is drawn, however, to an expense category you haven’t seen before: lawn/snow. This example contains a lesson that is as important as it is simple. You may focus so intently on the information that is provided that you may easily forget to notice the information that is missing. It’s not enough just to evaluate the expense figures, as you did in analyzing Property B. You must always remember to ask yourself, “When you own this property, what else are you going to have to spend money on?” If there is a sidewalk in front or a parking lot in back, and if it snows in your part of the country, you will probably have a snow removal cost.
The statement for Property D adds advertising and trash removal to the list of expenses. In fact, you should keep in mind a number of expense categories in addition to those you have considered so far. You will look at these shortly, when you reconstruct the income statement for Property A.
The owner of Property D is the only one to report an expenditure for gas. You also notice that the water bill for this property is significantly more than that of the other properties. Does the plumbing leak? No—and it’s worth pointing out that, while every departure from the norm should be explained, not every one spells trouble. In this case, you find that the owner of the building has installed a clothes washer and dryer in the basement for the tenants and that these appliances account for both the gas and the water use.
Now that you have a frame of reference, go back and examine Property A, the parcel whose purchase you’re considering. What you’ll do is reconstruct your original operating statement to reflect what you realistically expect to happen over the next 12 months.
The Annual Property Operating Data Form
Let’s get used to working with an APOD form similar to what an experienced investor might use. You can put the form on the following page on your office copy machine and make some worksheets to follow along with your examples here. If you prefer, you can also go to http://www.realdata.com/book and download a spreadsheet of this form. The spreadsheet will calculate totals and percentages for you. To make the following examples more compact, we’ll show just the rows that you need to use.
Take a look at the operating statement for this investment with the same critical eye that you applied to Properties B through D.

As you look through the expenses, the insurance cost seems to be in line with the other properties, although you must still remember to get a quote from your own agent. Taxes also appear normal, and a quick telephone call to the assessor’s office will determine whether any change can be expected soon. You must not forget that a revaluation or a change in the tax rate can affect you next year, even if last year’s figures are accurate. The fuel oil costs are near the low end of your typical range, and the seller’s oil dealer confirms the number of gallons delivered. Multiplying the gallons used by this season’s prevailing rate for oil confirms the heating cost (see the following table).
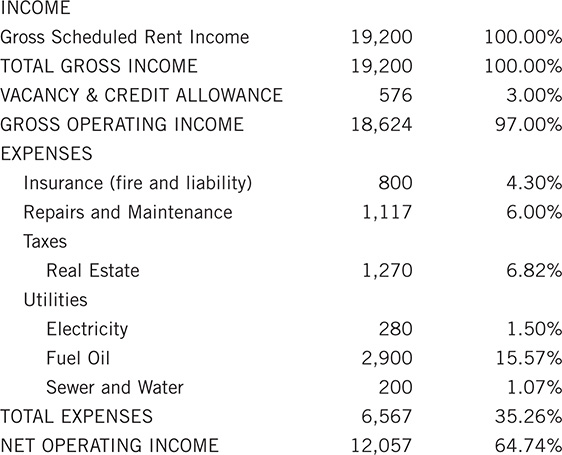
The cost of electricity is lower here than in most of the other buildings, and the owner can provide you with no reason that it should be. For the purpose of your reconstructed analysis, then, you decide to increase your estimate of that cost to conform to your expectation of about 1.5% of gross income, or $280. Now your APOD form looks like this:
The most dramatic departure from your tentative norms is in the area of repairs. The property does not look shabby, and yet 1.34% is quite a bit less than the 6 to 7% spent at the other buildings. You certainly need to ask the owner to explain this, and you might even be bold enough to ask to see a copy of Schedule E of his previous year’s income tax return, which will show you how much he claimed as taxable income and deductible expenses on this property.
An explanation does come forth. All the apartments have been remodeled within the last 18 months, and the owner’s accountant advised him that the work done must be classified as capital improvements, not as expenses. Thus, the costs are not listed as current repairs. The actual repairs for the year were quite minor since each of the rental units had recently been restored to excellent condition. In fact, the last unit was renovated just recently, in January and February of this year.
In addition to answering your question, the owner has also given you some more to think about. First, these apartments will not remain new forever. The owner may have enjoyed low repair costs last year, but he paid for that privilege with his remodeling expenses. You should count on something more realistic for repairs and maintenance for next year, perhaps 6%, which would be the low end of your typical range.

The next point to consider is the fact that one apartment was unoccupied for two months during renovation. It would be prudent for you to assume that less heat was used than would have been if a tenant occupied the unit during January and February. You cannot expect to be very precise in estimating the amount of fuel saved, but you might want to take the current heating cost and add a few percent to it. To assume an increase in total heating costs seldom turns out to be a farfetched conjecture.
Finally, the owner mentioned his accountant’s advice. Unless you intend to be a rugged individualist and contend with the vagaries of your own income tax returns, you’d better assume that this venture will add a few dollars to the cost of your tax preparation.

Your final task is to look over the expense categories (on the generic APOD form, above) that you have not yet used and to consider whether you might incur any of these costs.
You plan to manage the building yourself, so you don’t feel that you need to budget for either a resident superintendent or a professional property manager. Janitorial service is unnecessary in this small building, and you have a standard lease you have used before, so you’re expecting to have no legal costs. Should a vacancy occur, you intend to show the unit yourself, so there will be no rental commissions. If you need to find a new tenant, you will have to advertise, so you should allot a small amount, perhaps $75, for that purpose.
Finally, there is lawn/snow and trash removal. The present owner lives a block away and takes care of these items. You will have to hire someone to care of the yard, shovel the snow from the sidewalk, and take the trash cans to and from the curb on collection days. A cost of $250 for lawn/snow would be consistent with the other properties you examined, and $5 per week (a total of $260) seems fair for the trash.
Your final reconstructed APOD form should now look like this:
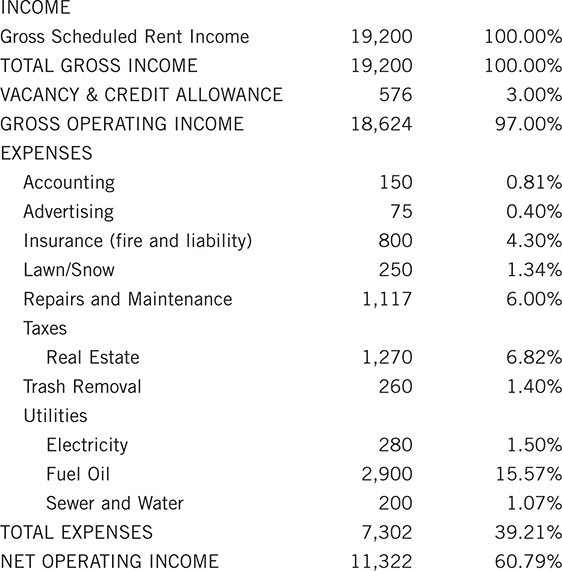
Based on the facts you know about Property A, the trends you observe among similar buildings, and the fact that your physical inspection reveals no structural problems or deferred maintenance, you can now feel reasonably confident that your projections for income and expenses are as realistic as you can make them.
Where does that leave you? Is this a worthwhile investment? To answer that question fully, you will have to go beyond the APOD to analyze cash flows, value, and rates of return, topics you’ll read about in upcoming chapters. You’ve uncovered nothing about the property to scare you off (no lead paint, asbestos, leaky oil tanks, or ghosts). You’ve also completed the formidable task of taking raw data and distilling from those data a realistic operating budget for an income-producing property. With that budget—your reconstructed APOD—you can begin to evaluate at what price and on what terms this property will make sense as an investment.