CHAPTER 6
Case Studies: Apartment, Mixed-Use, and Triple-Net Lease
Different property types and diverse situations can conspire to present a variety of opportunities and challenges to the income-property investor. How do you sort all these out? Real-life experience always makes the best teacher, but you can also get a head start on the learning process with some guided practice using what we might call “unreal estate”—made-up case studies that allow you to work through common investment scenarios as if you were a participant in an actual transaction. Think of this as a kind of flight simulator for investors. You have already seen one such case in Chapter 4, and you’ve learned quite a bit about APOD forms, time value of money, net operating income, DCR, IRR, and more. Now let’s work with a few additional case studies that not only can give you some further practice applying the concepts you’ve learned, but also can provide an introduction to some situations you haven’t seen before.
Apartment Building Investment
For our first case, we’re going to look at a property type that is fairly straightforward, at least in terms of its analysis: an apartment building. In this example, as well as in the other cases that follow, you need to step into the story, placing yourself in the deal as described.
You have already achieved substantial success in your career as the author of graphic science fiction novels and are now embarking on your new career as a real estate investor. Since this is your first venture, you feel more comfortable with the idea of owning and managing a residential property, so you have been looking exclusively at apartment buildings. A local agent has shown you a few properties, but none has excited your interest. However, there is a 16-unit building located near your home in a suburb of New York City that has caught your eye, and your attorney has told you that he has heard that the owner has an interest in selling. You decide to approach the owner directly.
The owner is indeed willing to discuss a possible sale, and so you begin your due diligence by asking him for a list of the current rents and the expenses for the past year. He provides the following:
4 studio apartments @ $1,000 per month
4 one-bedroom apartments @ $1,250 per month
4 two-bedroom apartments @ $1,500 per month
4 two-bedroom apartments, each with a second bath, @ $1,800 per month
Property taxes, $40,000 per year
Insurance, $15,000 per year
Water and sewer, $12,000 per year
Electricity for common area lighting, $2,800 per year
You confirm the rents by examining the leases, and you verify independently that the expenses are accurate as quoted.
You’re able to observe that the building is brick, and the exterior appears to be in good condition. There is parking for 16 cars. You have $350,000 in cash available to invest, and your bank has said that the potential financing terms would be 80% loan-to-value, 1.20 minimum debt coverage ratio, 6.75% interest (fixed for 5 years and floating for the remaining 15 years of a 20-year term), with 1 point payable at the closing. Based on your research into recent sales and your interrogation of a local appraiser, you conclude that the current market capitalization rate for properties of this type in this neighborhood is about 9%.
You don’t want to tip off that you’re a beginner, and so you decide to play this really cool. Hence, you don’t ask how much the owner wants for the property. You’ve been reading this really great book about real estate investing and financial measures, so you’re confident you can do the math and come up with a price that makes sense for you.
Where to begin? Your first task is to start at the top and to compile the data about revenue, i.e., the gross scheduled income:
4 units @ 1,000 per month = 4 × 1,000 × 12 = 48,000
4 units @ 1,250 per month = 4 × 1,250 × 12 = 60,000
4 units @ 1,500 per month = 4 × 1,500 × 12 = 72,000
4 units @ 1,800 per month = 4 × 1,800 × 12 = 86,400
Gross Scheduled Income = 266,400
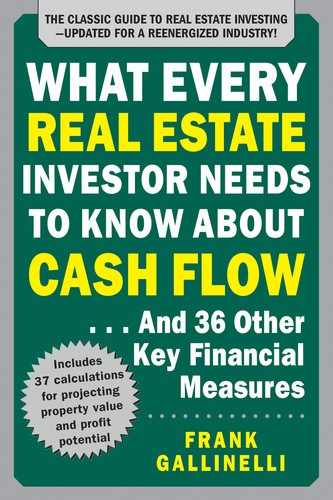
The seller has also provided you with information about operating expenses, so you decide that the correct approach is to take the revenue and expense data and build an Annual Property Operating Data (APOD) form. You saw such an APOD back in Chapter 2, so you have a good idea of what it should entail. Your summary looks like this:

As stated above, you’ve learned that the market capitalization rate for apartment buildings in this area is 9%. Armed with your income capitalization formula:
Value = Net Operating Income / Capitalization Rate
you proceed to do the math:
Value = 196,600 / 0.09
Value = 2,184,444
and conclude that the property is worth about $2.2 million.
You’re ready to make an offer, right? Wrong. Really wrong.
Let’s start by looking at that skeleton you called an APOD. You’ve made what is one of the most common mistakes committed by beginning (and sometimes even by more experienced) investors: You’ve focused on verifying and analyzing the information you’ve been provided, but you haven’t thought about the information that might be missing. All the data you have in hand is indeed factually correct, but the story doesn’t end there. You’ve made the erroneous and potentially damaging assumption that the seller or the seller’s representative has told you everything you really need to know. As you will see in a moment, that can be an expensive mistake.
Let’s go back and revisit the items typically listed on a generic version of an APOD form shown on the following page.
You will probably never encounter a property for which you will need to account for all the items on a laundry list such as this. However, with this apartment building, you have data for just the gross scheduled income and four operating expenses. There has to be more to the story than this.
Gross Scheduled Rent Income
Other Income
TOTAL GROSS INCOME
VACANCY & CREDIT ALLOWANCE
GROSS OPERATING INCOME
EXPENSES
Accounting
Advertising
Insurance (fire and liability)
Janitorial Service
Lawn/Snow
Legal
Licenses
Miscellaneous
Property Management
Repairs and Maintenance
Resident Superintendent
Supplies
Taxes
Real Estate
Personal Property
Payroll
Other
Trash Removal
Utilities
Electricity
Fuel Oi
Gas
Sewer and Water
Telephone
Other
TOTAL EXPENSES
NET OPERATING INCOME
Let’s start again from the top. You accept the top-line revenue as correct, but do you really believe that you will never have a vacancy or a credit loss? Better if you assume at least a modest amount, say 3%.
Next look at the expenses. After you examine the previous figure and see that list of possible costs staring at you, you find it easier to put yourself inside the deal and imagine the realities of ownership. Some items now strike you as obvious:
• A 16-unit apartment building is certainly going to have a meaningful amount of repair and maintenance work every year.
• You’ll surely need to hire someone to haul away the trash.
• The individual apartments, as in most such buildings, do not have separate water meters, so you’ll be paying for water and sewer.
A few other items may not be so obvious, but they also require your consideration:
• Some tax accounting will be necessary, especially if, like many rental property owners, you hold title as an LLC and have to file a separate tax return.
• As the vacancy allowance implies, you’re likely to have some turnover each year, so an advertising or commission expense is part of your cost of doing business.
• Apartment buildings like this one have hallways, and someone has to keep them clean; hence, janitorial service.
• Did you notice that the description said this property has 16 parking spaces and is in a suburb of New York? Think snow removal.
• There is the miscellaneous stuff that comes up whenever you own and maintain anything bigger than a breadbox: lightbulbs, furnace filters, floor mats, keys, whatever. Call them supplies.
• You hope all your legal work will be for the preparation of leases, but whatever the reason, you can probably count on some bills from your attorney each year.
• Speaking of legal work, you realize that you’ll have closing costs associated with this purchase. These will include title search, title insurance, and attorney’s fees. You’ll plan on $10,000 to cover these costs.
It’s a good thing you didn’t try to make that $2.184 million offer. In addition to the 20% down payment and closing costs, you forgot that you needed to pay 1 point to close the loan. Your $350,000 would have fallen far short of what you would have needed.
One final item to think about is property management. Many owners of smaller properties ignore this cost because they handle the work themselves and have no out-of-pocket expenditure. From a budgeting perspective, that makes sense. However, right now, your purpose is to come up with a realistic number for net operating income in order to estimate the current value of the property. In that scenario, you should do what the typical appraiser would do, and that is to impute a cost for property management. Think of it this way: You may not be paying the money out to a third party (at least not at first), but your own time has a value, and that value should be included as part of the operating overhead for this investment.
It is common to pay professional property managers a percentage of collected rent, so for this example you’ll assume that 5% of the gross operating income (GOI) is a fair amount to add to your APOD as the value of that service.
Now that you realize how much you don’t know about this property, it’s time to go back to the seller and demand more information. Much of what you need to see will be items that the seller has been paying and can account for by unveiling the property’s books or tax returns. With some, like repairs and maintenance, you might be better off making your own estimates based on the actual condition of the property. As in the case you saw in Chapter 4, recent expenditures for repairs and maintenance may not always be a good indicator of the likely costs going forward.
Let’s reconstruct this APOD now, based on the results of your enhanced due diligence:
You are seeing a significantly lower NOI now that you have factored in a more realistic estimate of the costs of operating this property; and with that lower NOI will come a lower estimate of the current value:
Value = Net Operating Income / Capitalization Rate
Value = 135,588 / 0.09
Value = 1,506,533
That’s a price difference of almost $700,000 compared with your original estimate, a serious amount by anyone’s standards. In a real deal, the variance might not be quite so dramatic. For the purpose of driving home a point, we’ve introduced a considerable number of expense items that needed to be filled in, but even if there were only a few, the effect on your estimate of value could certainly be enough to make the difference between a successful investment and major disappointment.
You’re justifiably pleased with yourself for having dodged this overpayment bullet, and you feel ready to move forward with a lower offer; but ever the attentive student, you again recall the case study you read in Chapter 4, where you saw an analysis that looked forward into projections about future years. Why should you do that, when you’ve already identified the likely appraised value of the property today? That valuation is important, but it doesn’t address another issue that should concern you: “I’m going to own this for more than an instant; how might this investment perform over time?”
You decide that your “Annual” Property Operating Data should, in fact, be a multiyear projection and should drive an estimate of future cash flows and potential resale.
(An editorial note: You would typically want your projection of long-term ownership to go out 10 or even 20 years. That would allow you to see the effects of matters like possible interest rate adjustments on your mortgage or the need for future capital improvements, and so you could test a variety of longer holding periods. To make the numbers in our examples large enough to see, however, we’ll go out no more than five years. Much as John Hancock felt about King George III, we’re hoping you won’t need your glasses to read what we’ve written.)
In order to produce your multiyear APOD, you’ll need to estimate how your rental revenue and operating expenses will change over time. To do this, you’ll have to ratchet up your due-diligence activities once again, going beyond the property itself to look at the market wherein it sits. What has been the trend in this neighborhood for apartment rents? How have the bigger-ticket costs such as property taxes and insurance changed in recent years? After your research, you decide to project a 3% annual increase for both the income and expenses. The only exception is that you’ll maintain the assumption that you’ll spend 5% of GOI for property management.
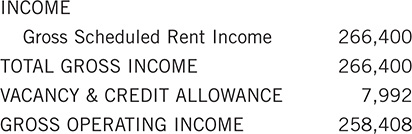
Your extended APOD looks like this:
Your main reason for extending the APOD is to forecast your NOI into the future. Having done this, you can now also estimate a number of this property’s key investment metrics, chief among them its cash flow. You saw more detailed examples of pro formas earlier in this book, but we’ll keep this one simple enough to focus on the key points:
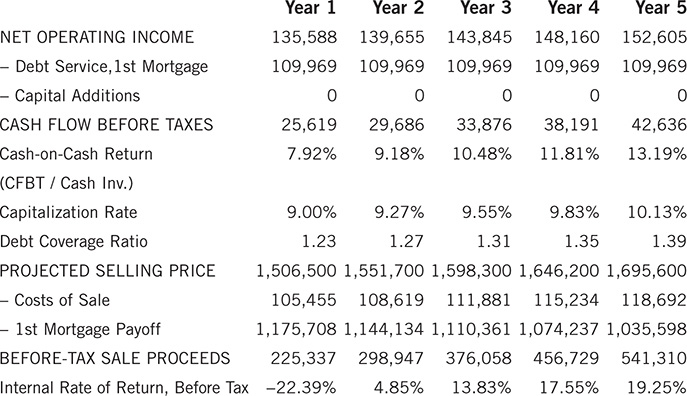
Let’s pick this apart. The top line, net operating income, comes from the extended APOD you just completed. NOI—revenue minus vacancy minus operating expenses—accounts for most of your cash flow but not quite all. If you have a mortgage, you have to make the payments, called “debt service,” out of that NOI, so they appear below the NOI line here. (Check out Calculation 28 in Part II for ways to figure the mortgage payment. Remember that you are dealing with annual amounts everywhere, so don’t forget to multiply your monthly payment by 12 to get your annual debt service.)
Another item that was not part of the APOD is capital additions, or improvements to the property. Say, for example, that you had to replace the elevator in this building. That would not be an operating expense; it would have to be written off a little at a time over a number of years as a capital cost. Still, you would probably be paying for it all at once, so it would take an immediate bite out of your cash flow. You are not anticipating any such capital costs in this example, but if you did, you would want to be sure to subtract them here as part of your calculation of cash flow.
That projection of expected future cash flow is certainly one of the main reasons you’re producing this pro forma. Your first concern when you look at your projections is, “Can I anticipate a positive cash flow?” You’re relieved to see that the numbers are indeed strongly positive, which means you don’t believe you’ll have to reach into your own pocket to support this property.
![]()
You know that you’re expecting to buy the property at exactly the 9% market cap rate, but you’re pleased to see that the relationship between your NOI and the original price gets stronger each subsequent year.
The debt coverage ratio (DCR) often doesn’t get the amount of attention from investors that it deserves, but here again you’re looking at positive news. Remember that the lender was requiring at least a 1.20 DCR in order to underwrite the mortgage. You clear that hurdle the first year, and your ratio gets stronger each subsequent year.
![]()
The next part of your abbreviated pro forma concerns the eventual resale of the property. As mentioned above, we’re squeezing just five years of projections onto these pages, but your actual investment horizon may go out a good deal further than that. Nonetheless, you can still gather some useful insights even with this shorter forecast. Notice that your pro forma is “selling” the property every year. By using that approach, you’re posing the question, “What is my overall return if I sell after one year, or after two years, or three, etc.?”
Before you look at the bottom line of this report, consider how you get there. First you need to make an estimate of the possible resale value in each of the future years. By now you’re comfortable with the idea that capitalizing the NOI is a credible approach. You do need to ask yourself, however, “What cap rate should I use?” The easiest answer is that you could use the same cap rate at which you purchased the property—the so-called going-in cap rate—as a reasonable estimate of your exit cap rate.
![]()
Next, you will need to recognize that you are unlikely to see a buyer parachute in, on cue, with cash in hand, when you are ready to sell. You will probably require the services of a broker and an attorney, and their fees are called “costs of sale.” In this example, you will estimate 7% of the selling price to cover those costs.
![]()
Since we’re on the subject of transaction costs, it’s important to recognize that your initial financial commitment includes more than just the down payment. The example stated that you needed to pay 1 point to the lender (1% of the amount of the mortgage). You probably need to obtain title insurance, as well as the assistance of a lawyer or title agent to close the purchase. Your initial investment in this deal must take these costs into account so that your return-on-investment calculations will be meaningful.
You now have a picture of the complete income stream, which includes the year-by-year cash flows and the final sale proceeds. From those, along with your initial cash investment, you can calculate the internal rate of return. (See Chapter 5 for more about IRR.) How does it look?

If you sell at the end of the first year, your return is negative. Is that a deal killer? Probably not. Keep in mind that the property has not had much of an opportunity to grow in value in just one year, and you will have to absorb both the costs of acquisition (closing fees, loan point) and the costs of resale before you have even had a chance to learn the correct zip code for this building. Too much overhead, too little time.
The second year is better, though not great. By the time you get to the third year, it’s starting to look promising, and by the fourth you are seeing the kind of high-teens IRR that apartment investors tend to like.
Since you’re a prudent investor, however, you won’t settle for an analysis with just one pass. You will ask yourself, “Do I think there is any reason why the market in this location might get stronger or weaker in coming years?” Then you will rerun your projections with exit cap rates that are above and below the rate at which you bought the property. Are you still OK with the results?
If you must resell at a 9.5% cap rate:
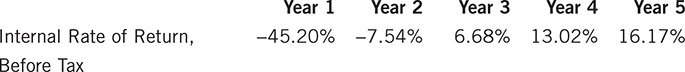
If you can resell at an 8.5% cap rate:

Clearly, you’ll sell for a higher price with the lower exit cap rate, and therefore your overall return will improve. The higher exit cap rate means you’ll sell for a lower price and see a lower overall return. The numbers here suggest that the return should improve steadily, even with the high exit cap rate, if you are prepared to hang in for a longer time. No amount of math can make that personal decision for you, but your pro forma can at least give you a reasonable sense of the kind of returns you might achieve over a range of holding periods and exit cap rates.
Mixed-Use Property
Perhaps you’re ready now to go outside your comfort zone and start dealing with commercial tenants. One way to make that transition is with a mixed-use property. As its name implies, this type combines both residential and nonresidential units. The retail uses in this example will give you an opportunity to learn about some important new topics. Here’s the deal:
This building has two retail spaces on the ground level and 16 apartments on the four floors above. The total rentable area of the structure is 50,000 square feet.
Retail Tenants
A regional bank occupies 7,500 square feet and currently pays $30 per square foot per year. The bank is now in the third year of a 10-year lease (“now” = year 1 of your analysis); the rent will step up to $36 per square foot at the beginning of the fifth year of the lease. In addition to the base rent, the bank pays a pro rata share of property taxes in excess of $30,000 and of insurance expense in excess of $10,000. (Note: By “pro rata share” we mean a share based on the size of the bank’s space compared with the total rentable area of the building.)
A restaurant occupies 2,500 square feet, paying $32 per square foot per year. This tenant is in the last year of a four-year lease and has an option to renew at $38 per square foot at the end of that term. The restaurant also pays a pro rata share of property taxes in excess of $30,000 and of insurance expense in excess of $10,000. As a restaurant, it is best known for its exceedingly small portions and its surly wait staff.
Residential Tenants
In the interests of simplicity—and so you don’t have to compute yet another residential rent roll—we will take the same 16 apartment units from the last problem, lift them with a huge crane, and place them gently on top of those street-level retail units. Hence, you will have the same residential gross scheduled income of $266,400 in the first year and the same 3% annual rate of increase for subsequent years that you saw in the apartment case study.
Also from the previous case, you learned your lesson about relying on property data supplied by the seller, and so you have done your due diligence quite thoroughly this time. You expect the first-year operating expenses to look like this:

You anticipate each of these expenses to rise at 3% annually, except for property management, which will always float at 5% of the gross operating income. You should recognize that you could forecast different rates of increase for different expenses if you find reason to believe that such would be appropriate. For example, your analysis of the market might lead you to expect steeper increases for property taxes and insurance or more modest hikes for some other expenses. In this case, however, your research has made you comfortable with an across-the-board 3%.
You’ve spoken to a lender and have found that financing is available at 80% loan to value for 20 years, with interest at 7% for the first five years. After that time, the rate will become adjustable. The loan requires a debt coverage ratio of at least 1.25 and payment of 1 point. You will also pay $12,000 in closing costs related to the purchase.
Your search of recent transactions shows that similar properties in this location have sold at a 9.5% capitalization rate.
The owner has listed the property for sale at $4.25 million.
As in the previous case, and as with any income-and-expense statement, you want to start at the top with the revenue. You are using the same rent roll as in the apartment case, so you know that the gross scheduled income from the residential units is $266,400 in the first year, increasing annually at 3%. Next you need to determine the revenue from the retail units. That may prove to be a bit trickier. Let’s start with the base rent:
The bank occupies 7,500 square feet and pays $30 per square foot per year in the first year.
7,500 × 30.00 = 225,000
The bank is now in the third year of a 10-year lease, and its rent will step up to $36 per square foot at the beginning of the fifth year of the lease, i.e., two years from now.
7,500 × 36.00 = 270,000
Once again, for the sake of readability, we confine ourselves to a five-year projection:
![]()
The restaurant occupies 2,500 square feet and pays $32 per square foot per year in the first year.
2,500 × 32.00 = 80,000
If the restaurant exercises its option to renew at $38 per square foot next year, its rent will increase to $95,000.
2,500 × 38.00 = 95,000
![]()
So far, so simple; but recall that both of these retail tenants must also pay a pro rata share of property taxes in excess of $30,000 and of insurance expense in excess of $10,000. You have just struck a mother lode of new terminology and concepts, all having to do with commercial leasing—so what we have here is (by design) a teachable moment. Let’s deal with the vocabulary first and then do the math.
The arrangement by which a commercial tenant pays all or part of certain operating expenses goes by any of several names, including expense recoveries, expense reimbursements, or pass-through expenses. These terms are synonymous, and they mean that some or all of a property’s operating costs are going to be borne by the tenants. The details of each tenant’s obligation to pay are defined in that tenant’s lease. What expenses are typically “recoverable,” i.e., passed on to the tenant? Property taxes and insurance are among the most customary. If a building has areas that are shared by all tenants or used by the public when they engage with tenants—areas such as lobbies, hallways, elevators, restrooms, parking lots—then the landlord may choose to pass on the cost of their upkeep in the form of “common area maintenance.”
When you think about common area maintenance, you also have to keep in mind the notion of “rentable square area” (or rentable square feet). If the property’s layout does, in fact, include common areas, then the leases may define each tenant’s rentable area as including not just the space physically occupied by the tenant (its “usable area”) but also a portion of the common area. The landlord is not being arbitrary in doing so. In order to be able to provide usable space for tenants in a shopping center, the owner may also have to provide lobbies, walkways, elevators, and restrooms. These common areas don’t generate income to the owner, but they do spawn maintenance costs. (See Calculation 37 for more about building measurements.)
The most common way of allocating recoverable expenses is as you’ve seen described in this problem, which is according to the tenant’s pro rata share of total rentable space. In this case, the bank occupies 15% of the 50,000 square foot total, and the restaurant occupies 5%. However, the landlord and tenant can agree to any formula that suits them (provided, of course, that they do not agree to anything that is contrary to law). For example, the tenants could have agreed to reimburse based on their relative occupancy of just the commercial space (75% for the bank and 25% for the restaurant). The proportions are the same, but the actual dollar amounts reimbursed would be much greater if based like this, solely on the commercial space.
Likewise, the parties do not necessarily have to agree that the entire amount of an expense will be passed on to tenants. Recall that this case study says the tenants will pay a share of property taxes in excess of $30,000. That $30,000 actually has a name. It is called an “expense stop.” An expense stop is an amount at which the parties have agreed that the landlord’s obligation to pay a particular expense will stop and the tenants’ obligation to reimburse will begin.
A common variation of this theme is the base-year expense stop. In that situation, the amount of the stop is not predetermined in the lease. The landlord agrees to pay the full amount of certain expenses in the first year (the “base year”). That amount becomes the base-year expense stop, and the tenant agrees to pay each year thereafter the excess over the base-year amount. It sounds reasonable enough, but tenants are sometimes reluctant to enter into this kind of arrangement. They may prefer an explicitly predefined expense stop, rather than a base-year stop, fearing that the landlord might juggle the timing of base-year expense payments so as to make the base-year stop artificially low.
It has taken us a while to get to the next calculation, but now we’re ready. What is the amount of expense recovery that each tenant will pay?
The insurance expense for the first year is $16,000. That’s $6,000 over the $10,000 expense stop for insurance, so each tenant must pay a percentage of that $6,000. The property tax expense for the first year is $50,000. That’s $20,000 over the expense stop for taxes, so each tenant must pay a percentage of that 20,000.
Since the bank occupies 7,500 of the 50,000 total rentable square feet, it must pay 15% of the excess for each expense:

The restaurant occupies 2,500 square feet, or 5% of the space.

That takes care of the first year, but you will not be able to estimate the recovery amounts for future years until you first estimate the expenses for those years. Sounds like a job for the extended APOD. Let’s look at just the two expenses that are reimbursable. Each grows at 3% per year.
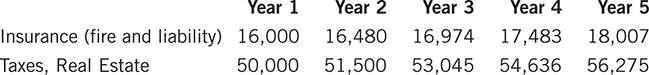
For each subsequent year, you need to do the same as you just did for the first year: apply the recovery percentages (15% for the bank, 5% for the restaurant) to the insurance cost in excess of $10,000 and to the property tax in excess of $50,000. When you do so, you arrive at these totals:

Note that the total amount passed through does not equal the total amount in excess of the “stop.” That’s because only the commercial tenants are paying a share—15% and 5%, respectively—of the recoverable expenses.
It’s time to return to your extended APOD in earnest and to pull all this together:

Anything that can make your presentation clear and easy to understand is a good thing. Since this a mixed-use property, you decided that it would be useful to distinguish between the commercial and residential sources of revenue. Also, within the commercial, you distinguish between the base rent and the expense recovery revenue. Note that you have applied the vacancy and credit allowance to the total gross income, including the expense recoveries. If you lose the tenant, you will also lose the recovery. Likewise, you have applied the 5% property management fee to the total gross operating income, including the recoveries.
Now that you have your NOI, you can run your first test of this investment. The market cap rate is 9.5%, and the asking price is $4.25 million. Does that price sound right? You know the drill:
Value = Net Operating Income / Capitalization Rate
Value = 378,537 / 0.095
Value = 3,984,600
Given the benefit of rounding, it looks like this property might appraise closer to $4 million, not $4.25 million. You’ll produce a pro forma assuming a $4 million purchase price. Since this is mixed-use property, you’ll add some additional detail so that any reader of your report will have a clear understanding of the various sources of revenue:
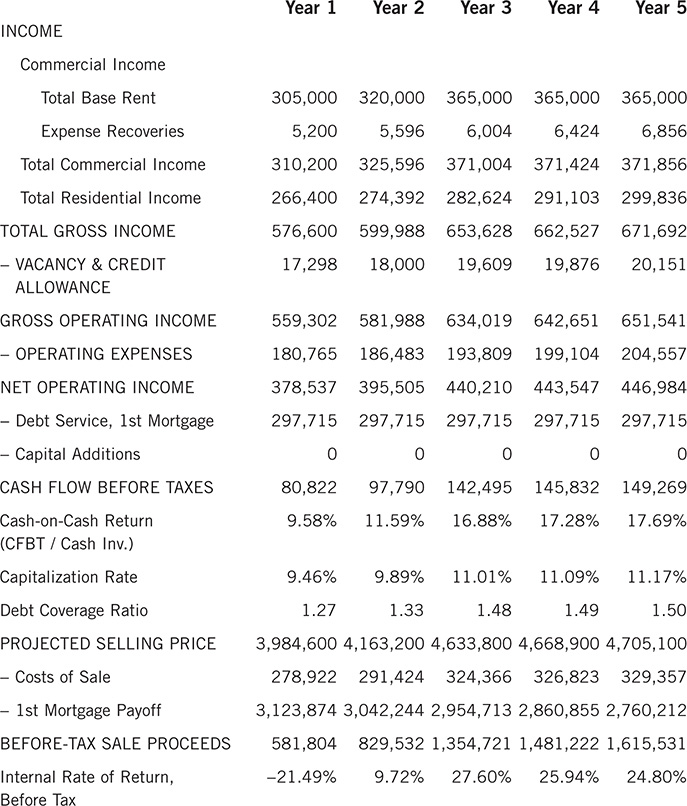
How do these projections look to you? Your eyes move immediately to the cash flow row, and you’re pleased to see that the amounts estimated there are healthy and growing. You check out the debt coverage ratio and can see that you’ve cleared the 1.25 hurdle required by your lender. As in the apartment example, your first-year IRR is negative, but by the third year it is quite strong and stays that way for the remainder of your forecast.
This appears to be a solid investment opportunity if purchased at $4 million. You are so pleased with yourself for finding it that you decide to celebrate by treating yourself to dinner at the restaurant on the ground floor. At some point about halfway through your entrée, reality comes crashing down on you. The only thing worse than the service in this place is the food. You look around and observe that there is only one other patron. You now realize that this business is terminal. It’s hanging on by a pastry hook. It’s not going to renew its lease next year; or if it does, it will surely go bankrupt before the lease runs out.
In other words, you need to make substantial revisions to the projections you just made about this property’s future income stream. You have four issues to address:
1. Can you still get a rental rate of $38 per square foot, plus pass-throughs, with a new tenant? You decide yes, that is still a realistic rent.
2. It generally takes longer to find a tenant for retail space than for an apartment. You’re going to assume six months of vacancy at the beginning of year 2.
3. You expect to need the services of a commercial leasing broker to find that new tenant. After a bit of give-and-take, you negotiate a commission rate of 4% of the total rent for the term of the lease.
4. It is unlikely that a new tenant will want to operate using the décor of a failed restaurant. You’re probably going to need to make some sort of concession to the new tenant regarding fit-up of the space. The two most likely options are that you’ll have to offer several months’ free rent while the new tenant remodels or you’ll have to give a tenant improvement (TI) allowance. You opt to give the tenant $20 per square foot toward improvements.
You decide, wisely, to skip dessert and proceed directly to your office to rebuild your pro forma. Year 2 is going to look much different now. With six months of vacancy, you will collect only half the base rent and half the expense reimbursements you had previously anticipated from the restaurant.

You are also going to have to pay that leasing commission. Let’s assume that you sign up the next tenant for five years at a flat $38 per square foot and that the commission is charged only on the base rent:
$38/sf per year × 2,500 sf × 5 years × 4% commission = $19,000
You also agreed to spot the new tenant $20 per square foot as a TI allowance:
2,500 sf × $20 = $50,000
Your pro forma now looks like this:

Your attention goes immediately to the cash flow line, where you look for the year 2 results. You are dismayed to see a negative $15,627. That’s about $113,000 less than you were expecting if no vacancy had occurred. Of course, the reason you have a negative cash flow is that you are not only losing revenue from the vacant restaurant space, but also spending extra money for a leasing commission and tenant improvements. A negative cash flow really means that you have to make up the difference out of your own pocket. You look at your IRR and see that it too looks dismal in the second year. The good news is that it bounces back in year 3, assuming, of course, that you do indeed successfully re-lease the restaurant.
The likelihood of losing a tenant motivates you to test a lower price, $3.8 million; you rerun your numbers:

You find that the lower price means you can close the deal with a smaller mortgage, and the resulting lower debt service just about wipes out your negative cash flow. Now you’re only $741 in the hole in year 2. You won’t worry about the DCR of 1.24 in year 2. It’s only 0.01 below the threshold; and, besides, you already have the mortgage by then. Your IRR in the second year looks a little less painful as well, coming in now at a still-negative –11.32%, while subsequent sale years remain strong in the mid-20s and as high as 31%. You decide that the potential for tenant loss means this property presents a higher risk than you originally thought, and so you will press your case for a price of $3.8 million.
Triple-Net Lease
Now that you have some experience with commercial tenancies, perhaps you would like to look into a specialization: the triple-net lease, aka NNN. This scenario is a variation of what you saw with the retail portion of the mixed-use property.
What exactly is a triple-net lease? It is a lease where the tenant agrees to pay (in addition to its base rent) the net taxes, insurance, and maintenance costs. Those are the three “nets” in “triple net.” The tenant will pay for all repairs and maintenance to its own space, and if that space is part of a multitenant property such as a shopping center, the tenant will also pay its pro rata share of common area maintenance. Utility costs are usually metered separately and paid directly by the tenant, so this lease structure effectively insulates the owner from virtually all the costs of operating the property.
Technically, any rental could be triple net, but owners use this type of lease most commonly with single-tenant, freestanding commercial properties. Let’s take a look at an example:
You are considering the purchase of a single freestanding building occupied by a pharmacy. The building has 10,000 rentable square feet on one level. The pharmacy is part of a national chain. The parent company guarantees the lease, which is currently at $36 per square foot and has 13 years left to run. There is an escalation clause that increases the base rent 6% every three years. The next such escalation will occur three years from now, i.e., in year 4 of your analysis.
The tenant is responsible for all interior and exterior maintenance and repairs, snow removal, sewer and water charges, trash removal, and exterior lighting. The tenant will arrange for those services and utilities and pay the charges directly.
The tenant will reimburse you for 100% of the insurance premium and property taxes paid by you. The year 1 amounts are as follows, and you expect them to increase by 3% per year:
![]()
You expect to pay $5,000 for accounting and bookkeeping services and will budget $2,000 per year for legal services. You assume that each of these costs will rise about 3% annually. The tenant is not responsible for these expenses.
You have $2 million in cash to invest and can obtain financing for 15 years at 5.0%, with a maximum 65% loan-to-value ratio. The lender requires a debt coverage ratio of at least 1.25 and payment of 1 point to obtain the loan. You will spend about $12,000 on legal costs to close the transaction.
Your search of recent transactions shows that other freestanding single-use properties in this area have sold recently at a 7% capitalization rate. The owner has listed the property for sale at $5.5 million.
You’ve gained enough experience analyzing income properties that you can get right down to business. You’ll first build an extended APOD and then create a cash flow and resale pro forma.
The revenue portion of your APOD will display the base rent and expense reimbursements. The base will start at $36 per square foot per year times 10,000 square feet, or $360,000. This amount will continue until year 4, when a 6% step-up occurs, making the new base rent $381,600. The reimbursements will start off as the sum of the insurance and tax expenses ($12,000 and $55,000, respectively), with each increasing 3% per year. As a triple-net tenant, the pharmacy will pay directly for any repairs, maintenance, and utilities, so your projection of gross scheduled income looks like this:

Now you can build the rest of your APOD. You know that you have budgeted $5,000 for bookkeeping and accounting, as well as $2,000 for legal services, with each growing at 3% per year. However, you decide to plug in two more items because you know the bank’s appraiser will get testy if they are omitted. You add a 2% allowance for vacancy and credit loss and put in an expense for property management equal to 3% of GOI. Since you have a high-quality tenant on a long-term lease, you don’t really expect that you’ll have to deal with either vacancy or management concerns; but you know your lender expects to see them in the appraisal, so you decide to include them in your analysis.
Your five-year APOD looks like this:

You can divide the first-year NOI by the prevailing market cap rate of 7% to see how the lender’s appraiser might value the property:
![]()
It comes as no surprise that the seller wants to get more than you would consider a fair price, but $750,000 seems like an awfully big spread. You decide to take your analysis to the next step and to build a pro forma based on your estimate of $4.75 million.
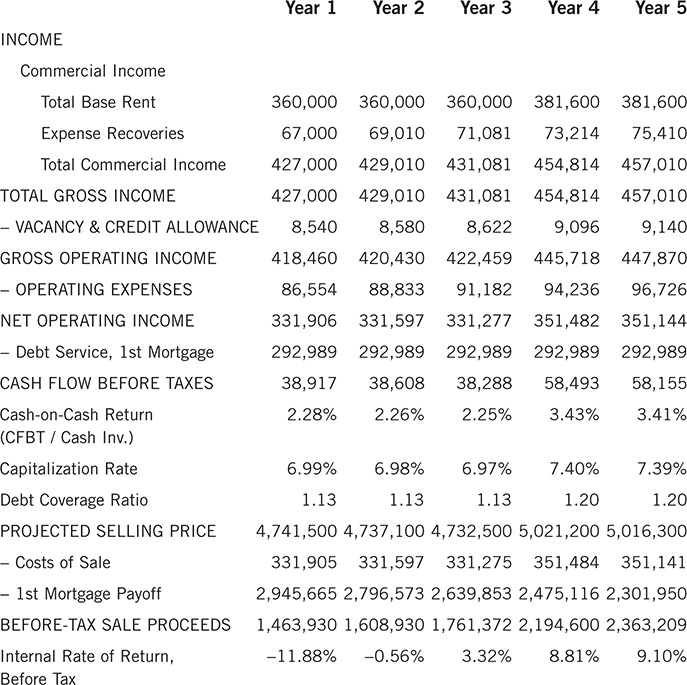
As in the previous cases, your initial focus moves to the cash flow line. Here you see that the cash flow is positive, but the 2.28% cash-on-cash in the first year does not suggest a particularly robust return. The debt coverage ratio grabs your attention next, and you find that number especially disconcerting. At 1.13, it falls far short of the 1.25 that the lender requires. That means you are unlikely to secure the mortgage financing you plan to apply for: 65% of $4,750,000 ($3,087,500), 5% interest, 15-year term. You revisit this loan with your lender. Would the lender perhaps consider a longer term, thus reducing the debt service? No. How about a lower interest rate or simply a lower DCR requirement? No and no. Dead end. What else can you do?
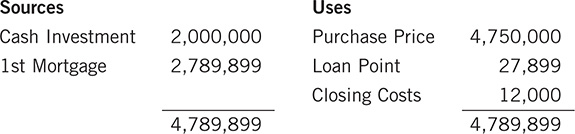
You take a look at the amount of cash required to close the deal as you’ve structured it so far: 65% LTV equates to a 35% down payment of $1,662,500 and loan amount of $3,087,500. You have to pay 1 point to secure the loan, so that equals $30,875. Your closing costs are $12,000, so in total you need $1,705,375. You realize that you have $2 million available to invest. What if you put all of it into the deal? Then you would have a smaller mortgage and lower debt service—and even your one loan point will be slightly less. To clarify this in your own mind, you construct a simple “sources and uses of funds” table:
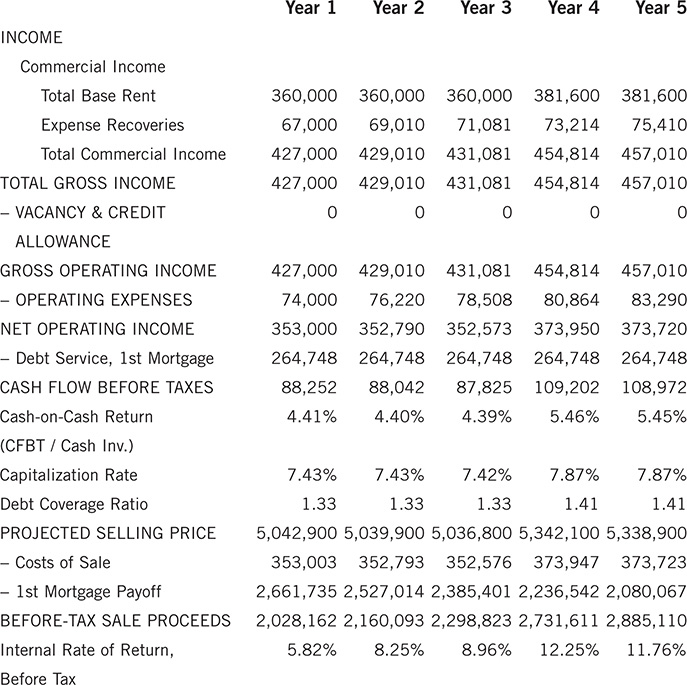
Next you rebuild your cash flow and resale pro forma to see if this larger down payment resolves your DCR concern:

You nailed it. Now the DCR is exactly 1.25 in the first year, as needed. (True confession: The author designed this story to have a happy ending, just in case the book is ever made into a movie.)
Now that you know the deal is possible, you want to decide if it’s desirable. The cash flow is a little healthier because you have less debt to pay. Your IRR is pretty dismal until the first rent increase occurs in year 4, when it reaches a more promising 8.34%.
Really? Is 8.34% worthy of consideration after the higher IRRs you saw in the previous examples? It’s time to recognize that not every investment is created equal and that reward is inextricably tied to risk. This triple-net lease investment differs from the apartment building and mixed-use property in several important ways:
• Financial stability of the tenant. Your tenant here is a national retailer and so presumably has deep pockets. That doesn’t mean there is no possibility of its going broke tomorrow, but your chances of getting paid each month, in full and on time, are significantly better than they are with your zero-star restaurant in the mixed-use property—and probably better than with some apartment tenants. In short, the odds favor a satisfactory and uninterrupted revenue stream with the national tenant.
• Length of lease. Your national tenant has committed to a long-term lease, which should give you reasonable confidence about having an interrupted cash flow over an extended investment horizon. Local business tenants might favor a shorter term, such as five years, with an option to renew. Apartment tenants typically sign one- or two-year leases. Again, the nod for long-term rent stability goes to this national tenant.
• Protection from uncertainty about expenses. Your triple-net tenant is paying virtually all your current operating expenses. Even better is the fact that it is paying your future operating expenses, which insulates you from uncertainty about situations over which you have no control, such as rising property taxes or unusual and unplanned demands for maintenance. Here again, triple-net tenancy improves your odds for a stable cash flow.
• Minimal management. If the tenant is responsible for all repairs and maintenance, and the time between turnovers is measured in decades, then you should be able to enjoy a relatively low-impact management style. With apartments, someone may contact you in the middle of the night to tell you the heat isn’t working, but that type of on-call oversight should not be necessary with a triple-net tenant.
• Likelihood of lower return. You may properly envision the conjoining of risk and reward as a law of nature. If this investment presents a lower risk than other property types, then you should expect that it will also offer a lower return. When you look at the internal rate of return in the figure above, you can see that it doesn’t climb past much beyond half of what you’ve seen with the previous properties.
As you reflect on this IRR, you recall that it includes two assumptions that might be necessary for purposes of valuation but perhaps less critical for evaluation. You have assumed that there will be a vacancy and credit loss, as well as an expense for property management; but you also know that you wouldn’t be buying this NNN property with its long-term lease to a national tenant if you thought there might be any real chance of encountering either vacancy or significant management costs. You decide to run your pro forma one last time to see the impact of removing these items.
You remind yourself that you’re stretching a bit beyond the limits of prudence by taking out vacancy and management—your wax wings might melt if you fly too close to the sun—but at the same time you’re encouraged by the possibility of the improved return. You’re now in the 8 to 9% range before the year 4 rent increase and into double digits afterward. Not bad for an investment with relatively low risk. You feel comfortable going forward if you can close the deal at this $4.75 million price.