Focus on: Inventories—Module 10
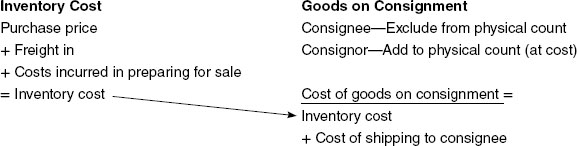
INVENTORIES
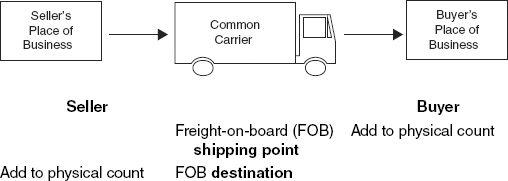
Goods in Transit
Abnormal costs expensed in current period instead of being included in inventory:
- Idle facility expense
- Wasted materials in production
- Double freight when items returned and redelivered
Cost of Goods Sold (COGS)
Beginning inventory
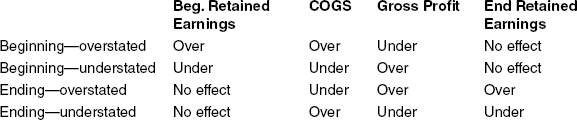
Inventory Errors
Periodic versus Perpetual
| Periodic | Perpetual | |
| Buy merchandise | Purchases | Inventory |
Accounts payable |
Accounts payable |
|
| Sell merchandise | Accounts receivable | Accounts receivable |
Sales |
Sales |
|
| COGS sold (COGS) | ||
Inventory |
||
| Record COGS | Ending inventory (count) | |
| COGS (plug) | ||
Purchases (net amount) |
||
Beginning inventory (balance) |
First in, first out (FIFO)—Same under either method
Last in, first out (LIFO)—Different amounts for periodic and perpetual
Average—Different amounts for periodic and perpetual
Inventory Valuation Methods
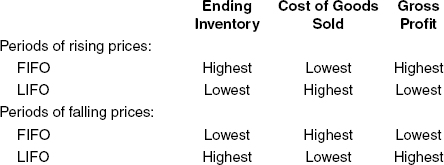
FIFO Application—Valuing Cost Of Sales and Ending Inventory
The earliest purchased goods are assumed to be sold first
Cost of sales and ending inventory values are identical under perpetual and periodic methods
Example: Beginning inventory = 0; Ending Inventory = 15,000
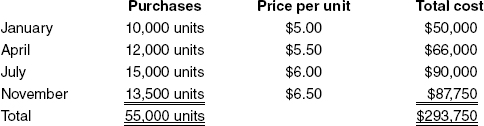
Calculate the value of ending inventory and cost of sales:
Ending inventory = 15,000 units (given) = November 13,500 units × $6.50 + July 1,500 units × $6.00 = $96,750 (ending inventory consists of the latest purchased units).
Cost of sales: Total available – Ending inventory = $293,750 − 96,750 = $197,000
LIFO Application—Valuing Cost of Sales and Ending Inventory Using the Periodic Method
The earliest purchased goods are assumed to be sold last
Cost of sales and ending inventory values are different under perpetual and periodic methods
Example of periodic method: Beginning inventory = 0; Ending Inventory = 15,000

Calculate the value of ending inventory and cost of sales:
Ending inventory = 15,000 units (given) = January 10,000 units × $5.00 + April 1,500 units × $5.50 = $58,250 (ending inventory consists of earliest purchased units)
Cost of sales: Total available – Ending inventory = $293,750 − 58,250 = $235,500
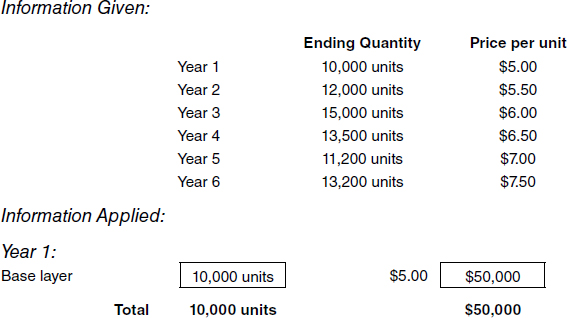
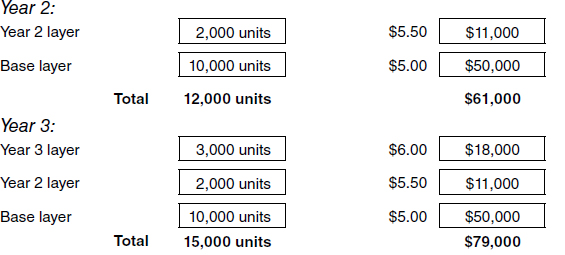
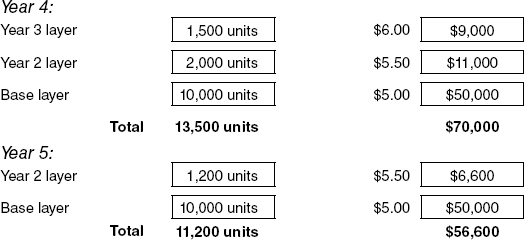
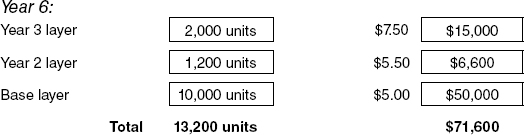
Applying LIFO Layers
For each layer:
Inventory quantity × Price per unit = Inventory value
Application of LIFO
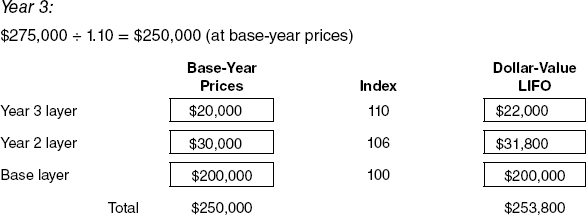
Dollar-Value LIFO
Less cumbersome than LIFO for inventory consisting of many items
Combines inventory into pools
Increases in some items within a pool offset decreases in others
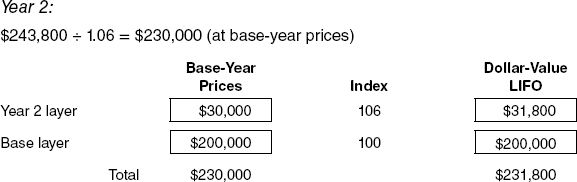
Applying Dollar-Value LIFO
For each layer:
Application of Dollar-Value LIFO
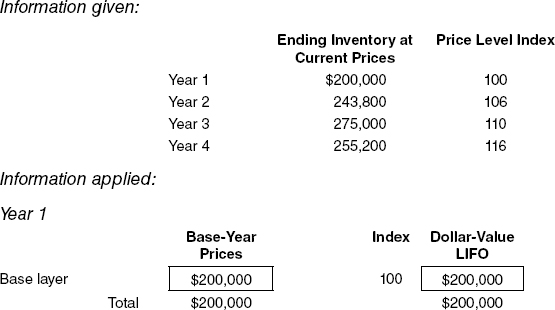

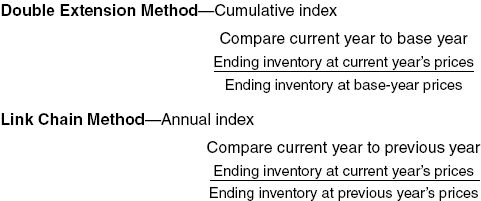
Dollar-Value LIFO—Calculating a Price Level Index
Simplified LIFO—Company uses a published index
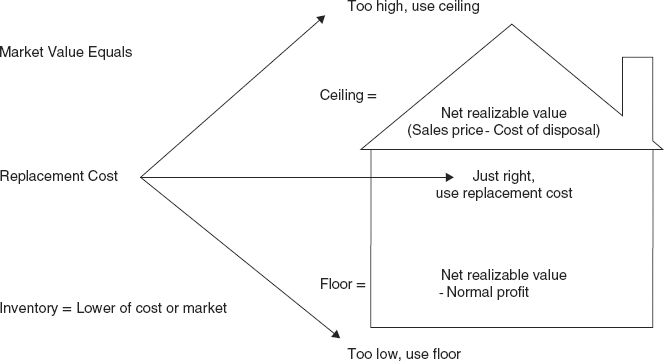
Lower of Cost or Market
Gross Profit Method for Estimating Inventory

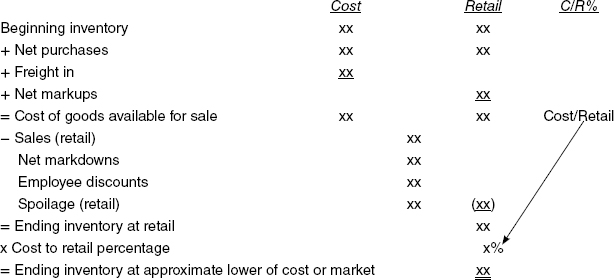
Conventional Retail (Lower of Cost or Market)
IFRS: Inventory
- LIFO not permissible
- Lower of cost or net realizable value (LCNRV) on item-by-item basis
- Biological assets carried at fair value less costs to sell at the point of harvest
LONG-TERM CONSTRUCTION CONTRACTS
Percentage of Completion
Use when:
- Estimates of costs are reasonably dependable
- Estimates of progress toward completion
Reporting profit
- Recognized proportionately during contract
- Added to construction in process
Balance sheet amount
- Current asset—Excess of costs and estimated profits over billings
- Current liability—Excess of billings over costs and estimated profits
Calculating profit
| Contract price | xxx | |
| Total estimated cost | ||
Cost incurred to date (1) |
xxx | |
Estimated cost to complete |
+ xxx | |
Total estimated cost (2) |
− xxx | |
| Total estimated profit (3) | = xxx |
Costs incurred to date (1) ÷ Total estimated cost (2) = % of completion (4)
% of completion (4) × Total estimated profit (3) = Estimated profit to date (5)
Estimated profit to date (5) – Profit previously recognized = Current period’s profit
Recognizing Losses
When loss expected:
Estimated loss |
xxx |
| + Profit recognized to date | xxx |
| = Amount of loss to recognize | xxx |
Completed Contract
Income statement amount
- Profit recognized in period of completion
- Loss recognized in earliest period estimable
Balance sheet amount
- Current assets—Excess of costs over billings
- Current liabilities—Excess of billings over costs
IFRS Construction Contracts
- Prohibit completed contract method