
Think of assembly language as an arcane text on a stone tablet from an ancient civilization that holds the secret to the fight against evil ghosts in the machine. As you might imagine, before incanting any of your own creations, you first have to understand the alphabet symbols and essential vocabulary of this language. Once you learn to decipher the existing codes, you can be confident about understanding the semantics of what is already written. Thereafter, etching your own ideas will require more investment of your time to understand the nuances of this language and that will happen only when you start writing in code. A little goes a long way, and getting your hands dirty is the primary way that learning can occur.
Let's write a basic console-based C program in Visual Studio C++ 2008 Express Edition, which is a free download from Microsoft, and compile it. Create a new Win32 Console project, type the following code in its entirety, and press F5 to run it. We will dive straight into understanding the code while it is running in a debugger and the associated concepts that are paramount to this process. Quite a lot of things might be unfamiliar, but it's best to get an overall feel before we dive into the details, which we will delve into step by step:
1 /*C program to check the endianness of the environment on which this program is running and display the summation of two integers using inline assembler.*/
2
3 #include "stdafx.h"
4 #include <conio.h> // for getch();
5 #pragma region DemoProgram
6 /*Declaration of a custom bool type of size 1 byte*/
7
8 #ifndef __cplusplus
9 typedef char bool
10 #define true 1
11 #define false 0
12 #endif
13
14 //function definition for endian-checking, returns a bool
15
16 bool endian_chk(int v){
17 int * endcheck=&v;
18
19 /*declaration of pointer-to-char temp and type casting of an int pointer to access the byte value at the address*/
20
21 char * temp=(char *)endcheck;
22
23
24 return *temp ? true:false ;
25 }
26
27 int main(int argc, char * argv[])
28 {
29 int a=1;
30 int b=7;
31 int c=0;
32
33 //declaration of symbolic constants for 0 & 1
34
35 enum {BIGENDIAN, LITTLEENDIAN};
36
37
38 bool endianFlag; //instance of bool type
39
40 //pointer-to-integer,endcheck has the value of the address
//of the variable a
41
42
43 if (endian_chk(a)) { /* function call with a bool return
value */
44 endianFlag =true;
45 printf("%d
",LITTLEENDIAN); //using symbolic constants
//which are integers
46 printf("Little Endian
");
47 }
48 else {
49 endianFlag=false;
50 printf("%d
", BIGENDIAN);
51 printf("Big Endian
");
52 }
53
54 /*Inline assembler within braces, use double underscore (single works too on VS 2008)*/
55
56 __asm {
57
58 mov eax, a; ; copying value at address of a to register eax
59 add eax,b; ; adding the value at address of b to eax
60 mov c, eax ; copying the sum total to address of c
61
62 }
63
64 printf("%d
",c); //display the value of c
65
66 getch(); /* wait for user input for commandline display
persistence */
67 return 0;
68 }
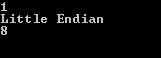
69 #pragma endregionThe output would be as follows:
To familiarize yourself with the various debug views and disassembly as well as the register and memory views, you need to restart the program (Shift + F5). Put a breakpoint (F9) in the IDE left-handside pane.
Breakpoints appear as red gradient colored balls. Their purpose is to halt execution when that line of code is executed.

In VC++ 2008, press Alt + 8 or go to Debug | Windows | Disassembly to open the disassembly with the source tab. Press Alt + 5 and Alt + 6 in succession to open the register (Debug | Windows | Registers) and memory (Debug | Windows | Memory) views. If you need more memory views, press Ctrl + Alt + M with 2/3/4 (Debug | Windows | Memory) to get up to four different memory windows.
The debug menu contains quite a good set of features that enable you to do assembly-level and source-level debugging. Let us examine how the program executes and watch the code views that we are interested in.
Set the breakpoint right at the outset from the starting brace of main (int argc, char * argv[]). You can arrange the screen panes to accommodate the different views.
Take a good look at some of the Debug menu items:
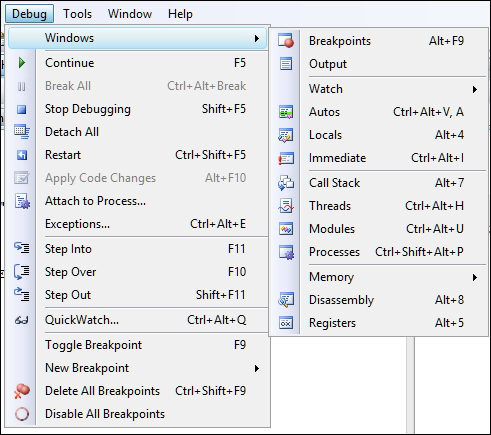
The VC++ debugger is the tool using which we will examine the execution instruction by instruction. The main features that we will use for this exercise are Step Into (F11) and Step Over (F10). For library function calls, we will press F10 to Step Over the function and reach the next instruction, thus saving time so that we don't spend time on redundant areas of our compiled application. You can always restart the debugging process by pressing Ctrl + Shift + F5. Further, #pragma region <name> and #pragma endregion are two directives to Visual Studio to enable the grouping of code regions and collapse or expand them as needed in the IDE.
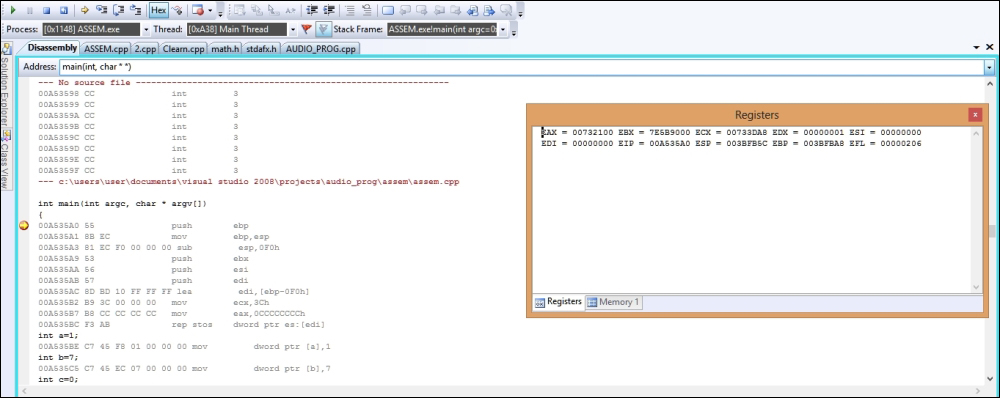
Let us examine the statement excerpts in the following disassembly shown; your address ranges may be different from this excerpt as the Windows loader (the Windows operating system code that maps the executable to the process memory and executes the main thread) decides where to relocate or load the running process. Note that the following listings given are in the format of <memory address> <hex opcodes> <disassembly text>, and on some preceding versions of VC++ 2008, the Show Code Bytes option is not enabled by default:
00A535A0 55               push        ebp
00A535A1 8B EC            mov         ebp,esp
00A535A3 81 EC F0 00 00 00 sub         esp,0F0h
00A535A9 53               push        ebx
00A535AA 56               push        esi
00A535AB 57               push        edi
00A535AC 8D BD 10 FF FF FF lea         edi,[ebp-0F0h]
00A535B2 B9 3C 00 00 00   mov         ecx,3Ch
00A535B7 B8 CC CC CC CC   mov         eax,0CCCCCCCCh
00A535BC F3 AB            rep stos    dword ptr es:[edi]
int a=1;
00A535BE C7 45 F8 01 00 00 00 mov         dword ptr [a],1
int b=7;
00A535C5 C7 45 EC 07 00 00 00 mov         dword ptr [b],7
int c=0;
00A535CC C7 45 E0 00 00 00 00 mov         dword ptr [c],0
The following instruction sequence is called function prologue:
push        ebp
mov         ebp,esp
sub         esp,0F0h
A function in C/C++ programming borrows from mathematical concepts and is a block of code delimited within a scope by using curly brackets in which an input is processed to provide an expected output. In C/C++ programming, such functions have the following signature or declaration:
<return type> <function name> (parameter(s)<type, identifier>);
Disassembly text in most disassemblers is formatted in the following manner:
<memory address> <hexadecimal opcodes> <instruction> <comments/info>
Let's now examine the first instruction from the preceding listing:
00A535A0h is the memory address of this instruction when it is executed in the user mode memory. The address is a 32-bit number as it has 4 bytes or 8 hexadecimal digits.
55h is the Intel opcode in hexadecimals for push ebp. Opcodes are binary codes for a specific instruction as designed by the vendor of the microprocessor. Refer to the Intel Software Developer's Manual for a detailed description of each instruction and its opcodes.
push epb saves the value in the Extended Base Register. This is to persist the value of the current stack frame base pointer before building a stack. Why you ask? In order to restore the execution after entering and exiting a function. To fully grasp this you have to understand the stack data structure and how Windows exposes system memory. A data structure is the method or organization of data elements in computer memory. Computer memory is abstracted to the running program and exposed as data structures or storage spaces provided by the operating system. The stack and the heap are two popularly implemented data structures provided by Windows to any user mode program in the address space. The stack is like a readily available scrapbook for function-related memory as, after the function scope is closed, the stack frame created for the function is destroyed. A heap is dynamically allocated memory for larger memory requirements during execution, which is normally implemented as doubly linked lists. Heaps are an interesting research topic as various algorithms are created to make optimum use of this data structure without fragmentation or performance issues.

We briefly mentioned that the address of the above instruction is a 32-bit number, so according to the provisions available in Windows, a 32-bit user mode program will have 4 GB of memory as its usable area, out of which 2 GB or 3 GB is used for address extension and the rest is used by the Windows kernel. By design, 32-bit memory addresses above 0x7FFFFFFF are used by Windows. The stack is a LIFO data structure, or a Last-in-First-Out data structure, like a spring-loaded pistol magazine where the last bullet to be loaded gets to exit first. In order to store into the allocated space, the top slot needs to move down or be pressed by the shooter to reach the base so that the first bullet can take its seat. A push operation pushes the element inside the stack, and a pop operation removes it from the stack. Ignore the spring mechanisms of the magazine and understand the process of how elements go in and the order in which they come out; in the case of stack memory, the values already pushed do not slide up and down on every push, and thus, every pushed address on the stack is static in that sense and a value is taken off the stack by using only a pop instruction. Another very common analogy is a stack of plates, which may be more accessible as there is no inter-movement while having the same net effect. Similarly, the next instruction sets the base to the top of the stack ESP or Extended Stack Pointer:
mov ebp,esp
This effectively collapses the stack structure at the start after which a value that is calculated by the compiler is subtracted to allocate space for any local variables and related data types:
sub esp,0F0h
Subtraction from esp will result in the stack growing towards lower memory addresses. Adding the value post function scope will collapse the stack by moving towards higher addresses:
push        ebx
push        esi
push        edi
lea         edi,[ebp-0F0h]
mov         ecx,3Ch
mov         eax,0CCCCCCCCh
rep stos    dword ptr es:[edi]
The 3 push instructions store the values in the stack by means of pushing the values into the stack space just created. The next set of instructions are not directly related to the source as it is boilerplate code inserted by the compiler to manage the buffers and initialize 0x(3C*4) = 0xF0 bytes of memory to dword values of 0xCCCCCCCC, starting from the stack frame size offset from EBP, thus covering the entire allocated stack. rep stos or repeat till ecx register is not zero and stores string bytes from the location at EDI, which is the earlier top of stack location (EBP-0F0). The direction is lower to higher addresses by default (this is set in the directional flag, or DF, in the ELFAGS register):
    25: int a=1;
00A535BE C7 45 F8 01 00 00 00 mov         dword ptr [a],1
    26: int b=7;
00A535C5 C7 45 EC 07 00 00 00 mov         dword ptr [b],7
    27: int c=0;
00A535CC C7 45 E0 00 00 00 00 mov         dword ptr [c],0
Three integer data types are assigned by copying immediate values (1,7,0) to their variable memory addresses, which are square bracketed meaning "at the location" of the address of a. The dword ptr directive means that 4 bytes are stored at a time (the int data type is 4 bytes in Intel processors). The word immediate value means that they are a part of the opcode sequence. If you look at the opcode patterns, C7 45 F8 01 and C7 45 EC 07, the values 01 and 07 in hexadecimals are clearly visible. The rest of the opcode patterns will be investigated as we progress:
if (endian_chk(a)) {
00A535D3 8B 45 F8         mov         eax,dword ptr [a]
00A535D6 50               push        eax
00A535D7 E8 FA DB FF FF   call        endian_chk
00A535DC 83 C4 04         add         esp,4
00A535DF 0F B6 C8         movzx       ecx,al
00A535E2 85 C9            test        ecx,ecx
00A535E4 74 36            je          main+7Ch (0A5361Ch)
Consider the following instruction:
mov eax,dword ptr [a]
In this case, the value at the location of the variable is copied to the EAX register:
push eax
Thereafter, the value is stored on the stack.
Let us undertake an opcode analysis as a short detour to understand the process. The following snapshot illustrates the jump thunk table for external library functions. In our case, this table is created by the linker for the C standard library as you might have guessed from the function names. The memory addresses change on every run; hence, it must be taken as an instance from which you can corroborate your live session:

For this particular run, you can set a breakpoint at the call instruction:
call endian_chk ()
Then, press F11 to STEP-IN into the jump thunk table to reach an area in memory that is displayed by Visual Studio in a similar fashion to what was mentioned earlier. You will find that the call goes through a thunk table or an import gateway. A thunk is a connecting bridge between calls to a function address and the actual function address. This can be seen in the memory window as you can type the address 0x011511D6 in the memory address box and see a series of similar byte patterns for every DWORD length. 0xE9 is a byte that recurs every 5 bytes. These hexadecimal bytes are instructions for unconditional jumps or the jmp instruction. Let us examine the opcode sequence at address 0x11511D6 for the function call to endian_chk(). Since 0xE9 occurs as the most consistent byte value, and going by convention, the first opcode can be taken a first glance as the main opcode for a jump instruction. The only bytes that vary are the two bytes next to 0xE9. Finally, the last two bytes are also uniformly 0x00 00.
0xE9 85 23 00 00 are the 5 bytes in question.
We can deduce that since the whole list is basically a jump list, the opcode length is 5 bytes. Remember that, by convention, each instruction is displayed in its own line and is atomic. If you see the jump destination address near the function name endian_chk(), it is 0x1153560. So how is the destination address encoded in the opcode sequence you ask? To deduce that, let us take the difference between the two addresses, namely the current address where the EIP points to and the destination address where the EIP will be directed. Here, the destination address is the larger value; hence, it is a positive jump towards higher addresses and not a negative jump towards lower addresses. Hence, (0x1153560 – 0x11511D6) = 0x238A.
Now, examine the opcode sequence. Does this number occur inside anywhere? You will see that the digits 0x85 23 occur in 0xE9 85 23 00 00. You might wonder that this looks quite similar to 0x 23 8A. The difference value is in bytes, and the opcode data types are in little-endian. Hence, we read the opcode value 0x85 23 as 0x23 85 from right to left for a WORD. Take the difference again between your deduced value and the value shown in the opcode. Thus, (0x238A – 0x2385) = 5, which is the length of the opcode sequence. So, this opcode encodes the number of bytes to transfer control to in a linear address space of the process memory for a positive jump direction from the address in EIP, adding the length of the opcode sequence as the starting point. Thus, the distance of 0x2385 bytes is correct. Notice how the value is a relative one and not absolute. The benefit of having a relative displacement is that if the code is relocated in the process memory, the distances are still the same. The IA-32 architecture does not allow direct access (read/write) to the EIP register, and if we need to find out the current EIP, we can use the code sequence in VC++:
  _asm {
call foo  ; foo is a label
foo:
      pop eax
}
Notice the value at the top of the stack (pointed to by the ESP register) and the value of the EIP register.

Given our primary deduction from byte lengths, the concepts of short jump, near jump, and far jump might make sense. A two-byte displacement value can provide 2^16 – 1 values, which, if taken as a signed number for implementing bidirectional jumps (positive and negative). Values of -32768 to 32767 will be possible either way as signed numbers are represented as a 2's complement encoded type. If 2 GB is the linear address space that can be traversed, two bytes are enough for small programs, but longer distances will need a larger type. Further, 0x00 00 bytes will be used to provide for additional byte ranges as interpreted by the compiler for far jumps, which make use of the code segment register and the EIP.
Now, we will resume our program analysis for our original address space disassembly listing, here, a call instruction to the endian_chk() function, which starts at address 0x00a53560.
Here, the call instruction pushes the address of the next instruction in line, so that an RET instruction from the function stack while exiting from the collapsed stack will return next to the current call instruction so that the execution is resumed as expected and the control flow is maintained. The control is then transferred to the endian_chk() function address.
This function takes one integer value and returns BOOL, which is custom typed to be CHAR:
bool endian_chk(int v){
00A53560 55               push        ebp
00A53561 8B EC            mov         ebp,esp
00A53563 81 EC D8 00 00 00 sub         esp,0D8h
00A53569 53               push        ebx
00A5356A 56               push        esi
00A5356B 57               push        edi
00A5356C 8D BD 28 FF FF FF lea         edi,[ebp-0D8h]
00A53572 B9 36 00 00 00   mov         ecx,36h
00A53577 B8 CC CC CC CC   mov         eax,0CCCCCCCCh
00A5357C F3 AB            rep stos    dword ptr es:[edi]
    13: int * endcheck=&v;
00A5357E 8D 45 08         lea         eax,[v]
00A53581 89 45 F8         mov         dword ptr [endcheck],eax
    14:
    15: /*declaration of pointer-to-char temp and type casting of an int pointer to access the byte value at the address*/
    16:
    17: char * temp=(char *)endcheck;
00A53584 8B 45 F8         mov         eax,dword ptr [endcheck]
00A53587 89 45 EC         mov         dword ptr [temp],eax
    18:
    19:
    20: return temp ? true:false ;
00A5358A 83 7D EC 00      cmp         dword ptr [temp],0
00A5358E 0F 95 C0         setne       al
    21: }
The familiar stack frame prologue is seen. The buffer space allocation size is set to the value of 36h * 4 bytes or 0xD8 bytes, which is the stack frame's allocated size at the outset.
Notice how the C pointer declaration and assignment are compiled:
    13: int * endcheck=&v;
00A5357E 8D 45 08         lea         eax,[v]
00A53581 89 45 F8         mov         dword ptr [endcheck],eax
Load Effective Address, or LEA, stores the memory address of the source operand [v] to the EAX register. The square brackets are not meant to deference the address for this particular instruction. This is because memory-to-memory assignment is not supported by the Intel architecture.
The address at EAX is then copied to the address of the endcheck pointer variable of the C type int; hence, the full size of the EAX register of 4 bytes is used:
    17: char * temp=(char *)endcheck;
00A53584 8B 45 F8         mov         eax,dword ptr [endcheck]
00A53587 89 45 EC         mov         dword ptr [temp],eax
Typecasting the temp pointer to the char variable results in copying the memory address of endcheck to the address allocated for temp via an EAX register:
    20: return temp ? true:false ;
00A5358A 83 7D EC 00      cmp         dword ptr [temp],0
00A5358E 0F 95 C0         setne       al
A comparison is done for the conditional statement by using the cmp instruction, which does a non-destructive subtraction and sets the Zero flag, or ZF, in the EFLAGS register to 1 if the result is 0. Thus, if the value at the temporary address after dereferencing (using square brackets) is equal to zero, set the value of AL or the lower 1 byte of the 16-bit AX register (composed of AH and AL) to 1.
The purpose of this function is to check the endianness of the execution environment by using an integer input value where the least significant byte, or LSB, of the integer input has the value of 0x01. Then, if the machine is little-endian, the LSB will be stored first at the lower address and the bytes will be flipped as the most significant bit or MSB will be stored last. Thus, if the flipping did occur, the value at the address that is dereferenced of a byte size must have the value of 0x01 from the previous assignment. In C, any value greater than 0 is true and 0 is false; hence, the motivation for using 1 as a test value.
If the input value is stored in little-endian, the byte pattern of the integer value or a DWORD (4 bytes) will be stored as 0x 01 00 00 00, whereas the actual pattern is 0x 00 00 00 01. However, if the machine word values are stored in the big-endian format, then the value returned will be 0 because the MSB is stored first. This is a well-documented technique with ostensible credits to SNDAN programmers.
The rest of the function is the stack frame collapsing code and restoration of stored register values at the onset of the function prologue. Notice now the EBP value is copied to ESP, effectively destroying the stack and popping the value off to EBP, which will be the saved EBP value of the frame of the calling function. Finally, RET transfers control to the address at ESP, which was stored earlier when the call to this function was made by the caller's call instruction:
  21: }
00A53591 5F               pop         edi
00A53592 5E               pop         esi
00A53593 5B               pop         ebx
00A53594 8B E5            mov         esp,ebp
00A53596 5D               pop         ebp
00A53597 C3               ret
Right after the call instruction, this is the instruction that we returned to from endian _chk():
add esp,4
The fact that the caller is cleaning the stack means that the calling convention used by the compiler is the cdecl (C declare) calling convention. In this calling convention, the arguments are pushed on the stack from right to left and the caller has to clean the stack frame. In Windows, the stdcall (standard call) calling convention is implemented where the parameters are pushed from right to left, but the callee or the function called cleans the stack by using an operand version of RET among other approaches.
In our case, the function takes one integer or 4 bytes as a parameter; hence, 4 is added to ESP. Thus, depending on the data type, the number of arguments passed can be calculated by dividing the size added to ESP by the size of the argument's data type. Other calling conventions of note are fastcall and thiscall. fastcall takes the first two arguments (left to right) and sets them to ECX and EDX and pushes the remaining arguments to the stack. thiscall takes the this pointer in ECX and behaves just like stdcall for the rest. It is good to have a look around other compilers as well, such as GCC, which have a slightly different way of doing things. Refer to https://en.wikipedia.org/wiki/X86_calling_conventions for more information:
movzx       ecx,al
test        ecx,ecx
je          main+7Ch
Here, the byte is zero extended to the ECX register, while retaining the value of 1, and ECX is checked for the value of 0. If AL has 01h, then the leading zero will be copied all the way to the left, and therefore, ECX will contain 0x00 00 00 01. The test instruction does a bitwise AND to set the ZF to 1, if 0 is the verdict. Any non-zero value will fail the is-equal-to-zero test as AND'ing any value with 0 will result in 0, and any bit position set to 1 will result in the ZF not being set. If the value is 0 for big-endian, the else statement will be executed.
The value of endianFlag is set to 1. Notice the byte ptr directive to reference the address at endianFlag up to a data size of 1 byte, where 1 is copied. The C standard library function called printf() is fed a format string for decimal output and a newline escape character with the enum value LITTLEENDIAN. Notice that the compiler replaces the constant identifier for LITTLEENDIAN with the immediate value of 1:
mov         byte ptr [endianFlag],1

    41:     printf("%d
",LITTLEENDIAN);

mov         esi,esp
push        1          ; the enum value LITTLEENDIAN
push        offset string "%d
" (11B5808h)  ; format string
call        dword ptr [__imp__printf (11B82C0h)]
add         esp,8
cmp         esi,esp
call        @ILT+315(__RTC_CheckEsp) (11B1140h)
The two parameters are pushed to stack; the enum integer value and the format string offset, which is again a 4-byte address. Then, a call is made via the jump thunk table (a library function call gateway address list or imports). The caller clears the stack as 8 bytes are added to ESP; recall that the number of arguments pushed is 2, and hence, the value is 8 this time:
mov esi, esp
and the sequence
cmp         esi,esp
call        @ILT+315(__RTC_CheckEsp) (11B1140h)
Preceding is the stack frame integrity, which are implemented as a comparison between the old esp value stored earlier in the asm sequence of mov esi, esp before the cmp esi, esp instruction. So, if the comparison is successful, the _RTC_CheckEsp() function just returns, and the execution continues as expected or else it carries on with the _RTC_Failure() function:
_RTC_CheckEsp:
00081540 75 01            jne         esperror (81543h)
00081542 C3               ret
esperror:
00081543 55               push        ebp
00081544 8B EC            mov         ebp,esp
00081546 83 EC 00         sub         esp,0
00081549 50               push        eax
0008154A 52               push        edx
0008154B 53               push        ebx
0008154C 56               push        esi
0008154D 57               push        edi
0008154E 8B 45 04         mov         eax,dword ptr [ebp+4]
00081551 6A 00            push        0
00081553 50               push        eax
00081554 E8 64 FC FF FF   call        _RTC_Failure (811BDh)
00081559 83 C4 08         add         esp,8
0008155C 5F               pop         edi
0008155D 5E               pop         esi
0008155E 5B               pop         ebx
0008155F 5A               pop         edx
00081560 58               pop         eax
00081561 8B E5            mov         esp,ebp
00081563 5D               pop         ebp
00081564 C3               ret
00081565 CC               int         3
00081566 CC               int         3


    50: /*Inline assembler within braces, use double underscore (single works too on VS 2008)*/
    51:
    52: __asm {
    53:
    54: mov eax, a;   ; copying value at address of a to register eax
011B3650 8B 45 F8         mov         eax,dword ptr [a]
    55: add eax,b;    ; adding the value at address of b to eax
011B3653 03 45 EC         add         eax,dword ptr [b]
    56: mov c, eax    ; copying the sum total to address of c
011B3656 89 45 E0         mov         dword ptr [c],eax
    57:
    58: }
You have used inline assembler or the assembly code inserted into and amidst the C/C++ code. You use the __asm keyword along with the assembly mnemonics within opening and closing braces in individual lines (GCC/mingw uses – asm("jmp %eax"); with AT&T syntax-prefixing registers with % and immediate with $, source before the destination operand (the reverse of the Intel syntax) For our purposes, we will focus exclusively on the Intel syntax that does not follow the described peculiarities.). For integer variable value summation, we see that the value at the address of variable a is copied to the EAX register as DWORD. EAX's value is added to the value at the address of variable b, whose value is copied from EAX to the address of variable c. Notice that the compiler has not optimized or removed any instruction and kept the instructions as is.
Something even experienced developers sometimes get confused about is operators versus functions in a native compiled language such as C/C++. The difference between the two is that operators are compiled in place by the compiler, whereas functions are compiled with a separate function prologue and epilogue, as well as a call instruction to the beginning address of the function. Observe the C code and the disassembled instruction sequence for the sizeof() operator:
typedef struct _sequence {
  char * seqname;
  unsigned int range;
  unsigned int fib [];
}Seq;

Seq *ptrSeq;

  ptrSeq=(Seq*)malloc(sizeof(Seq));

00E6142E 8B F4            mov         esi,esp
00E61430 6A 08            push        8
00E61432 FF 15 C8 82 E6 00 call        dword ptr [__imp__malloc (0E682C8h)]
Structs are memory aligned, and padding bytes will ensure that 4-byte multiples are used even if a single character variable exists in the struct. If you use just the uninitialized array unsigned in fib[] in the struct, sizeof() will return 1.
The rest of the code disassembly can be easily deciphered at this stage, and you should complete it. You have not yet gone over the binary format called the Portable Executable format, or PE, from Microsoft. All Microsoft Windows executables (.exe) including dynamic link library files (.dll), device drivers (.sys), screen savers (.scr), and control panel applets (.cpl) share the same format. However, at this stage, it is not required as we are focused on assembly programming and source code disassembly analysis, but this is just an indicator of what is ahead. While we have analyzed the program in one pass, introducing concepts as we progress, assuming you have prior knowledge of the essentials such as the stack and register types, it might have not made sense if you are new to all this. Do not fret; that is exactly what the previous paragraphs were acting like a screening test for the bare essentials. If you understood all of what you just read, then you have earned yourself a pat on your back, particularly if you are relatively new to malware analysis. If not, then please read on and reread the code and perform the debugging session until each line is clear to you (or most of it, excluding the PE format-related parts, as will be discussed in later chapters).