Redline from Mandiant is a one-stop shop and a poor man's malware forensic utility, all-in-one useable interface. If you compare Redline with other forensic software such as Encase, FTK, or Oxygen Forensics, which are used heavily in law enforcement circles, you will notice that the priorities are somewhat different. Malware is the only agenda for Redline! Redline analyzes Windows OS from the memory capture and the filesystem, identifies Indicators of Compromise (IOC), builds a timeline of events, and computes a Malware Risk Index (MRI) score. It can also use a whitelist of MD5 hashes to identify known and valid files and further aid in reducing noise in the collected data. However, beyond memory analysis and visualization, it does not perform data recovery options, is not multi-platform, and doesn't work for mobile devices natively as of yet.
Installation is a breeze! You execute the downloaded Redline.msi package from http://www.mandiant.com/resources/downloads/ and ensure that you have .NET 4 installed. The default path for installation is C:Program Files(x86Redline.
Redline works using three collector types, which are scripts to collect data from the potentially compromised system (you can also use Redline on a virtual machine; however, the performance suffers). All three modes require a memory image to work with.
You are recommended to use an external portable drive to save the redline collector package to, while configuring the Standard and Comprehensive Redline Collectors.
- The Standard Collector collects the minimum amount of data to complete the analysis and generate an MRI score.
- The Comprehensive Collector gathers the maximum amount of data and is recommended if you want to perform full analysis or are only getting a single opportunity to do so on your target system.
- The IOC Search Collector seeks to find selected IOCs only and it filters out the rest. This procedure can be performed with the other two modes as well and is not an isolated process.
On choosing any one of the collectors, you get to select from a plethora of options relating to memory, disk, system, network, persistence mechanisms/tasks, and so on. These options will compile down to your script settings that will be deployed in the external USB drive for memory acquisition and analysis. You are advised to check the Acquire Memory Image checkbox for more accuracy.

In the resulting script folder, you see the file structures shown in the following image:

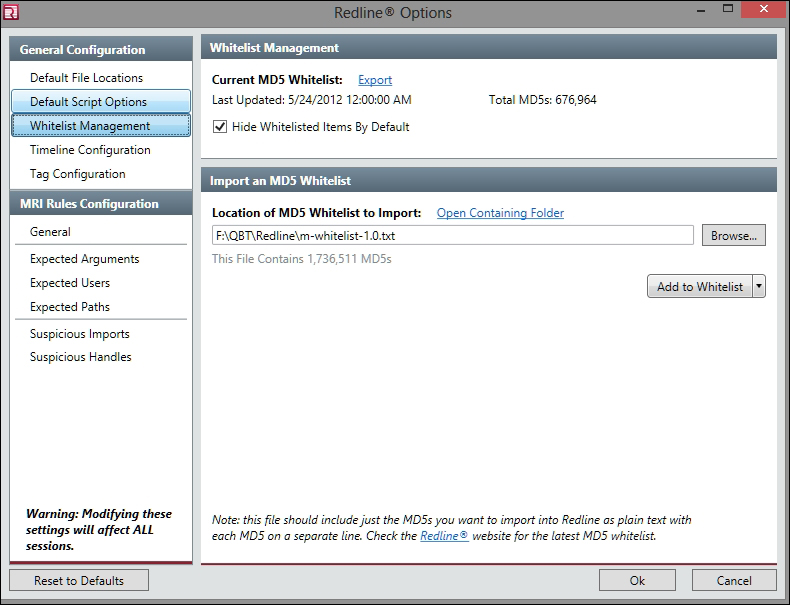
You begin by executing the RunRedlineAudit.bat script. You require Administrator privileges, which Redline manages on its own most of the time. You can connect the USB inside a virtual machine, disconnect it from the host machine, and start the script to work on the vm guest memory. This will be a bit slow, but it certainly works. The other quicker method is to simply pause the virtual machine and feed the path of the snapshot file (.vmem) to Redline via Analyze a saved memory file. Before you commence with your analysis and acquisition, you can download the m-whitelist text file that contains the MD5 hashes of the whitelisted applications that will be ignored in the analysis. You can add your own by simply writing an MD5 string every new line. This can be done via the Options menu. This menu holds some very useful configurations and it is recommended that you spend some time understanding the various options you have, even as default works fine.
For instance, mutants are a Windows kernel based mechanism to create named objects for synchronization purposes. Often, a malware will create a particular mutex string in order to ensure that only one running instance of itself can be executed. You can ameliorate the handles checking by using the list at: http://hexacorn.com/examples/2014-12-24_santas_bag_of_mutants.txt.

The Default File Locations must be excluded from the anti-virus product scans. When performing acquisitions or extracting process memory (as a final zip file in the default locations path with password safe) from the session file, these regions will be used so they must not be interfered with.

So, let us commence the analysis of the loaded sessions. Inside the scripts directory are sequentially numbered sessions where you look for the file with a .mans extension. Open it and explore the different views in Redline.
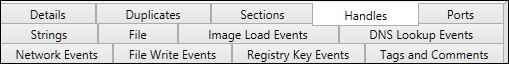
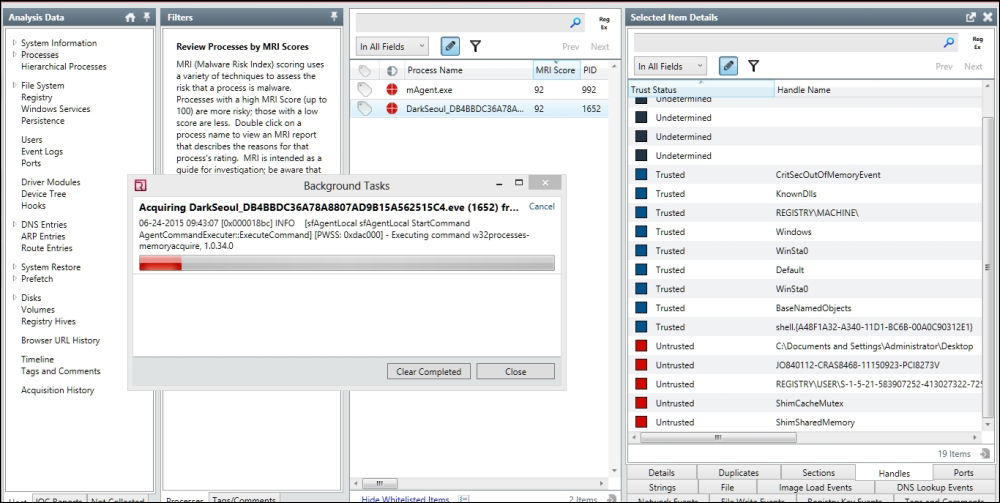
In the following image, the Malware Risk Index for Dark Seoul is 93, which, on a scale of 0 -100, we can confidently say is malicious. You also see a pie graph of the negative and positive points that identify the suspicious processes and why so as a consolidated summary. The tabs at the bottom provide specific kinds of details, such as Strings, Sections, Ports, and so on, as shown in the next image:
The MRI score for Dark Seoul:

Extracting memory regions of this process (right-click the process name and choose to acquire the memory):
The resulting file is a password-protected memory dump zip file.
Thereafter, the rest is all about how you look at the data and infer your analysis details from it.
http://www.openioc.org/ is an industry collaborative effort at standardizing the malware IOC communications and this initiative is widely supported, including the support by Redline. Mandiant released the IOCe (editor) tool to work with the IOC-based xml files for generating IOC based reports. You can download the sample IOCs from the site to get a feel for it. Remember to rename the extensions to .ioc from .xml if your browser appends it, otherwise IOCe will not be able to parse it. Once you get the hang of the format, you can start with creating your own and combine Boolean operators with malware specific characteristics.

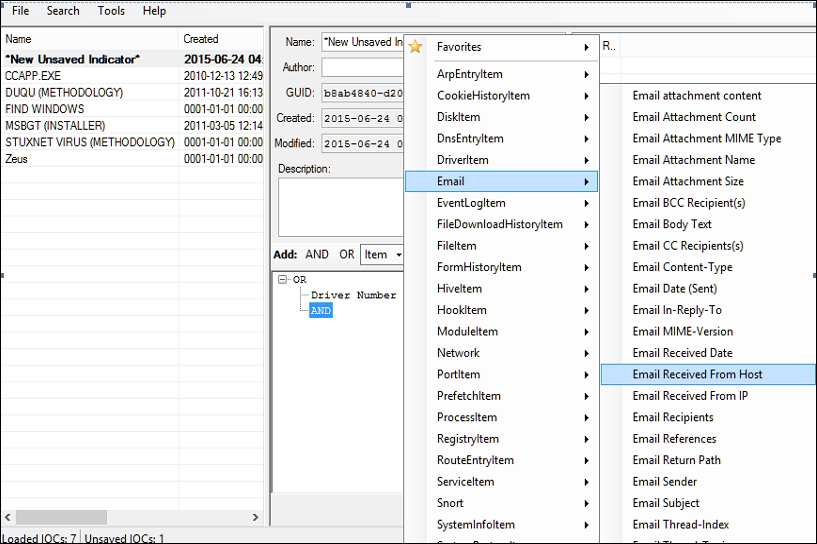
You can choose from a quite extensive list of individual elements that can comprise of an IOC signature.
To make use of IOC in reporting, click the IOC Reports tab towards the bottom left, create a new report by feeding the directory of the IOC repository (the folder where you keep all .ioc files), and start the analysis.
Redline makes malware memory forensics accessible and takes the guesswork and configuration out of the game. It is quick and easy to use, quite robust, and business ready in terms of intelligence gathering and reporting. However, it is still limited in other ways, as hinted at earlier, and you may have to use more detailed and extensible tools such as Volatility Framework for memory forensics.
Art of Memory Forensics, Michael Ligh, John Wiley & Sons is an excellent introduction to this tool. Find it at https://github.com/volatilityfoundation/volatility.
The general commands reference can be found at https://code.google.com/p/volatility/wiki/CommandReference.
More interestingly malware-specific commands are compiled at https://code.google.com/p/volatility/wiki/CommandReferenceMal23.
- Malfind: Find the hidden and injected code
- Yarascan: Scan the process or kernel memory with Yara signatures
- svcscan: Scan for Windows services
- ldrmodules: Detect unlinked DLLs
- impscan: Scan for calls to imported functions
- apihooks: Detect API hooks in the process and kernel memory
- idt: Display Interrupt Descriptor Table
- gdt: Display Global Descriptor Table
- threads: Investigate
_ETHREADand_KTHREAD - callbacks: Print system-wide notification routines
- driverirp: Driver IRP hook detection
- devicetree: Show device tree
- psxview: Find hidden processes with various process listings
Running the standalone version is recommended as you do not have to gather and configure plugin scripts as it is fully self-contained.

To pass a memory snapshot (.vmem) or a memory image, use the –f switch and then the commands. For instance,
volatility-2.3.1.standalone.exe –f <path to image> imageinfo
This is not very different from Redline in terms of the actual work done by you, as all of the commands are one liners, much like a point and click interface. The scripts implement the algorithms developed to extract and identify the memory artifacts and hence the bulk of the work is already automated for you. This can certainly be a timesaver. From Chapter 3, Performing a Séance Session, try to feed the developed yara signatures into Volatility using the yarascan command, assuming the Yara signatures are in the current path, and you have a memory snapshot of Dark Seoul paused inside OllyDbg. Set a breakpoint towards the onset of the payload address (refer to Chapter 3, Performing a Séance Session) and let it break in OllyDbg. Thereafter, just press pause in the VM controls and take note of the location and file name of the snapshot file (*.vmem).
volatility-2.3.1.standalone.exe -f <snapshot path> yarascan --
yara-file=ds.yar.txt
You can expect an output as shown in the following image:

You can now start exploring the other commands as well, keeping the references close to get a full understanding of each.