
Gathering Data about Your Users
Introduction
Learning about your users and understanding how they use your application are important for ensuring that the content you create meets their information needs. Simple research methodologies can be used to learn about your users, their work practices, and what motivates them to use your application. This can be a daunting task, and it’s easy to become overwhelmed with facts and data. Creating a plan and limiting your research to common user tasks and goals will help you stay focused. A good way to start is by thinking about user goals, as well as the tasks your users will want to complete to meet those goals. Then define your research plan and questions around those goals. After gathering your data, you’ll analyze it, looking for similarities among groups. Finally, you’ll use the data to understand your target users and create personas.
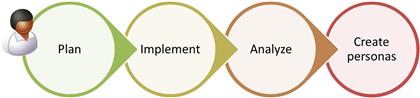
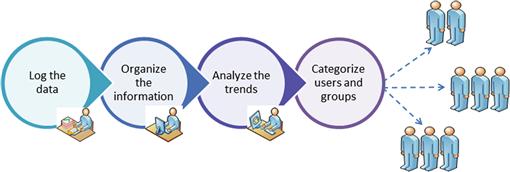
The amount of time you spend gathering data is essentially determined by the amount of time and resources available. Regardless of time constraints, certain basic steps are involved in gathering data that can help you understand your users and that can be used for creating personas later on.
![]() Plan—During this stage you define and create your research tools. You decide what research methodologies you will use and how you will implement them. You will also need to find people who may represent your target user groups from whom you will collect data, and you will decide the number of people you will use in your research.
Plan—During this stage you define and create your research tools. You decide what research methodologies you will use and how you will implement them. You will also need to find people who may represent your target user groups from whom you will collect data, and you will decide the number of people you will use in your research.
![]() Implement—During this stage, you gather demographic and other qualitative information you will use to learn about your target users. And while you may be working toward building personas as a team effort, remember that you need to gather data about your users’ information needs and habits.
Implement—During this stage, you gather demographic and other qualitative information you will use to learn about your target users. And while you may be working toward building personas as a team effort, remember that you need to gather data about your users’ information needs and habits.
![]() Analyze—After collecting the information, you will need to aggregate your data, mapping your findings to real user tasks and goals. Remember that you are looking for trends and data about how your users interact with the user interface and how they use the information and text provided in the user interface (e.g., explanatory text, links).
Analyze—After collecting the information, you will need to aggregate your data, mapping your findings to real user tasks and goals. Remember that you are looking for trends and data about how your users interact with the user interface and how they use the information and text provided in the user interface (e.g., explanatory text, links).
![]() Create personas—Based on your research, you can create personas, each representing a target user group. And while you may have any number of user types and potential personas, narrowing them down to a few personas who exemplify your target users will be the basis of your persona biographies.
Create personas—Based on your research, you can create personas, each representing a target user group. And while you may have any number of user types and potential personas, narrowing them down to a few personas who exemplify your target users will be the basis of your persona biographies.
Gathering the User Data
Gathering data to create personas is a good way to learn about the everyday working practices, knowledge levels, and information needs of your users. You can use common user research methodologies to gather your data; these methods include surveys, customer interviews, site visits, and focus groups. As your application begins to develop, usability studies and user walkthroughs of the initial designs will help you further refine your data. In addition, any information gathered from the marketing group or other user-facing members of the team is useful—as long as you are able to distinguish between fact and opinion.
Each method for gathering user data has its benefits and drawbacks, and the methods you decide to use depend on having realistic plans and goals. Before beginning any research, you’ll need to decide on the amount of time you have and the resources available. This will help you determine the scope of your research.
Creating User Surveys
A survey is a data collection tool used to gather information about individuals and groups. Because user surveys often rely on close-ended questions and can be administered electronically, they are a good tool for gathering information that can easily be evaluated and analyzed. Because surveys let you gather relatively large amounts of statistical data in a relatively short period of time, they are particularly useful for gathering information from a large number of people.
Surveys are a reliable method for gathering factual data about your users, such as age ranges, educational levels, and facts about their working environment. Gathering other types of information, such as user opinions, likes and dislikes, and trends in user behavior, is more difficult but can be done with careful planning. When creating your survey questions, consider the goal of each question, asking yourself what you are trying to measure. Then you need to decide on the best format for that question and the participant selection options. All these issues will influence the type of information you gather from the survey.
Building Your Survey Questions
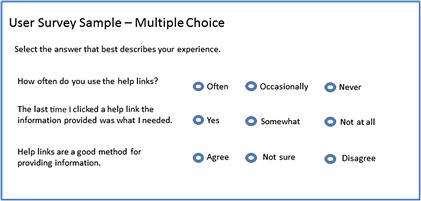
Surveys may focus on gathering factual information and may be used to learn the opinions of the survey takers. While it’s easier to build questions for factual information, there are several ways you can build your survey questions to gather subjective information, such as using rating scales and multiple choice. Each provides a slightly different level of data. You can see an example of this in the samples below. Let’s say, for example, you want to know if your users prefer to access information in the user interface by having text displayed inline, directly on the page, or by clicking help links to open explanations and descriptions. The type of question you provide and the choices that are available will influence the data. The following examples show how subtle changes in format can affect your data.
Rating scales: One way to measure user likes and dislikes and user attitudes is to use rating scales. With rating scales, participants are given a statement, and then they select their level of agreement with the statement.
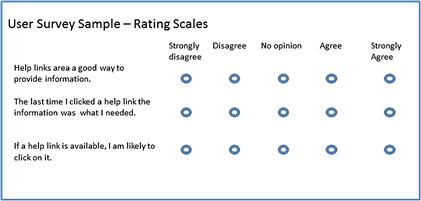
Typically, a rating scale (also called Likert scales) will have one to five or one to seven choices, with a neutral choice provided.
Paired comparison: Paired comparison questions present two statements, and the participants choose which statement they agree with or prefer. Paired questions have the benefit of providing two distinct options, and the users are forced to select the one that best describes their feelings or actions. Based on the answers, you can conclude that one option or scenario is preferable to the other.
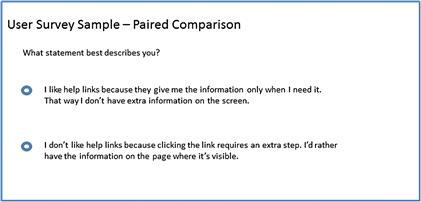
Because neither selection in the pair may actually describe the participants’ feelings or actions, you may also want to include a space for comments in case participants want to qualify their answer.
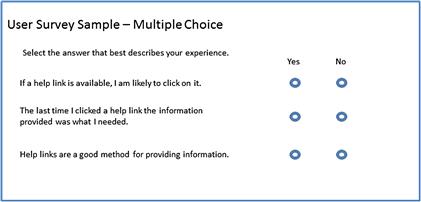
Multiple choice: Multiple-choice questions let participants chose their answer from among several possibilities. These may be Yes/No questions, or you may provide a list of possibilities and allow participants to choose one or more options from the list. In some cases, multiple-choice and paired questions are very similar. As with paired choice questions, the reliability of the survey depends on your ability to provide appropriate choices. Sample A is an example of a multiple-choice question that provides choices that are so limited that it differs very little from a paired-choice question. Sample B provides broader options, which may produce much more valid results.
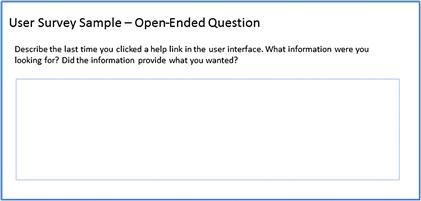
Open-ended questions: While close-ended questions may be easier to analyze, they have their limitations inasmuch as they give participants only a narrow number of predetermined possible answers that may or may not reflect their ideas and preferences. For optimal results, a survey should also allow participants to answer some questions according to their own experiences. If your survey has a large number of participants, keep in mind that the feedback is valuable only if you have time to read and analyze it. When creating your personas, the comments participants make in the open-ended questions are often good quotes in the persona biographies.
There are many different ways you can deliver surveys; most often surveys are conducted either face to face or electronically.
Face-to-Face Surveys
The benefit of face-to-face surveys is that during the survey you can interact with the participants and take note of any additional comments and information they may provide while answering the survey questions. You can also answer any questions they may have regarding the survey, making sure they understand the rating scales and questions.
The downside of face-to-face surveys is that you may inadvertently influence the answers, thereby affecting the reliability of the survey. Because of the time needed in meeting each participant in person, the time investment per survey is much higher.
A less timely alternative is to complete the survey by telephone. This method provides the personal interaction, without requiring such a heavy time investment.
Online Surveys
In recent years, many good online survey applications, such as SurveyMonkey (surveymonkey.com), have been developed, offering low-cost basic services. Online surveys provide the easiest way to reach a large number of people: You set up the survey and send out the link via an e-mail; participants complete and submit the survey; and the online tool lets you collate and analyze the results.
The downsides of online surveys are their low response rates and their inability to offer personal interaction with your participants.
Site Visits
Site visits allow you to observe users in their own environment, providing insights into their everyday working practices and work environment. This is a good way to gather quantitative and qualitative information, assuming you have the necessary time and resources. If you are working on a business product, then your site visits will be to the company offices where your target users are located. Watching and observing them in that environment will help you understand how roles and work responsibilities interact and overlap in real-world situations. If you are working on a consumer product, seeing at first hand the varying skill levels and practices of different target segments will help you understand how real people interact with their desktop computers or mobile devices.
If possible, site visits should be made in pairs: One person on the team interacts with the participant, and the other takes notes.
Preparing for Site Visits
The first step in planning your site visits is to define the goals of the visits and then use the goals to create a list of questions to ask. While site visits allow for informal interaction and observation, having a list of questions prepared ahead of time will keep the conversation focused.
If you are conducting site visits at a corporation or business, learn about organization before your meeting. If you are conducting a home visit, call ahead of time to ask about the number of family members and their ages. Having basic information before arriving will help you plan and prepare the framework for your visit. Before the site visit, prepare a folder to take with you. The folder should include a tablet of paper, two pens or pencils, and your list of questions.
The Site Visit
Always arrive at the site on time with your site-visit folder. While you may find it easier to take notes on a laptop, it’s not recommended during a site visit: You will be more attentive to the participant and will observe more if your focus is on the conversation rather than on the keyboard. If you are at the meeting alone, you may want to record the session. That way you can jot down observations, without worrying about missing important information. Never tape a session without explicit permission from the participant.
During the site visit, start by asking simple questions, leading up to the more probing questions. Ask for specific examples about the tasks the participants perform. Having them show you a typical workflow or sample of a task will result in better data than having them explain it to you. Ask the participants to describe the most common challenges and let them show you how they problem-solve along the way.
Only stay for the scheduled time period, and be sure to thank the participants when you leave.
After the Site Visit
After the session, it’s advisable to write up your notes as soon as possible so that your observations and comments are fresh in your mind. If you went out as a pair, go over the notes together, not only to review the information gathered, but also to discuss ways to improve your process. Depending on the number of visits, you may decide to change the questions or the style of questioning after the first few visits.
And remember to send the participants an e-mail or note thanking them for their time.
Focus Groups
Focus groups were originally used by market researching teams but have now become a popular tool for development teams. The interaction among the groups provides a platform for participants to express their likes and dislikes, expectations, concerns, attitudes, and behaviors, and the groups are usually very happy to have a chance to impact an application or product.
Your first step in creating a focus group is to determine what information you are trying to gather and what you hope to learn. The group should consist of a small sample of target users—usually six to ten participants. When recruiting your participants, create your groups according to common roles and user tasks. Then, based on your needs, you should create a script, including the activities and the amount of time you will spend on each activity.
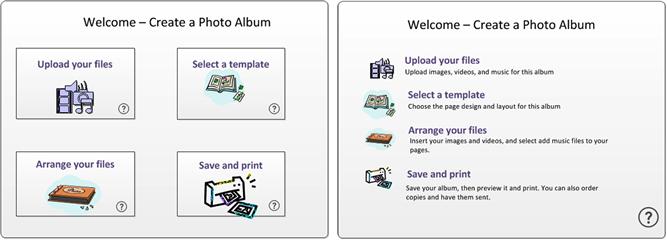
Activities can include round-table discussions, card-sorting exercises, problem solving, and reviews of sample applications and screens. For example, you might show the participants two sample screens and ask them to describe which one is preferable and why.
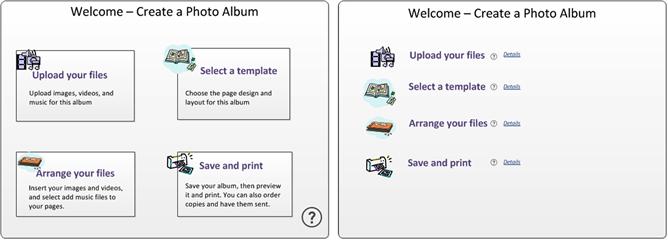
Then, you can introduce another sample, again asking the participants to compare the pages and discuss reasons why one may be preferable to another. When performing this activity with different groups, it’s a good idea to switch the samples around to get more reliable feedback.
During the focus group session, you will need a moderator dedicated to facilitating the group discussions and activities. You’ll also need at least one person to take notes.
The benefit of a focus group is that the group interaction stimulates the flow of ideas. Its disadvantage is that one or two strong personalities may monopolize the conversations; when this happens, you may end up with a group dynamic that inhibits the flow of ideas from the other participants. Occasionally, you may also find participants who exaggerate, or are less than truthful, affecting the reliability of the focus group results. It’s important for the moderator to control the conversation, making sure everyone has a chance to speak, and to stay within the time limits allocated for each topic.
As with site visits, it’s important to summarize your notes right away, while the experience and your recall of the comments is still fresh in your mind.
Talking to Customer Support
The customer support team is in direct contact with customers and usually has a deep understanding of users’ needs and how users really work. The support team may also have detailed reports about support calls; this information will tell you what tasks users are trying to complete and the areas in the user interface where information is needed.
When gathering information from customer support, remember that while expert opinions are helpful, insights gathered from an informal conversation are not the same as empirical data. Asking specific questions about typical user tasks, scenarios, user work habits, and knowledge levels, and writing this information in a way that can be analyzed later will help you make the most of the data.
For example, these are some questions you may want to ask:
![]() What is the first task users perform when they open the application?
What is the first task users perform when they open the application?
![]() What are the top three tasks users are performing when they call for help?
What are the top three tasks users are performing when they call for help?
![]() Is there a specific step in each task where users get confused? What is the step, and what is the main cause of the confusion?
Is there a specific step in each task where users get confused? What is the step, and what is the main cause of the confusion?
![]() What information will help the user understand what they need to complete that task successfully?
What information will help the user understand what they need to complete that task successfully?
Asking questions in a way that elicits answers you can track and record makes it easier to analyze as data later.
Gathering Information From the Internet
The Internet can provide valuable information about the knowledge levels, real-life tasks, and information needs of your users. It can also help you understand the terminology your users are comfortable with when talking about the technologies associated with their tasks.
Viable sources of information on the Internet are newsgroups and support sites. These are sites where members of the product team, or other users such as product resellers, answer questions that have been posted by actual users. Reading the posts, their answers, and additional comments will familiarize you with typical user tasks, working environments, and the kind of information users are seeking. If your application hasn’t been released yet, reading the posts for similar products will help you understand the types of issues your users may face later on. And if the information is posted in a way that can be measured and counted, you can create a chart or table showing the number of times a specific question or issue was raised.
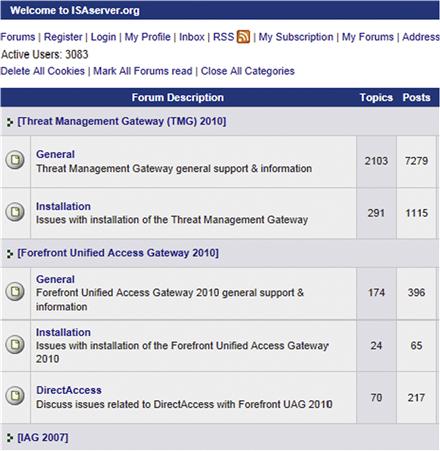
Figure 4.3 Example of a forum log (isaserver.org).
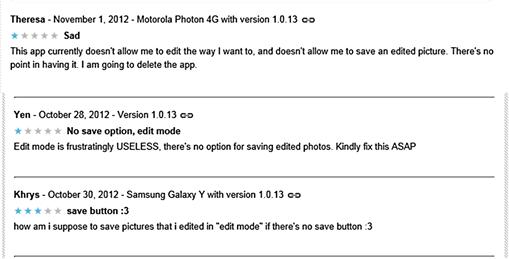
If your product already has a support site, start by reading the posts on that site. If you see that users have similar questions or comments about a specific user task, this may indicate that the information accompanying an option or page in the user interface is not providing the right information, or that additional text clarifying expected or possible user actions is required. For example, the following posts show that users are frustrated trying to save an edited file, assuming that the feature is unavailable. If in fact the feature exists, but users cannot figure out how to find or use the feature, then you can surmise that users need better textual or visual cues for interacting with the application.
In addition to learning about how users interact with the product, reading user posts will also help you understand their knowledge and motivation levels. While this may not be included as part of your data, it will help you understand user expectations and needs.
Analyzing Your Data
After gathering all your data, you’ll need to make sense out of it. This requires interpretation, analysis, and categorization of the results. Following these general steps will help you organize the information in a way that is useful and will also help you understand how to best provide an information experience that meets your users’ needs.
Your first step is to log the data. When using an online tool or computer application to create and distribute your surveys, the tool probably has a built-in feature for copying all your data into a central location. If your data was gathered manually, you will need to log it yourself. Fortunately, many programs are available to help you log data as well as organize and view the data. Microsoft Excel and e-survey are all examples of tools you can use to log and sort your data. The following example shows how logged data may be represented in a bar graph or pie chart. From this data, you can see that most respondents have a favorable opinion about inline help links.
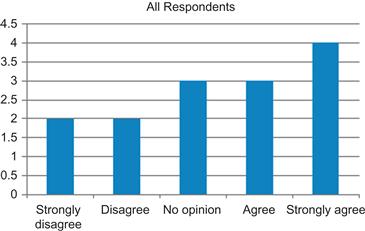
Figure 4.5 Respondents’ answers to the question regarding the usefulness of inline help—graphical representation.
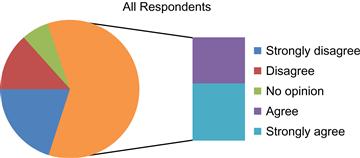
Figure 4.6 Respondents’ answers to the question regarding the usefulness of inline help—graphical representation.
Your next step is to organize your data, looking at demographics and user attributes. By analyzing the data further, the results provide another level of information, allowing you to draw conclusions about specific user groups. For example, you can see that system administrators have a more favorable opinion of inline help links, while support desk administrators responses were less favorable.
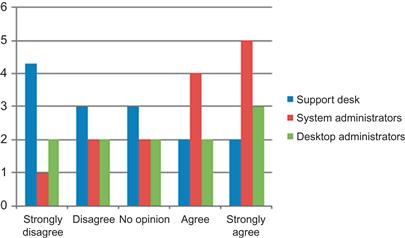
If you wanted to analyze this even further, you can divide the user groups into subgroups, based on relevant demographics, such as age and experience, or specific tasks.
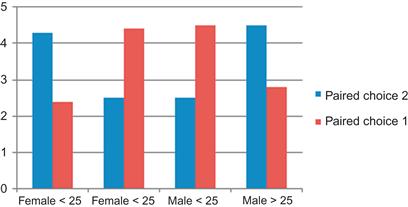
In a consumer product, it may be relevant to examine how different age groups or genders respond to questions. For example, if we go back to the questions we asked above about user interaction and attitudes toward online help links, this is a sample of how that data may be presented, if you wanted to see how respondents answer a single question.
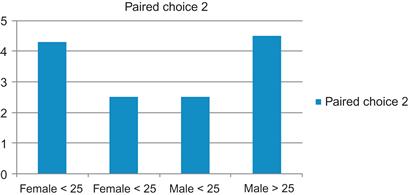
Organizing your data visually, using charts and graphs, will help you understand the data, making it easier to see the relationships between responses and to draw conclusions.
After you log and organize your data, it’s time to start analyzing it. The tools will help you organize the information, but you will still need to decide what it all means and how to use it. Ultimately, the tools you decide to use will be determined by the depth of the statistical analysis you deem necessary and the amount of time you want to invest.
In most cases, basic statistical analysis and simple tools such as PowerPoint and Excel can be used to express your data visually. The charts and graphs offered by simple and easy-to-use tools are generally sufficient for understanding user trends. If you have a lot of data, you may feel overwhelmed with information. It therefore helps to start by looking at the big picture, finding trends across demographics, user tasks, and user goals.
When looking at each piece of data, and analyzing the information you’ve gathered, think about how that data will ultimately help you create a better information experience for your customers.
After you analyze your data and see trends across demographics, you can categorize the users into groups. These groups become the basis for defining customer personas. Creating personas and persona biographies is a good tool for mapping information needs to real users. This will help you understand the kind of information they need and how your user interface text can best serve their purposes.
Summary
Before creating the information for your users, you’ll need to understand what kind of information they need and the tasks they will perform. Simple research methodologies can be used to gather and analyze your data, helping you define user groups and understand your users.
![]() The steps involved in gathering data about your users are as follows: Plan your research methodology, implement your plan, analyze the data, and then use the information to create user groups for your personas.
The steps involved in gathering data about your users are as follows: Plan your research methodology, implement your plan, analyze the data, and then use the information to create user groups for your personas.
![]() Surveys are a good tool for gathering measurable data from a large sample of potential users.
Surveys are a good tool for gathering measurable data from a large sample of potential users.
![]() Site visits let you observe users in their natural environment, which helps you understand their real work habits and needs.
Site visits let you observe users in their natural environment, which helps you understand their real work habits and needs.
![]() Focus groups provide feedback from a small group of sample users, helping you learn about user preferences, expectations, and behaviors.
Focus groups provide feedback from a small group of sample users, helping you learn about user preferences, expectations, and behaviors.
![]() Talking to customer support can help you understand what tasks users are trying to perform, and their user scenarios.
Talking to customer support can help you understand what tasks users are trying to perform, and their user scenarios.
![]() When looking at your data, think about how that data will ultimately help you create a better information experience for your customers.
When looking at your data, think about how that data will ultimately help you create a better information experience for your customers.