
Web design by example
Setting up your website
Choosing a data source
Creating a data view
Organizing the viewed data
Formatting a data view
This chapter shows you how to use the XML-related features of FrontPage in the creation of data-driven dynamic websites. Basic familiarity with FrontPage and Windows SharePoint Services isn’t strictly necessary to understand this chapter, but will be required in order to actually build a FrontPage website.
Skills required
Some techniques that we cover require knowledge of XPath (see Chapter 24, “XML Path Language (XPath)”, on page 498) and XSLT (see Chapter 18, “XSL Transformations (XSLT)”, on page 392).
We’ve that XML allows us to represent information in a purely abstract way, separate from its presentation. In Chapter 4, “Creating and editing XML documents”, on page 60 we learned how XSLT stylesheets can be used to transform abstract XML documents into WordML renditions so that they can be viewed, printed and edited as Word documents.
A more common transformation is from XML documents into HTML, to allow XML documents and data to be viewed on the Web. You can write such stylesheets by hand, as we did for WordML. For HTML output, though, FrontPage gives you a convenient alternative for many documents: a WYSIWYG editor that generates the XSLT for you.
FrontPage uses a design by example paradigm, in which you design a Web page by inserting data views of representative data sources. You organize the data in the views and apply formatting styles. The product then generates an XSLT stylesheet that will produce the same Web page from any data source that conforms to the same schema as the representative.
Ellen, whom you may remember from 7.2, “The Worldwide Widget expense report”, on page 134, decides to use FrontPage to create a Web page for the company intranet to expedite the expense approval process. In the following sections, we will go through the process step by step:
Set up a SharePoint website.
Define one or more representative data sources.
Create data views of the whole of the data sources or of selected elements.
Organize the viewed data by sorting, grouping, filtering, etc.
Format the data view from a choice of layouts and styles, including data-driven conditional formatting.
The first order of business is to set up the website. To create a SharePoint website in FrontPage:
On the File menu, click New. This will display the New task pane.
From the task pane, click SharePoint based team Web site. This will display the Web Site Templates dialog.
Under Options, type the location of your new site. This will be the URL of your SharePoint site, plus a slash and the subdirectory that you would like to use for the new site.
You will be prompted to log into SharePoint. Enter your user ID and password and press Enter. This will show your new site in the Explorer window.
FrontPage allows you to define any data source that can be an XML document. These include all that we have encountered with other Office products, in other words:
A local XML file
A URL that returns an XML document
A REST Web service (although you will have to construct the parameter string in the URL reference yourself)
A SOAP Web service
A database that can export XML
You can define multiple data sources to be combined in the same Web page. FrontPage allows you to create different data views for each of them.
Tip

Remember that FrontPage doesn’t understand schemas. The page design – and therefore the generated stylesheet – are based entirely on the representative data sources. Make sure that yours include all possible element types. You are not generating a static HTML page for that specific data, but a view that can be applied to any XML document that conforms to the same schema.
Ellen has chosen the file sample expense report.xml to represent Worldwide’s expense reports. To upload it to your website:
Your next step is to create a Web page into which you will insert data views of the expense report. To do this, you should start with a new Web page, as follows:
On the File menu, click New.
Click Blank page on the New task pane.
This will create a blank page named something like
new_page_1.htm.
You can insert data views either in Design mode or in Code mode; it is your choice. For this exercise, click Design mode at the bottom of the window.
To see the data sources for which you can create data views:
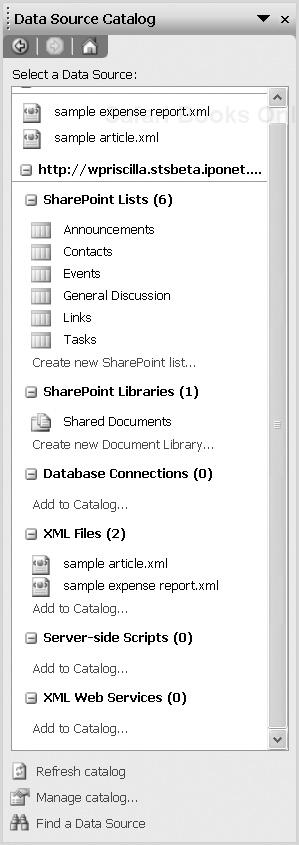
On the Data menu, click Insert Data View. This will display the Data Source Catalog task pane, shown in Figure 13-1.
Under XML Files, you should see the
sample expense report.xmlfile you just imported. Right-click it, and click Show Data on the resulting context menu.FrontPage will display the Data View Details task pane, shown in Figure 13-2. This task pane shows the structure of the data source, as well as any settings of the data view itself, such as styles, sorting and filtering.
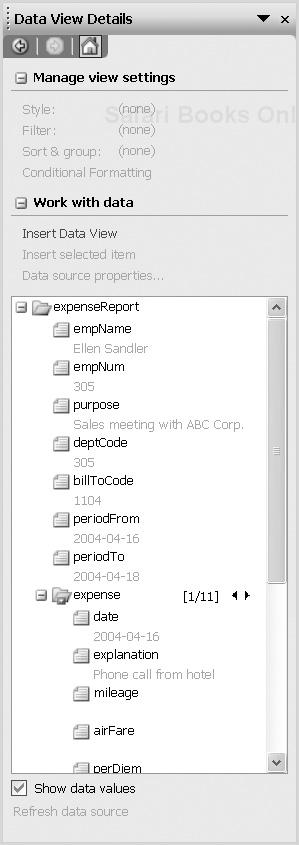
You are now ready to begin inserting data views of the data source into your page. This is accomplished by selecting an element or elements in the task pane and clicking Insert Data View. For this example, we will focus on the repeating data (the expense items themselves).
Make sure the cursor is positioned in the Web page where you want to insert the data view.
Select the
expenseelement, located about half way down the tree structure, and click Insert Data View.This will display the expenses as a table, as shown in Figure 13-3.
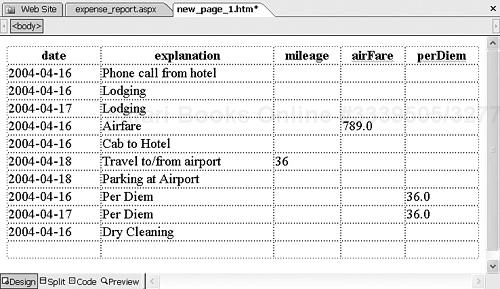
The table contains a row for each expense element, and a column for each child of expense. The column headers are the child element-type names.
Once you have displayed repeating data in a view, FrontPage will allow you to massage that data in various ways, including inserting new columns, sorting and grouping, filtering, and conditional formatting.
Our generated expense table automatically cuts the table off at five columns, but more columns can be added manually to reflect the rest of the child elements. To do this:
Position the cursor after the last column header, namely
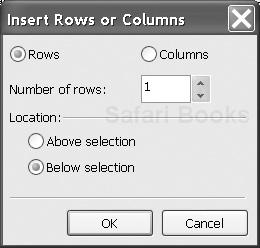
perDiem.On the Table menu, point to Insert, then click Rows or Columns.
This brings up the Insert Rows or Columns dialog, as shown in Figure 13-4.
Click Columns, then OK. This will place a column after the
perDiemcolumn.To specify a column header, type
Lodginginto the first row of the new column.To populate the column, drag the
lodgingelement into the second row of the new column. This will automatically populate all the rows of the table with the lodging data.
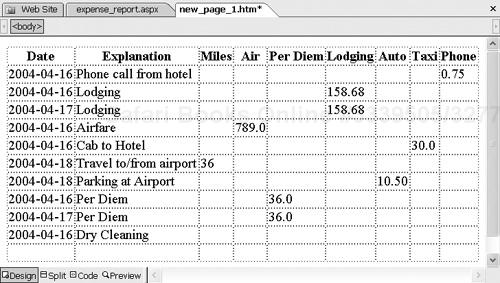
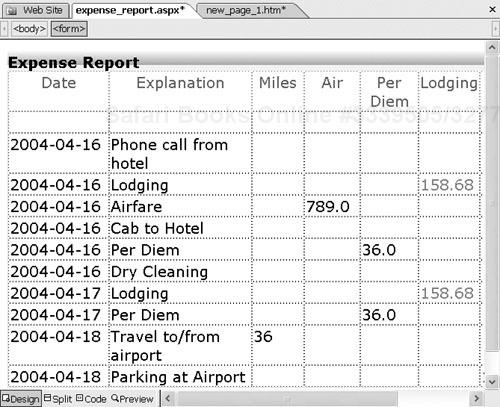
After you have added the rest of the columns, and revised the column headers, you are left with a table that looks like Figure 13-5.
Suppose you want to sort our expense items by date. To do this:
Position the cursor anywhere in the table.
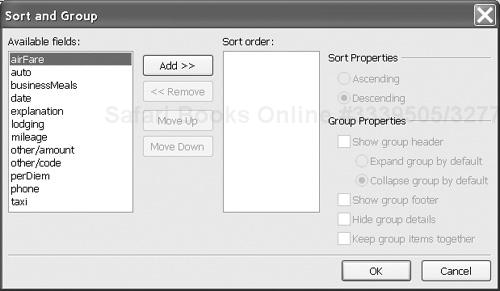
On the Data menu, click Sort and Group. This displays the Sort and Group dialog shown in Figure 13-6.
Select date from the list on the left, and click Add. This will add
dateto the list of columns to sort on.Click OK and verify that the rows in the table are now sorted by date.
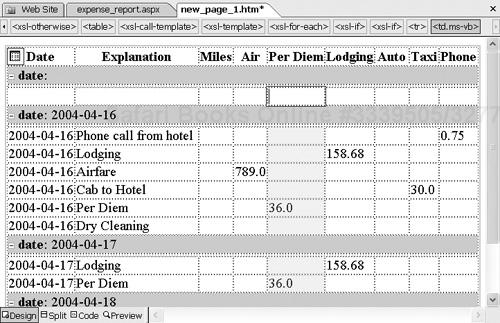
In addition to sorting, rows can be grouped together by the column(s) on which they are sorted. This can be accomplished by checking the Show group header box on the Sort and Group dialog. This will result in a table that looks like Figure 13-7.
It is also possible to filter the rows, based on conditions you specify. For example, suppose you want to show only the expenses where there is a lodging charge greater than $150. To do this:
Position the cursor anywhere in the table.
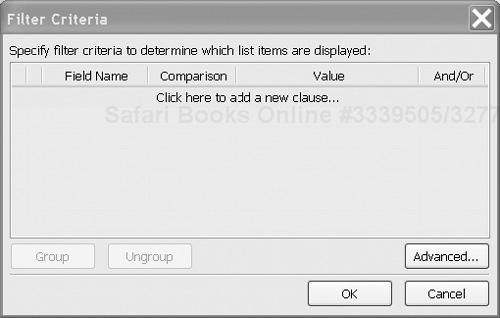
On the Data menu, click Filter. This displays the Filter Criteria dialog shown in Figure 13-8.
Click the row that says Click here to add a new clause.
Select the field name lodging (Number), comparison (Greater Than) and the value (150) and click OK.
This will limit the view to only those rows that have a value greater than 150 in the lodging element.
You can enter multiple criteria and join them using AND or OR operators. You can also specify criteria based on variables, such as the current date, and whether it is the first row in the table.
By clicking Advanced on the Filter Criteria dialog, you can also manually specify an XPath predicate that will be used to select the appropriate rows. For example, you could enter [number(ddw1:lodging) > '150'] to specify the same criteria as above. The ddw1 prefix was assigned by FrontPage to the expense report schema’s target namespace. The number function instructs the processor to treat lodging like a number rather than a string. Using XPath provides more flexibility, allowing you to utilize functions such as count and max.
Once you have displayed the data you want, you can further refine the look of the view using the features of FrontPage. Once formatted, our table might look something like Figure 13-9.
The following sections describe two features for data-driven formatting: applying a style to the data itself, and conditional formatting.
Our example has rows for expenses and columns for the various sub-elements of an expense. However, there may be occasions where you want to lay out the data differently. For example, in two columns, with the element-type names (e.g. date, explanation) on the left, and their content on the right. To do this:
Position the cursor anywhere in the table.
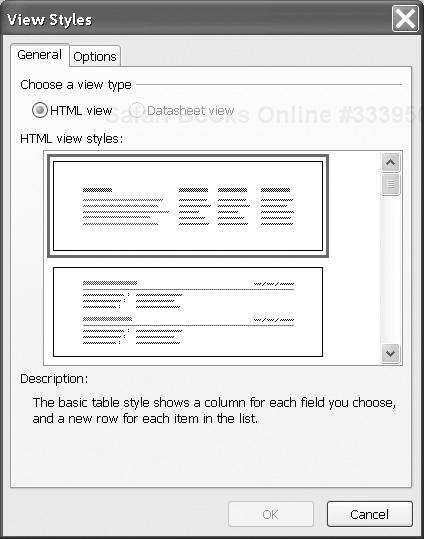
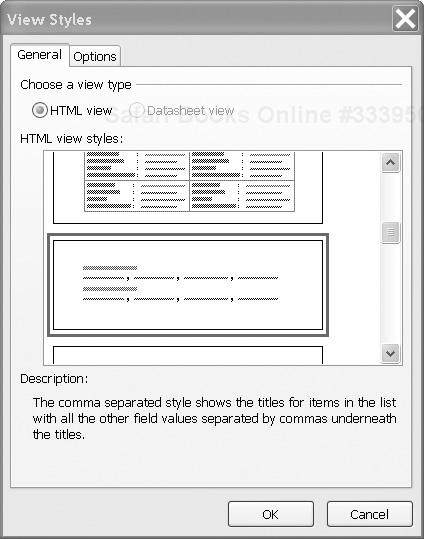
On the Data menu, click Style. This displays the View Styles dialog shown in Figure 13-10.
Select one of the styles from the list and click OK. The currently selected one produces the style in Figure 13-9, but there is another that would produce Figure 13-11.
You can format data differently based on criteria. For example, to have rows with a lodging charge of over $150 show up in red, to call attention to them during the manager’s review of the expense report, do this:
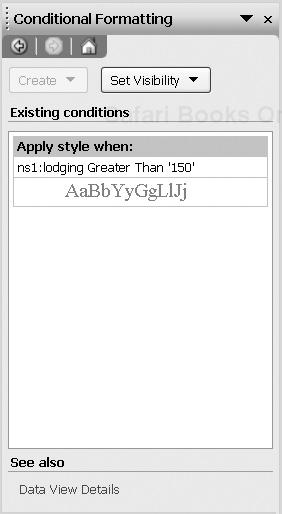
On the Data menu, click Conditional Formatting. This displays the Conditional Formatting task pane shown in Figure 13-12.
Select one of the lodging values (not the whole column), and click Create, then Apply formatting on the task pane.
This will bring up the Condition Criteria dialog which is similar to the Filter Criteria dialog in Figure 13-8.
Click the row that says Click here to add a new clause.
Enter the field name (lodging (number)), comparison (Greater Than) and the value (150) and click OK.
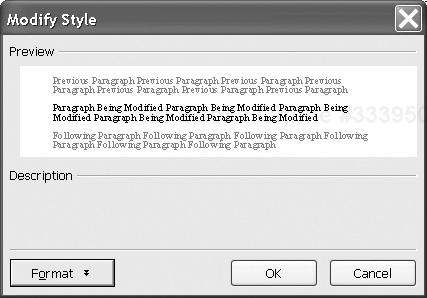
This will bring up the Modify Style dialog shown in Figure 13-13.
From there, you can choose a style for the data that meets the criteria by clicking Format. In our case, to modify the color of the text, click Font on the Format menu.
For Color select the red shade and click OK, then OK again to return to the main workspace.
As you can see, the lodging values are now displayed in red. Using the Conditional Formatting task pane, you can also choose to show or hide data based on criteria. This will result in the entire row (in this case, expense item) being shown or hidden, not just the value(s) being tested (e.g. lodging amount).
FrontPage’s view styles are designed for predictable data that lends itself to tabular presentation (think “spreadsheet”). Our expense report is a typical example.
But what if you want to present a freeform XML document on a FrontPage site? For the most part you’ll need to create your own XSLT stylesheets, as we’ll describe shortly. But for some documents you can get some or all of the job done by using multiple data views.
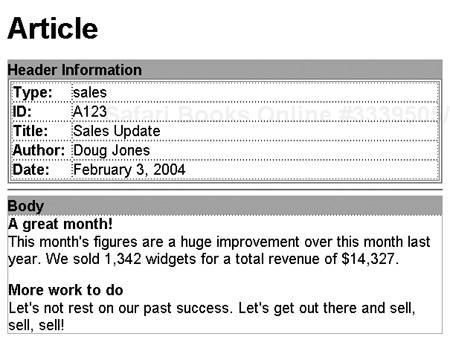
For example, we can handle Doug’s newsletter article in Figure 13-14 by dividing it into two different data views, hence two different styles.
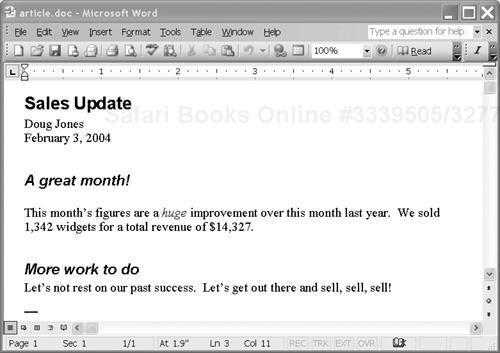
The first view, in tabular style, will include the elements that represent properties of the article, such as title, author and date. The body of the article will appear afterwards in a view styled more appropriately for freeform text.
To create the tabular view:
Import the
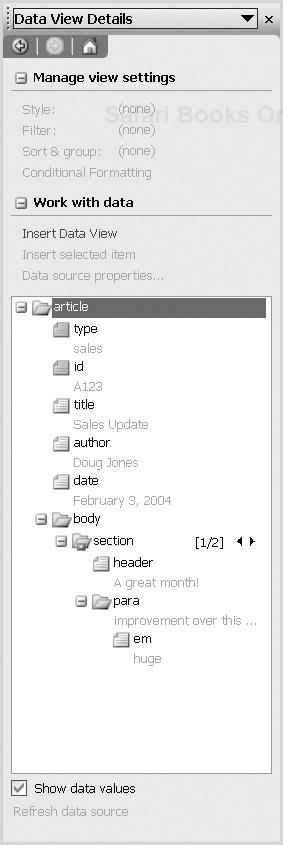
sample article.xml, select it in the Data Source task pane, and bring up its structure, shown in Figure 13-15, by right-clicking and choosing View Data.Select the “property” elements
type,id,title,authoranddate. Holding down the CTRL key will allow you to select multiple elements and attributes.Click Insert Data View on the task pane.
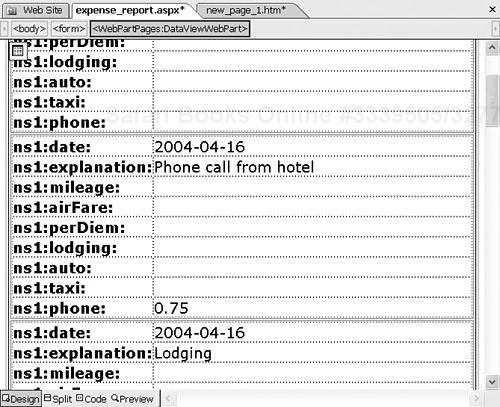
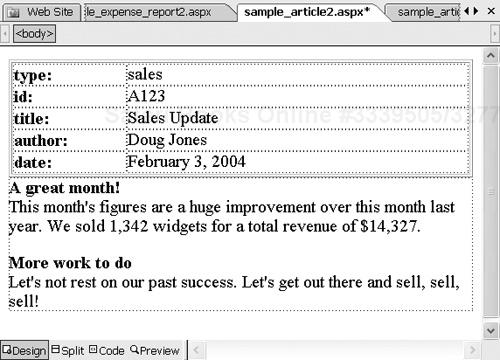
This will insert the selected elements in a table with the element-type names in the first column, and the data content in the second, as shown in the top part of Figure 13-16. This is the default view for data that does not repeat.
The next step is to insert the data view for the body of the article. Because the body has a simple structure that just alternates headers with paragraphs, we can use one of FrontPage’s built-in styles. To specify the style of view we want:
Select the
sectionelement and click Insert Data View. This will insert the sections in the default style: as a table with two columns labeledheaderandpara(the children ofsection).For a style more suited to headers and paragraphs, click Style on the Data menu, and select the style shown in Figure 13-17.
This will display the headers followed by the paragraphs, as shown in Figure 13-16.
As before, you can modify the presentation of the article using the standard features of FrontPage, resulting in a document that looks like Figure 13-18.
FrontPage takes you a long way toward creating dynamic Web pages from XML documents. However, there may be cases where its WYSIWYG editor is not capable of displaying the data the way you want.
Behind the scenes, FrontPage is generating an XSLT stylesheet that transforms your XML data source into HTML. The XSLT is embedded in an ASPX Web page as a Web page part.
You can hand-modify the generated XSLT stylesheet from the Code view, which is shown in Figure 13-19. The ConnectionID element is the connection information for the data source, while the XSL element is a wrapper for the actual XSLT stylesheet.
