
It is very important to know how well your application is tested. If you wrote all the tests by yourself, then you can probably guess it, but if there is a team or you are working on a relatively old project, guessing will not work. Fortunately, there is a way to generate code coverage reports using PHPUnit and Xdebug. This report gives information about how well the application is tested, which lines are being executed while running tests, and which are not.
As an example, we will generate a report for the Yii framework's core base classes.
The Yii framework core tests are not included into release distributions, so we need to get it from the GitHub.
- Go to https://github.com/yiisoft/yii and either download code using the
ZIPbutton or use git to clone it. - In console, enter the following:
cd path/to/code/tests/ phpunit --coverage-html report framework/base - After the report is generated, go to the
path/to/code/tests/report and openindex.htmlin your browser.
The code coverage report that was generated can tell us how well the project was tested and which parts required more testing to be done.
The first report page gives us an overview of which files were tested, and how many lines, methods, and classes were executed. As we are interested in covering as much code as we can, the things to look for are displayed in red and yellow. In the following screenshot, we can see that more tests for CApplication.php and CStatePersister.php need to be written:

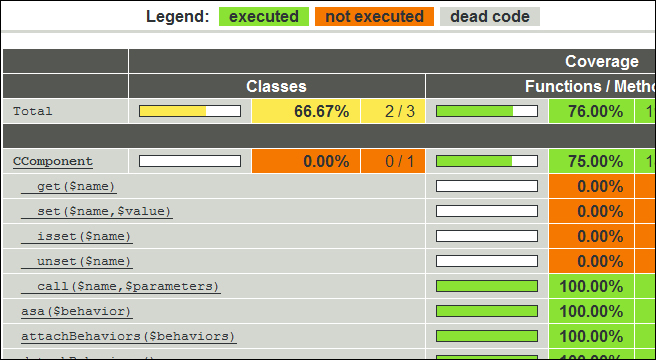
If we click on a class name, for example, on CComponent.php, then we get more details. The following screenshot shows the class level report:
Moreover, the actual code shows what is covered in green:

If we click on the dashboard link on the main report page, then we get a handy summary showing the most risky untested classes and methods, as shown in the following screenshot:
