
The fourth part of Your Google Game Plan for Success talks about Google Website Optimizer. You've read Chapter 1 and thought about what the purpose of your website is. You've learned about Google AdWords and cost-per-click advertising to drive traffic to your site, and you've digested the concept of Google Analytics and how to analyze your website traffic. Now, how do you optimize your site for conversions in an intelligent, statistically confident way? You do this with Google Website Optimizer, of course!
In this chapter you'll learn all about Google Website Optimizer, creating an experiment, and interpreting the results. You'll also see two terms quite frequently in this chapter: conversions and landing pages. These are what Google Website Optimizer is all about.
Let's take a step back for a minute so that everyone is on the same page as to exactly what Google Website Optimizer is. As I mentioned in Chapter 1, there's a sort of "ego" present in some organizations and how they approach their online business. In the offline world, a powerful, name-brand product or service that's been around since your grandparents' early years is very tough to go up against from a competitive standpoint. Joe, the local businessman, cannot compete with a big organization because it has millions of dollars allocated to its advertising budget, and Joe does not. Because it's such a dominant player, the big company isn't pressed to make changes and optimize its business services; if it loses customers, it will simply gain others down the road, and everyone sleeps well at night. Joe doesn't have this luxury and must provide fantastic service and price, and must optimize his business and earn the trust, respect, and confidence of each and every customer, because his livelihood depends on it. One customer lost could mean the difference between making payroll and having to lay off a hard-working employee.
Now let's move to the online world, where there is an even playing field. Yes, you read that correctly, an even playing field. The millions of dollars in advertising that the big conglomerate has offline won't make up for the fact that its website is horribly optimized for SEO, has a clunky navigation menu, and does not offer compelling calls to action, price points, or value propositions. Its site search func-tion doesn't work and neither does its live chat function, and buying something through its online shopping cart is as tough as having a root canal. Yes, the big company can dump thousands of dollars daily into an AdWords campaign, but as you know from the first few chapters of this book, there are so many factors that make up things like Quality Score and bid prices that while that company may get a lot of impressions and even clicks on its site, any user with sense will see that everyone on Twitter hates its service, its packages are way overpriced, and there's even a Facebook fan page for people who have had bad experiences with it. A user will have one interaction with the broken search function and almost unusable shopping cart, and that will be the end of it for that visitor.
Joe has a plan. He's purchased my book, he's purchased Avinash Kaushik's two phenomenal web-analytics books, he has been doing his due diligence, and he knows what it takes to build and maintain a successful website. With a frac-tion of the resources of the big company, Joe is able to convert visitors, engage with customers on social media, and rank/perform better. Joe knows that the changes he has made over time on his site have been successful in converting more visitors, and he knows that he must continually experiment and try new things to continue that level of success. Joe uses an online-experimenting tool called Google Website Optimizer, and within a few weeks he can get the results of an experiment and use the page or variation on a page that performs best in terms of conversions. The big company still thinks the Internet is a fad that will go away in a couple of years.
That is the essence of Google Website Optimizer. It is an A/B or multivari-ate experiment tool that allows you to optimize pages or sections of pages to increase your conversion rates. You tell Google what page is your original page and what pages are your variation pages, and after you install a few snippets of JavaScript tracking code on your site, Google will take care of the rest for you. You can come back in two or three weeks, and Google will tell you which variation led to more conversions.
Then, after you've seen the results, the idea is to continue testing on your site to continue increasing your conversion rate and customer satisfaction. You won't want to run just one experiment in your website's lifetime — you'll want to run experiments every few weeks so that you're always improving.
Google Website Optimizer, like Google Analytics, is completely free of charge. You can run as many experiments as you can think of without Google's ever sending you an invoice or a bill, which is a good segue into the next point I want to make.
Why do website owners fear Google Website Optimizer? Well, let's see. Google Website Optimizer is free, and you can create as many experiments as you want. You can set up experiments quickly and easily. The results of running a Google Website Optimizer experiment are a higher conversion rate, increased website performance, and greater customer satisfaction. So why would Google Website Optimizer be a tough sell to website owners?
From my experience, it comes down to the situations described in Chapter 1 and in the previous section of this chapter. When you're a website owner and you've had complete creative control of your website since inception, it's tough to admit that website isn't doing as well as it could be. It's not easy to tell a person who owns a website that its conversion rate isn't that great, or that its shopping cart is poor, or even that its homepage is badly flawed. Basically, it's very difficult for people to believe that their baby is ugly.
Before you go running to your boss or your client and start bombarding him or her with suggestions and advice, make sure that you'll have a receptive audi-ence. Use an approach that your boss or client is going to be comfortable with. As well-intentioned as your desire may be to use Google Website Optimizer on someone else's site, do remember that it is someone else's site. You're going to have to earn that person's trust and tread lightly, or you won't be able to sell Google Website Optimizer.
Are you the website owner? Do you trust me enough to allow Google Website Optimizer to improve your conversion rate? Are you comfortable with chang-ing items on your website, even your favorite applet or widget, if it means more business? Try to get comfortable with that idea. Those who don't experiment and test on their websites are the ones who get left in the dust, while their competi-tors soar past them and take their business.
Chapter 13 provides all the technical schematics that you'll need to know about when and where to install Google Website Optimizer. For this chapter I'll talk about the different experiment types, as well as show you some visual examples of experiments that you can conduct on your own website.
As you're going to learn in this chapter, two types of experiments are offered by Google Website Optimizer: A/B experiments and multivariate (MVT) experi-ments. With a few snippets of JavaScript tracking code on select pages of your site, a visitor will see one of the variations of your testing page, determined at random by the JavaScript snippets. Your website, using the Google Website Optimizer JavaScript tracking code, will create a cookie for that visitor and fol-low that visitor during that session. If the visitor converts and reaches the page containing the conversion JavaScript snippet, Google will assign credit for the conversion to the page or section variation that the visitor encountered. Over time, Google Website Optimizer will provide statistics comparing all the page or section variations that you have running, and after enough time has passed Google will inform you via the online interface of which page or combination has the highest chance of increased conversions, based on the experiment's data. The experiment will continue to run until you decide to turn it off, and when that time comes Google will suggest that you make the winning combi-nation or page variation permanent on your website, as it has the best chance for conversions. You can then run a follow-up experiment that may increase your conversion rate even more.
Google Website Optimizer counts unique visitor data when compiling reports for you. A unique person can't convert more than once in any particular experiment — so someone can't disrupt the natural flow of the experiment and artificially inflate the statistics. This keeps the experiment data pure and more statistically meaningful.
A common misconception about Google Website Optimizer is that experi-ments work only on pay-per-click traffic from Google AdWords. While you can create an experiment with Google Website Optimizer and send AdWords traffic to the landing page, any traffic to a live experiment page will be subject to that experiment, regardless of where the visitor comes from. Organic traffic and referral traffic can find your experiment page, and their conversion rates will be figured into the totals that you see within the interface.
The first type of Google Website Optimizer experiment is called an A/B experi-ment. This allows website owners to create one or more alternate versions of a page, and to run an experiment in which either the original page or a variation page is shown to visitors. The page that winds up with the highest conversion rate will be the winning page, and it will be the page that Google suggests you use perma-nently. This could be the original page or any of the variation pages.
Take a look at Figure 11-1, which is the homepage of the National Basketball Association (www.nba.com), and let's run through a hypothetical scenario. As you're looking at Figure 11-1, pretend that you're in charge of improving this website's conversion rate. The conversion that you're focusing on this week is having visitors click the series matchup link for either the Western Conference Finals or the Eastern Conference Finals.

The URL of the homepage during the NBA playoffs this year was www.nba.com/playoffs2010/index.html. Your job is to see if you can improve the rate for the aforementioned conversion, so you crack open a Google Website Optimizer experiment and get your web-design team to provide you with a variation of this page that may help. You work with your team and come up with a varia-tion of the page and upload it live at the (fictitious) www.nba.com/playoffs2010/index2.html URL. On this page you have removed the schedule of games under the series matchup link, and added a link under the Amazing Is the Journey banner toward the top of the page. You run the experiment, and after a week or so you notice that your website's visitors have visited the series matchup page at a much higher rate from the variation page than from the original page. The result is the page that you'll use, in Figure 11-2.
This simple yet effective A/B type of experiment can yield great results that don't require a lot of time or resources.
When should you run an A/B experiment? I could say "all the time," but it's more efficient to run it specifically when you have an easy and quick experiment that you'd like to try out. If you have one major element to test, or one significant change that you're thinking of making, an A/B experiment may be your best bet.

Sites like NBA get lots of traffic, but your website may receive only a fraction of what the NBA website gets. If you have a low- to medium-volume site (any-where from a few thousand to 10,000 visitors a month), an A/B experiment is the experiment type you should go with. Multivariate experiments (which I'll talk about next) require a much higher volume of traffic because of the multiple combinations involved.
If you're just starting out with Google Website Optimizer, I recommend performing one A/B experiment, just to get your feet wet. After the experiment concludes, and if your site receives enough volume per month, you can run other A/B experiments or a multivariate experiment.
The second type of experiment with Google Website Optimizer is called a multi-variate (MVT) experiment. Unlike an A/B experiment, in which you're testing two or more separate pages, an MVT experiment is conducted with different sections of one page.
With an MVT experiment, you and your web designer come up with alterna-tives for a few different sections on the same page. Instead of going to either Page A or Page B, all visitors will see the same page, but with different com-binations of page sections, including the original page sections. For example, let's say that in a multivariate experiment you test three new headlines plus the original (a total of four), two new call-to-action buttons plus the original (a total of three), and two new bottom-footer images plus the original (also a total of three). That adds up to a total of 36 separate combinations (four headlines, multiplied by three call-to-action buttons, multiplied by three bottom-footer images). In essence, you're running 36 separate pages, but without actually creating the pages and uploading them live on your web server. Google will start to serve up combinations and, just as with an A/B experiment, your winning combination(s) will be highlighted within the Google Website Optimizer interface.
Check out Figure 11-3, which is Twitter's homepage as of this writing. Running a multivariate experiment on this site would be fun because of the sheer vol-ume of traffic that it receives! Let's pretend we can do just that, and that our conversion goal is to get new people signed up. The call to action on this page is located on the right-hand side and is the Get Started Now button.
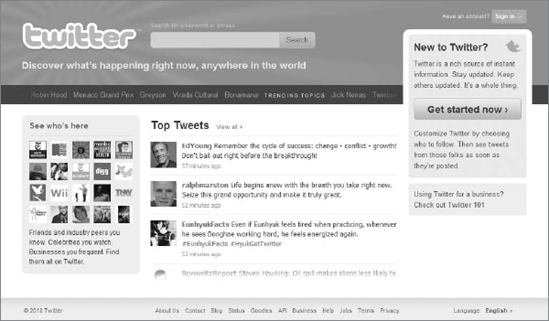
You have some ideas for other areas of this page as well, so you get with your web designer to come up with some variations on the call-to-action button, as well as a heading other than "New to Twitter?" Your hypothesis is that you can obtain a higher sign-up rate by simply changing the text that appears to a user who is looking to join Twitter for the first time. Figures 11-4 and 11-5 show the variations that you have come up with and the variations that Google Website Optimizer will rotate for you during the multivariate experiment. Please excuse the crudity of the image variations themselves — I'm not the best graphic artist around, but you get the idea.


In the examples of the previous two images, Google Website Optimizer would take the nine buttons (including the original) and the six heading variations (including the original). Multiplied together, you have a total of 54 combinations for a very nice multivariate experiment! You wouldn't think something that might appear to be insignificant, like the text of a button or the text of a heading, would have any impact whatsoever on performance, but it surely does. If someone from Twitter is reading this and wondering if it would have an impact, go ahead and run this experiment with these variations, and I'll guarantee that one of the 54 combinations will outperform the original.
Do keep in mind that your website should receive a lot of traffic (high volume) in order to successfully run a multivariate experiment. If you decide to run a multivariate experiment on your site and it doesn't receive a lot of traffic, the experiment will run for an indefinitely long period of time.
But who am I? I'm just an author, and while I may like a certain combination the best, and while the person in charge of the Twitter website may like another combination better, it's ultimately up to the visitors. Whichever combination the visitors to the Twitter homepage like the best is the one that Twitter (or your own website) should go with. Personally, I like the Create an Account button and the Get Started Today headline. What's your favorite combination?
When should your run a multivariate experiment? When you have grand ideas for testing portions of a popular page on your site, as in my Twitter homepage example — that's when you'll want to run a multivariate experiment. Instead of testing two or three separate pages, the experiment runs on one page, and things like buttons, headlines, images, or other elements get rotated at random to all your visitors until you stop the experiment.
Multivariate experiments on low-volume and even sometimes medium-volume sites tend to move really slowly, because of all of the combinations involved. Even a multivariate experiment with only six combinations can take a great deal of time to complete, let alone a multivariate experiment like the one in my Twitter example with 54 combinations. If you have a high-volume site or a lot of patience, you can use a multivariate experiment. Everyone else should use an A/B experiment, simply because it's much easier to run and faster to complete.
As you'll see in a little while, setting up a multivariate experiment requires more technical expertise than setting up an A/B experiment: you'll need to know basic HTML to be able to edit the individual experiment sections.
After you complete your experiment setup and during the life of your experiment, you'll be able to log in to Google Website Optimizer and view a progress report. If your experiment is completed, or if Google Website Optimizer has found a winning combination, you can view those statistics by logging in to your Google Website Optimizer account and selecting your experiment from your account's overview page (shown in the next section of this chapter).
Figure 11-6 shows a good example of a report from a completed A/B experi-ment. At the top you're given links to uninstall the experiment tracking code, copy the experiment, and make a new experiment; run a follow-up experiment; and view your experiment settings. You can also see below these links what the experiment launch date was and when it was originally created. Remember that your web developer or IT person will need to install and verify the JavaScript tracking codes before the experiment launches and data begins to be collected by Google Website Optimizer.
Below this you'll see a trending graph plotted by estimated conversion rate. In the example shown in Figure 11-6 there are two lines, representing the A and B versions of this experiment. Variation 1 is the line with a better conversion rate than the original, and this visualization is reflected in the data found on the table below the trending graph.
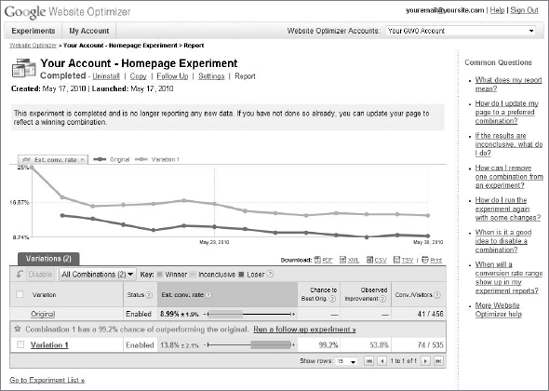
From left to right on the data table shown on the bottom of Figure 11-6, your variations are listed and are hyperlinked so that you can view the variation in a web browser. The Status column indicates whether the variation is enabled or disabled, something that you have the option to change as the experiment progresses.
The next item is that sliding bar that you see under the heading of Estimated Conversion Rate. The number 8.99 percent is the estimated conversion rate for the original variation in the first row. The number next to that — plus or minus 1.9 percent — is the margin of error of Google's estimated conversion rate. So the conversion rate for the original variation could be anywhere between 7.09 percent and 10.89 percent. This is represented graphically on the sliding bar and in comparison to the other conversion rates of the other variations. In this example Variation 1 had a 13.8 percent conversion rate, with a margin of error of plus or minus 2.1 percent. Again, this means that the conversion rate for Variation 1 could be anywhere between 11.7 percent and 15.9 percent. The sliding bar is all the way to the right and highlighted in green, making it easier to see that it crushed the original page. The stats to the right of the sliding bar for Variation 1 help show why the website owner should go with Variation 1 in this particular case. The odds of beating the original are 99.2 percent, which is remarkable. Variation 1 beats the original combination almost all the time. Observed Improvement is the improvement of Variation 1 during the course of this experiment, and it improved by 53.8 percent (it gained traction). Finally, the very last column of data on this report shows the number of conversions per the number of visitors for each combination.
Clearly Variation 1 dominated this experiment and should be the one that is permanently used on this site. You can download this report in a PDF or a file of any of the other formats available in Google Analytics by clicking the respective icon toward the top right of the data table. You can also print the experiment by clicking the very last icon on the top right of the experiment table.
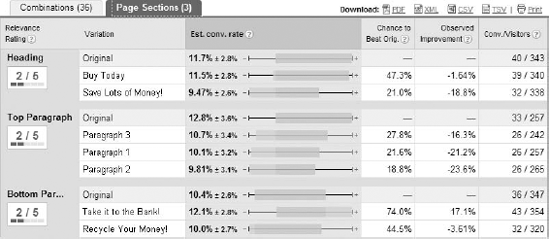
The example in Figure 11-6 is from an A/B experiment. When you run a multivariate experiment you're provided with a Page Sections tab, as shown in Figure 11-7. The first column on the left-hand side is labeled Relevance Rating, and it rates each section's importance to the performance of the experi-ment, on a scale from 1 to 5, with 5 being the greatest relevance. Next to that you'll see each variation that you've created for this experiment, and to the right the estimated conversion-rate statistics and sliding scales. The rest of the statistics are the same as the ones shown in an A/B experiment. The idea behind relevance rating is to give you an idea of how important each portion of your website is as it relates to conversion rate. This may give you some great insights as to what your website visitors are looking at and what they're not looking at.
As I'll talk about in Chapter 16, you can extract other meaningful and insight-ful data from Google Analytics as it pertains to your Google Website Optimizer experiment page(s). And in Chapter 13 I'll talk about some interesting experi-ment ideas for you to try out on your own website.
Now that you have a good grasp of Google Website Optimizer, let's walk through creating an A/B experiment first, and a multivariate experiment right after. The next portion of this chapter is organized by the steps that you need to take from start to finish in order to successfully set up an A/B experiment.
Let's get started!
Don't forget about the words that you read earlier in this chapter. Earn your website owner's trust, respect, and confidence before starting a Google Website Optimizer experiment. You may also need that person's permission first, so inform him or her of everything he or she needs to know about what visitors might see and what page they might see it on.
If you're the website owner, then you obviously don't need to perform this step.
As with Google AdWords and Google Analytics, you'll need to create a Google account in order to use Google Website Optimizer. If you already created one for either AdWords or Google Analytics, you should probably use the same account for Google Website Optimizer. If you haven't yet created a Google account, go back to Chapter 2 where I detail the steps involved. Remember, you don't necessarily need a Gmail account — you can make a Google account with any e-mail account.
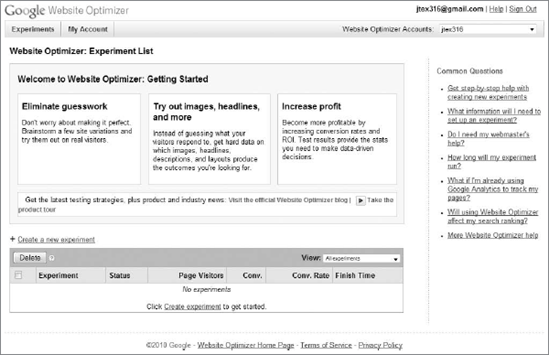
Once you have your Google account, visit www.google.com/websiteoptimizer and log in on the right-hand side of the page. Once you log in, you'll see a page like the one shown in Figure 11-8.
In the future this is where the experiments for your account will be listed. For now you'll want to click either Create a New Experiment, located above the table on the bottom, or the Create Experiment link within the table.
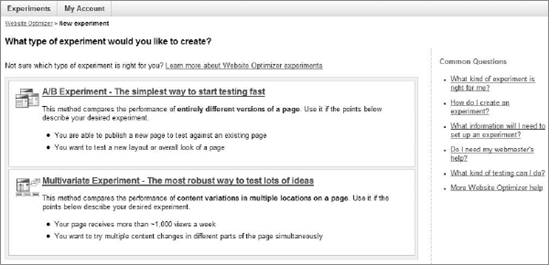
Figure 11-9 shows you the options that you already know about from reading this chapter. You can choose either an A/B experiment or a multivariate experi-ment. For this section we're going to choose an A/B experiment.
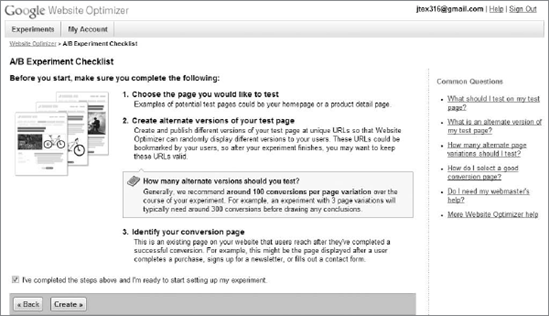
The next step in setting up your experiment is reviewing a checklist of items before starting the experiment, as shown in Figure 11-10. This is usually the page where people who create Google Website Optimizer experiments jump ship and log out of the system. Don't worry if you don't have any of the items listed — Google Website Optimizer auto-saves your work as you go along.
If you log out at any point during the experiment setup process, you can log back in and pick up where you left off. For an A/B experiment you'll need to choose your test page (original page) and your variation page(s), and identify your conversion page. When you're finished reviewing this page, click the I've Completed . . . checkbox at the bottom to continue to the next step.
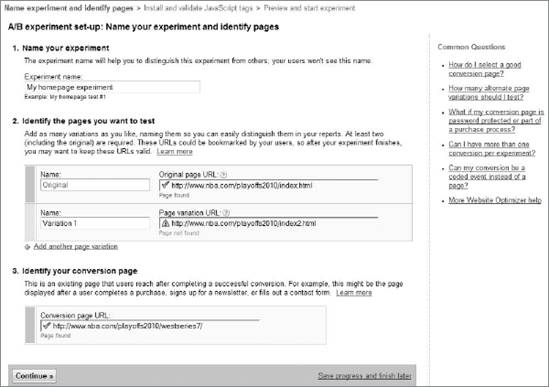
Now it's time to name your experiment and identify your experiment pages. Figure 11-11 shows what the page for this step looks like. On the very top, give your experiment a unique name.
Then identify the pages of your experiment by pasting the full URL of the page as it appears online. This means that you'll have to upload your varia-tion pages online so that Google Website Optimizer can go and check that they exist and are ready to go. (Notice in my example in Figure 11-11 that Google Website Optimizer can't find the index2.html page, and that it gives me an error message under the URL.) Lastly, identify your conversion URL. When all pages of your A/B experiment have been found, click Continue to get the necessary JavaScript tracking codes.
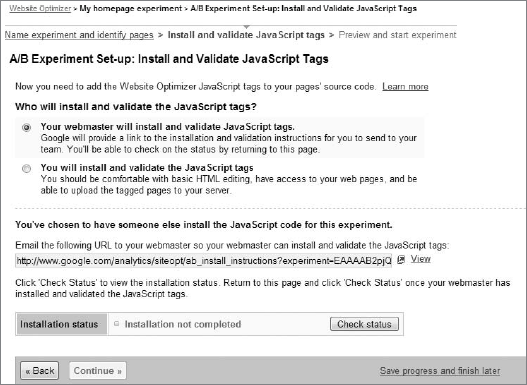
Now comes the tricky part of setting up an experiment. Check out Figure 11-12, which is the page you see after identifying your experiment pages. First you'll need to select the party that is going to be responsible for setting up the Google Website Optimizer tracking codes. If it's your webmaster, as in Figure 11-12, you'll be provided with a link that you can forward to your webmaster. He or she will then need to follow the on-screen instructions and install the JavaScript snippets on the original, variation, and conversion pages that you identified in Step 6.
If you're the person who is going to install the tracking codes, you'll receive an additional page that will provide you with the necessary JavaScript snippets.
Before you're allowed to continue to the next step, you'll need to click the Check Status button toward the bottom of the page. As you can see in Figure 11-12, the status shows as not completed. Until the JavaScript tags are installed entirely correctly, you will not be allowed to continue to the next step.
I'll get more technical and show you JavaScript snippet examples in Chapter 13.
Once your tracking codes are finally installed properly, you'll be allowed to review your experiment settings and launch your experiment. Figure 11-13 shows you an example of what your review page may look like (it's always changing, so it may look slightly different from Figure 11-13). You'll see your experiment pages (which you can click to preview), the total number of combinations (in an A/B experiment it will be two), the total traffic sent through the experiment, and some other settings, including experiment notes. Once you've finished reviewing your experiment settings, it's finally time to launch the experi-ment. Click Launch Experiment (which is cut-off from Figure 11-13 — but when you reach this page online, it will be at the bottom of the screen). Your experiment will now be live on the Internet! Check back often to see the progress of your experiment and to see which variation Google Website Optimizer determines is the winning one for your site.
After your experiment concludes at the end of a few weeks or a month, you'll want to run follow-up experiments, as I mentioned earlier in this chapter. Don't just run one experiment and forget about Google Website Optimizer — get into the habit of running experiments to continually improve your website little by little.
The steps for creating a multivariate experiment with Google Website Optimizer are very similar to the steps for an A/B experiment. However, there is an extra editing step after you validate your JavaScript tracking code, which requires you to create your variations as shown in Figure 11-14.
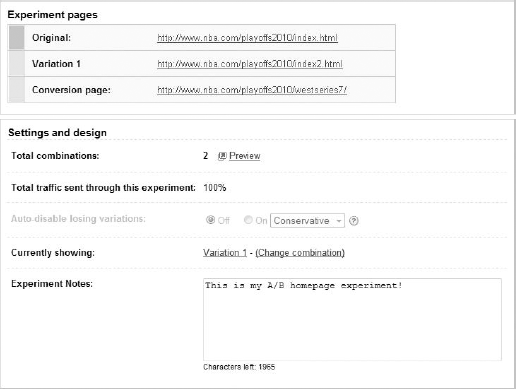
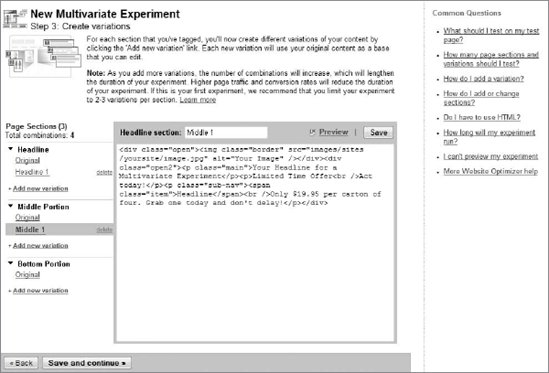
Figure 11-14 shows an example of the pages of a multivariate experiment being edited. In this example three page sections have been tagged on the actual experiment page. Your job is to create the variations right here within the interface. You can preview your variations before you upload them, and I highly recommend doing so to make sure your variation HTML doesn't break the page or cause any errors. You'll need to be somewhat familiar with HTML to be able to do this, because there is code that you may need to negotiate. We'll dive much deeper into this in Chapter 13.