
The last couple of chapters in Your Google Game Plan for Success are dedicated to broadening your horizons to include programs and tools that you can use within the Google ecosystem and outside the Google network. Google AdWords, Google Analytics, Google Website Optimizer, and the combination of those three platforms will take you places, but will only take you so far. You really need a wide-ranging variety of programs, tools, and knowledge at your disposal to truly distance yourself from the competition.
My experience in the search-marketing/web-analytics industry tells me that when you've read and understood the next two chapters, you're going to be in a better position than most of your competitors. There are simply not a lot of website owners and online advertisers using these tools and actively engaging in these programs. Quite a number of website owners and online advertisers aren't even aware that these programs exist. Even if you don't try every one of the programs in the next two chapters, you'll at least be exposed to them and understand how they work and what they're trying to show and tell you, which is more than can be said for most people (unfortunately for our industry, but fortunately for you).
First, let's take a look in this chapter at some Google-based programs that can be great additional resources for you to use. These programs all carry the Google brand, and simply searching for their names on Google will quickly bring up their respective URLs. I've separated this chapter into three categories:
Programs for analysis: These programs can add to your understanding of trends happening online that you can take advantage of.
Programs for your website: These online sites offer beneficial snippets of code and software that you can integrate with your website, enhancing the online experience for your website's visitors.
Programs for advertising: Google offers additional avenues not only for promoting your products and services on Google, but also for running ads on your own website.
Let's start by taking a look at some programs for analyzing what's happening online.
Google Analytics and other traditional web-analytics programs are designed to tell you what has happened on your website. Anything that happens outside your website (e.g., any developing trends or fast-rising searches) isn't going to be reported by your web-analytics package of choice. You may be able to get by for a while on simply analyzing the data from your own website, but eventually you'll have to evaluate developing trends in your industry and what other searches and websites your visitors are also using and visiting. Instead of being reactive by analyzing only your website's data, you'll become more proactive and spot outside trends and insights before they necessarily reach your website. Even an ostrich has to come up for air once in a while.
Two great, powerful programs within the Google ecosystem and available completely for free are Google Insights for Search (www.google.com/insights/search) and Google Trends (www.google.com/trends).
At the Insights for Search site you'll be able to compare search-volume patterns across search terms, locations, and time ranges to better understand the trends that are developing online. It's critical to be able to spot these trends and predict what will happen next; otherwise, your competitors may have a leg up on you and take advantage of an opportunity before you have the chance.
Let's walk through some examples of setting up your comparative data so that you can get a better idea of what you should expect to see. You'll need to build your comparison and specify certain criteria before seeing your data. At the top of the Google Insights for Search homepage you'll be able to select one of three different options by which to compare data. First, you can compare multiple search terms — up to five at any one time. As shown in Figure 17-1, you can enter your search terms in the boxes provided (you'll need to click Add Search Term, which is a text link that appears below the first box, to add more search terms to compare). Then, to its right, apply the filter conditions by which you want to compare your data. The first drop-down menu is defaulted to Web Search, but this can be changed to compare data by Image Search, News Search, or Product Search. The second drop-down menu allows you to select the countries or territories that you want to compare. By default, this is set to Worldwide. When you select an individual country (I've chosen the United States), you can further refine your data by subregion and even further by metro area.

The third drop-down menu, which defaults to "2004–present," is the date range. You can select any individual year since 2004 or choose options like "Last seven days" or "Last 30 days"; you can even specify your own custom date range. Finally, the fourth drop-down menu allows you to select the specific category by which you want to view your data.
Please be aware that the more you refine your filters, the less data will be available. When you are finished putting together your search terms and filter criteria, click Search and prepare to see some very interesting stuff! Don't worry — you can edit your search terms and filters on the fly on the next screen.
After you click Search, the page will refresh and data will be presented to you. The next two screenshots come from the same page, but I've broken them into two halves. The first (top) half of your Google Insights for Search results is shown in Figure 17-2. At the top of the figure you can see the five search terms that I used and my filter options, as well as some related categories. To the right of this, the averages for each line on the graph are displayed and color-coded (sorry, folks — you can't make it out in the black-and-white screenshots). Below the averages appears a trending graph, showing the volume of searches for my chosen search terms during the chosen date range, which in this example was the last 90 days. The largest spike shown here is for the term World Cup, and the date is Saturday, June 12, 2010. This coincides with the United States's first World Cup match against the United Kingdom, which happened the afternoon of June 12, 2010. Clearly you can begin to deduce how online search behavior is affected by offline events, such as the World Cup.

Below the trending graph is a regional interest breakdown, showing the top 10 search regions for the first keyword term (click the Regional Interest drop-down menu to view regional interest for other search terms). Below and to the right of the trending graph is a Map Overlay feature that displays the interest in a particular keyword over the selected date range. You can modify this map to show the interest at the metro and city levels, which will also update the regional interest data on the left of the map.
The second (bottom) half, which appears below the Regional Interest and Map Overlay breakdown, is shown in the bottom half of Figure 17-3. At the bottom left you can view the top 10 search terms related to the selected search term, based upon the search term that you have selected from the drop-down menu directly above the list. To the right you are shown the top 10 rising search terms. These are search terms that, in your date range, have been climbing in popularity, based on your filter and search criteria.

My World Cup example shows what happens when an offline event affects the online search world. But much of the time offline events aren't influencing online behavior.
A great advantage for you, the business and website owner, is your ability to use this information for research on your AdWords campaigns. Discover search terms related to your queries that are rising in popularity and those that people search for online. If you run geo-targeted campaigns you can really harness the power of Google Insights for Search by drilling down through country, subregion, metro, and even city levels to view top search keywords and fast-rising keywords that you can bid for within your own campaigns. You can also get an idea about competitor penetration on your brand and keywords that you're bidding for. Are there competitor search phrases appearing for keywords you're bidding on? This could be a sign that a competitor is penetrating your market and creating enough interest online to influence the data you see.
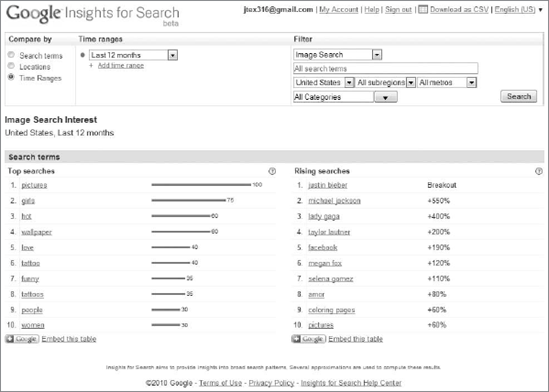
Here's one more example of Google Insights for Search, in Figure 17-4. By applying the Time Ranges comparison for the last 12 months with a filter of Image Search in the United States, I can see the top 10 search terms and rising searches that U.S. users are performing on Google Images. The term "justin bieber" is considered a breakout search term by Google because that search term has experienced a change in growth of more than 5,000 percent! Two other fast-rising search terms on Google Images within the United States in the last 12 months were "michael jackson" and "lady gaga."
Note
In a few of the previous figures you may have noticed that I was signed in with my Google account to Google Insights for Search. You do not have to be logged in to your Google account, or even have one, to use Google Insights for Search.
Google Trends, the URL of which was given earlier, is another great Google-based program that can augment your analysis efforts. While Google Insights for Search provides refined, detailed, and specific data, Google Trends specializes in the analysis of broad search patterns. There are also a few data points within Google Trends that are not available in Google Insights for Search, such as website trends and visited sites.
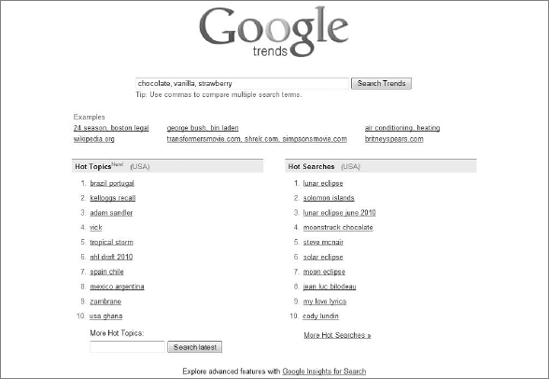
Let's start with Figure 17-5, which is the Google Trends homepage. Here, you can enter comma-separated search terms for which you want to view trending data. Below the search bar are hot topics on the bottom left and hot searches on the bottom right. In Figure 17-5 I entered "chocolate, vanilla, strawberry" into the search bar.
Figure 17-6 is the search results page showing you the data from the search phrases that you entered on the homepage. On the top right, you can filter your results by region and subregion (it defaults to show you data for all regions). You can also filter your results by time period (the default of "All years" includes all data since 2004, but as with Google Insights for Search, you have multiple options here). In the middle of the screen two color-coded trending graphs are provided. The first shows the search volume index, and the second (the small one) displays the news reference volume. The higher trending-graph line in the Search Volume Index graph in Figure 17-6 represents my chocolate search term; the higher of the bottom two lines represents the strawberry search term; the almost flat trending-graph line represents vanilla.
To the right of the trending graphs you can see the related news articles that correspond to the annotations in the trending graphs. Click any news article to be taken directly to it (you'll be taken to the website where the article appears). On the bottom half of Figure 17-6 you can view the interest for each search term you entered in terms of region, city, and language. These are also color-coded, and each search term's color corresponds to the color of these smaller graphing lines. Obviously, people search for chocolate a lot more than they do for the other Neapolitan flavors!
You may have noticed something in Figure 17-6 — the words Searches and Websites at the upper left of the screen. With Google Trends you can analyze trends not only by comma-separated search terms but also by websites. Clicking the Websites link on the upper left of the Google Trends website will generate a message telling you there is no data to display to you. This is because your comma-separated search terms are not domain names. So enter at least one domain name to obtain website trend data. In Figure 17-7 I've decided that I'd like to compare three websites similar in nature: www.target.com, www.kmart.com, and www.kohls.com.

First, near the top of the page, you can view a trending graph comparing search volume for the three websites. That lift in traffic that you see for all three sites coincides with the holiday season (specifically, around the time of "Black Friday," the biggest offline shopping day of the year). Naturally, online shopping activity picks up dramatically at that time. The trending line with the largest volume is www.target.com, followed by www.kohls.com in a very distant second and leading www.kmart.com by a small amount.
The three columns of information below the trending graph are what savvy online analysts and marketers dream of. This data offers an insight that is not easy to find online. Companies like Hitwise (www.hitwise.com) can offer this type of competitive intelligence and website trend data, but be prepared to pay a substantial amount for it.
The first column on the left-hand side breaks down the website trends by subregion. This could be valuable information for any pay-per-click advertiser considering (or running) geo-targeted campaigns. Naturally, you'll want to point your ads to the geographic areas that are generating the most interest. However, in the United States most of the interest for national advertisers usually comes from the top five regions listed in Figure 17-7 (California, New York, Florida, Texas, and Illinois). Most businesses that sell online nationally and most websites that generate any type of significant volume will get most of their traffic from these five states.
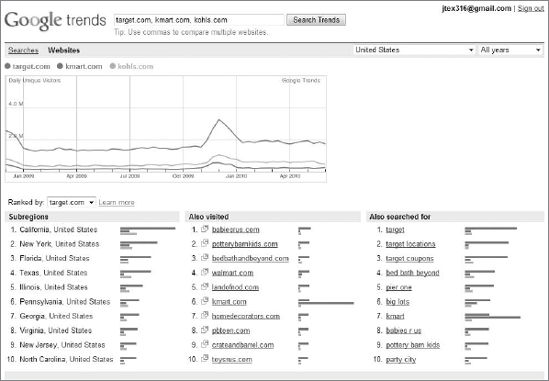
The middle column shows the top 10 sites that visitors visit before or after they visit the site being analyzed. This is excellent competitive research data, as you can see if your visitors are also viewing your competition's websites. For example, in Figure 17-7, visitors viewing the www.target.com website are also viewing sites like www.babiesrus.com and www.potterybarnkids.com. These sites may indicate areas in which www.target.com is not very strong, leading visitors to try to find products elsewhere. Luckily for www.target.com, there doesn't seem to be too much direct-competitor penetration. Study this column for your own website to see what other websites your visitors are viewing.
The column on the far right shows you search terms that visitors to your website are using online. This can give you great ideas for search terms to bid for in your pay-per-click campaigns or keywords to optimize for in your SEO efforts. In the previous example users searched for brand-oriented words, as well as some competitor search terms like pier one and bed bath beyond.
Google Trends data is available for export in a CSV file. When you are using this interface, look at the very bottom of the page: you'll see a link enabling you to download your data in a CSV file.
Both Google Insights for Search and Google Trends offer great additional insight into what people are doing outside your website. Once again, this data isn't available in Google Analytics or any web-analytics package.
The second category of free programs at your disposal from Google includes programs you can use to improve or add to your website. Tools like Google Webmaster Tools are necessary for search engine optimization (SEO) work, and can provide insight into what search engine spiders/robots are doing (knowing how search engine spiders crawl your website's pages is key to understanding how your website is working from a technical point of view). In recent years Google acquired FeedBurner, which manages your RSS feeds and provides reports and information on your feed's subscribers and what feed readers they are using.
Google Webmaster Tools comes very highly recommended by webmasters. It's a program that provides you with detailed instructions not only for verifying your site with Google, but also for providing Google with what is known as a site map — a roadmap to your site's pages that Google can index, adding your site's pages to its ever-growing database. Using Google Webmaster Tools helps your website get listed on Google, which allows visitors to find your site without having to click on a pay-per-click advertisement.
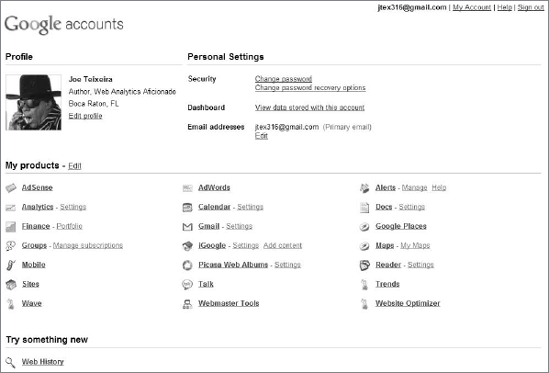
The first thing you'll need to do is sign in to the Google account that you created in order to use a Google AdWords, Google Analytics, or Google Website Optimizer account. Then visit www.google.com/webmaster/tools and sign in to Google Webmaster Tools. From there you can find the link to Webmaster Tools under My Products, as shown in Figure 17-8.
When you arrive at your Google Webmaster Tools homepage, the first thing you'll need to do is add your site for verification. This process involves a couple of steps, and at this point it's important that you obtain the assistance of your web developer or IT person, because you'll need to add a bit of HTML code to your website's homepage.
First, at the Google Webmaster Tools homepage, click Add to Site, which is a silver button on the bottom of the page (it should be a very empty-looking page if this is your first time in this program). Once you do so, a text field should pop up, in which you can insert the URL of your website. Google Webmaster Tools allows you to add up to 1,000 sites, and Google recommends adding any sub-domains and other versions of your domain (such as www.yoursite.com and yoursite.com without the www prefix).
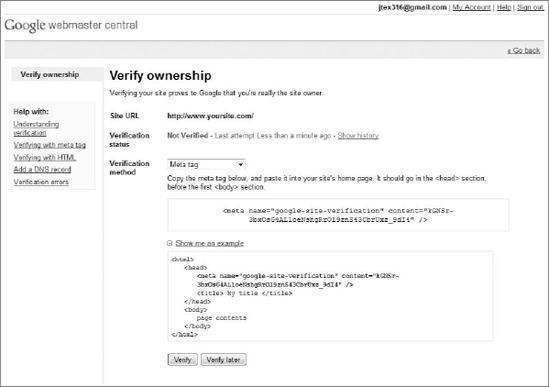
Once you click Continue you'll be taken to the screen that you see in Figure 17-9, where you can view the status of your verification and choose your website-verification options. Google provides you with three different ways to verify your site. You can add a verification meta-tag on your website's home-page in the <head> portion of the code; you can download a verification file in HTML to upload to your web server (step-by-step instructions are provided on the page); or you can add a domain name system (DNS) record. This page also provides you with additional information on the three verification options. Once you have implemented one of them, revisit this page in your Google Webmaster Tools account and click Verify, which will be at the bottom of the page. The webpage will inform you whether your verification was successful.
After you verify your site you'll be able to update your preferred domain and geo-targeting settings. Both of these settings help Google understand more about your website, and help the Google search algorithm deliver better organic search engine results to your visitors.
After updating your settings you can view lots of reports about the technical aspects of your website and how your website is found and ranked by Google. Crawl Errors is a report found within Google Webmaster Tools that will show you any URLs on your site that Google tried and failed to crawl. The Links to Your Site report shows you the web pages on the Internet that have links pointing to your website (as long as they have also been verified by Google Webmaster Tools). The Search Queries report shows you the number of times your web pages have come up in search results, including how many impressions and clicks they received and their click-through rates. This report is great for diagnosing whether your site is appearing in irrelevant searches (if it is, you have some SEO optimization work to do that's beyond the scope of this book). Google Webmaster Tools can also give you HTML advice for your site and notify you if your website has been hacked. Figure 17-10 shows the Overview screen of a Google Webmaster Tools account.
Check Appendix A at the end of this book for some links to more information about Google Webmaster Tools.
Another great tool for your website is Google Feedburner (http://feedburner.google.com/). If you have a blog and want to make it easy for readers to receive, read, and understand updates as you publish them, you can use Really Simple Syndication (RSS) powered by Google Feedburner.

You (or your webmaster) have most likely set up an XML, RSS, or ATOM feed for your blog. The universal feed subscription icon has probably also been added to your site so your blog's readers can subscribe to your updates and read your updates in such feed-reader programs as Google Reader, NewsGator, and My Yahoo!. Google Feedburner is essentially a one-stop shop for feed management, diagnostics, traffic reports, add-ons, and a host of other tools.
Figure 17-11 shows the Google Feedburner homepage. From here you can analyze and view traffic-statistic information, the number of subscribers to your feed, and the reach (clicks) on your feed items from feed readers. You can also optimize your feed's delivery by enabling browser-friendly options, pagefriendly options, and photo- and video-friendly options. Within the interface you can also troubleshoot technical problems and set up programs like Google AdSense for blogs.
Again, please consult your webmaster or IT person to help you with Google Feedburner.
Google offers some neat advertising-based programs that allow you to further promote your products and services, or to promote yourself. Using Google AdWords you're already advertising to an audience of potential customers on Google's search engine and Content Network Partners. Using a few other Google-based programs, like Google TV Ads and Google Merchant Center, you can reach a whole new base of potential customers and further spread your message. You can become a member of the Google Content Network yourself and earn revenue for running ads on your own site by signing up for Google AdSense.

In Chapter 14 you saw a TV Ads report within the AdWords report subsection of Google Analytics. When you run TV ads with Google, your data will appear not only in AdWords but also in this report section in Google Analytics. TV ads are exactly what they sound like — your video ads running on select television stations across the country! As you can imagine, Google puts you, the advertiser, in full control of where, when, and how your ads run on television. There's even a marketplace for finding and negotiating with media companies to create TV ads for you if you aren't equipped to do that yourself.
Google TV Ads are much more expensive than text, image, or online video ads, so you'll definitely need to have the budget for them. I can't tell you how much such ads will cost, because a lot of factors play into the total cost of running (and possibly creating) an ad with Google. It depends on what you're looking to do, in what markets you're willing to advertise, and what times of day you want your ads to run.
To begin your Google TV Ads adventure, sign in to your Google AdWords account and navigate to your Campaigns tab. Scroll to the bottom of the Campaigns sub-tab to find a text link for creating your TV campaign. Clicking that link will send you to a page that looks pretty much like the screenshot in Figure 17-12. Click Start Now on the upper left to begin creating your TV cam-paign (or click the video or other links to learn more about the program and how it works, which I recommend).

Once you click Start Now you'll see a campaign-creation screen, as shown in Figure 17-13. First, name your campaign, set a default bid, and create a daily budget. The default bid is the maximum cost-per-thousand-impressions bid that you're willing to make (do understand that a thousand impressions is not all that many when it comes to television advertising). Then select whether or not you want to create a TV ad using Google's Ad Creation Marketplace (more on that in a minute), or using SpotMixer, a third-party TV ad-creation tool (not free, and you must first agree to terms and conditions before leaving to SpotMixer's website). You can also upload your own TV ad, provided that you own your TV ad in a digital file that you can upload through the Google TV Ads interface.
After reviewing these options you can enable some advanced settings for your TV ads. First, you can specify active date ranges, which are good if you are running sales or promotions within a certain window of time. Then you can edit your audience, distribution, days, and times, and specify whether or not you want your ads to run during paid programming. Paid-programming spots are generally less expensive than regular spots, but understand that paid programming essentially consists of very long advertisements (so you'd be advertising during an advertising spot).

Finally, you have reporting options for traffic and billing. Hit Save and Continue on the bottom of the campaign settings screen to save your work and view your TV campaign reports.
A few paragraphs ago I mentioned Google's Ad Creation Marketplace. Suppose that you want to advertise with Google's TV Ads and you don't have a TV ad ready to upload. Using this marketplace you can seek out media companies or individuals who can help you create a TV ad. You can view what they are charging and samples of their work, and interact with them through this secure interface. You can also pay for services rendered within the marketplace. These media companies or individual contractors cannot do any of the marketing for you, but they can create a TV ad that will promote your product or service.
After examining Figure 17-14, where I show the Google Ad Creation Marketplace homepage, start to think about whether or not Google TV Ads is something you can comfortably afford to get involved in. You're probably looking at five-figure spending as an absolute bare minimum to create and run a TV ad for a couple of weeks. The viewers of your TV ads do not have the luxury of clicking them to be taken directly to your website; you're going to have to urge the viewer to visit (probably more than once), and your domain name will have to be easy to remember. TV advertising is a whole different ball game from online advertising, and even with all the great data Google can provide, it's still not easy to determine how effective your TV spots were.

A far more affordable form of advertising than Google TV Ads is Google's Merchant Center, which allows you to upload product feeds that can appear on Google shopping and www.google.com organic and paid search results. This Google product is designed specifically with the e-commerce merchant in mind. Visit www.google.com/merchants and sign in to your Google account to findfile specifications; then download a template of a product feed, insert your data into the template, and upload your product feed in a tab-separated text file (the instructions are very clear on the Google Merchant Center). Chances are pretty good that you already have a product feed or database file that you can export into a spreadsheet program like Microsoft Excel.
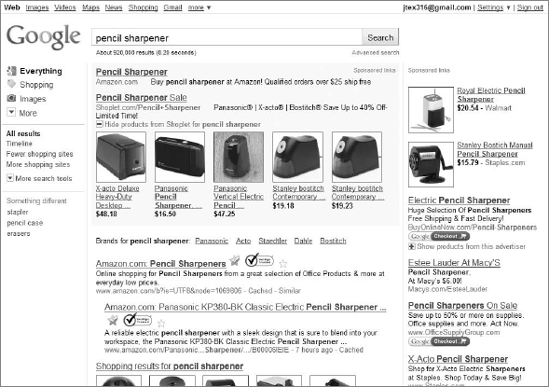
As you learned in Chapter 2, if you do have an active feed on Google's Merchant Center and are using product thumbnail images, those images can appear on your pay-per-click ads, as well as your organic search engine results. This can greatly enhance the strength of your brand for potential customers and make it more appealing for search engine users to click on your ads. In a recent search for the phrase "pencil sharpener" on Google, I saw an ad from www.shoplet.com that had product images, prices, and links from within its pay-per-click ad, as shown in Figure 17-15. Other Google Merchant Center shopping results can be seen partially at the bottom of Figure 17-15, and a few national-brand conglomerates like Walmart and Staples are shown toward the right-hand side.
A Google program you may want to think about for your own website is Google AdSense. You've read about it already in a few previous chapters, and you know that you have a section of reports in Google Analytics dedicated to this product. Basically, Google AdSense allows website owners to earn revenue by allowing Google to serve up Content Network text, image, video, and rich media ads on their sites, which results in Google paying website owners for clicks on those ads.
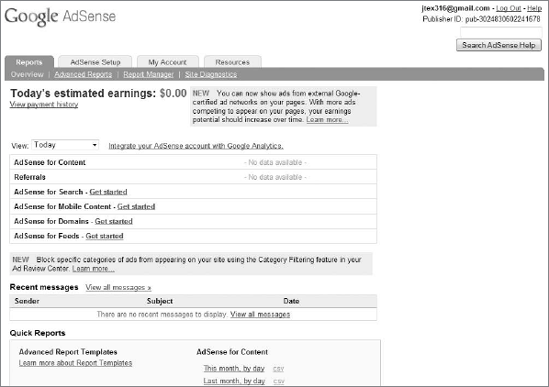
Log in with your Google account at www.google.com/adsense/home and set up your AdSense account by following the very simple on-screen instructions. Google handles the payment for your generated clicks through the online interface, so you'll need to enter in banking information (like check-routing numbers). After you set that up, you will have an entire interface at your disposal, as shown in Figure 17-16. Unfortunately, no one has clicked on any ads on my website; because of this there's no estimate of any earnings from Google.
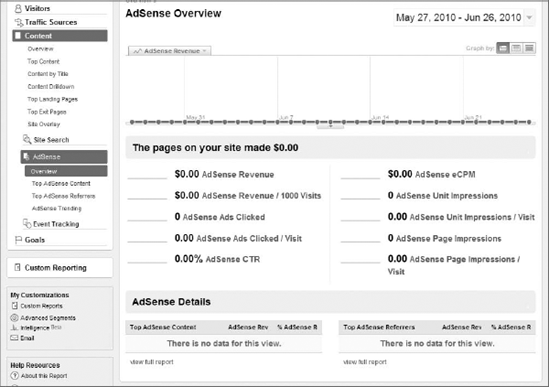
If the e-mail address that you use to log in to AdSense is the same address that's an administrator on your Google Analytics account, you'll be able to see reports within the Content section. Figure 17-17 shows the AdSense report section in Google Analytics. Again, there's no actual data to display, but you can get a sense of the types of metrics and reports Google Analytics pro-vides for your AdSense analysis. Revenue, click-through rate, impressions, top referrers, and top content are just some of the data that this subsection of reports provides. Now if you, unlike me, collect some of that data, you'll be loving this section!
I hope this chapter gave you some good ideas about the possibilities that exist in the seemingly endless ecosystem called Google. But there are other tools out there on the Web that don't belong to Google, and that's what this book's final chapter will cover.