
Chapter 10
Network Management and Monitoring Configuration
After reading Chapter 9, “Monitoring ACI Fabric,” you should now be well versed in the various monitoring protocols and techniques that Cisco Application Centric Infrastructure (ACI) offers. Now, it’s time to examine the configuration steps of each of these management and monitoring protocols and techniques. In ACI, although you can configure policies by using the GUI, the CLI, the REST API, and SDKs, this chapter covers only the GUI method of policy configuration and use of the APIC CLI for verifying configurations. This chapter covers the following topics::
ACI management
ACI monitoring
Out-of-Band Management
ACI offers out-of-band (OOB) management for managing the APICs and switches in a fabric. This is the preferred method because it enables efficient management and monitoring in the event of any failure in the fabric. ACI OOB management uses two RJ-45 management ports on APICs for redundancy; these ports can be connected to any OOB management network with 10/100/1000BASE-T connectivity options.
Note
You can configure the OOB management addresses either by statically assigning them on fabric nodes of your choice individually or by defining the range of fabric nodes and letting the APIC assign the OOB addresses from the management subnet automatically. Our in-field recommendation is to configure static management addresses individually on each fabric node.
Configuring OOB management in ACI involves the follow basic steps:
Step 1. Create static OOB management addresses and associate them to the OOB node management EPG.
Step 2. Create an OOB contract.
Step 3. Choose the OOB contract as a provided contract under the OOB node management EPG.
Step 4. Create an external management entity instance (that is, an external management EPG) with external prefixes allowed to access and manage the ACI fabric infrastructure and use the OOB contract as a consumed contract.
The following sections describe the details of these steps.
Creating Static Management Addresses
To create a static OOB management address, in the APIC GUI you need to go to Tenants > mgmt > Node Management Addresses > Static Node Management Addresses and right-click Create Static Node Management Addresses. In the dialog box that appears (see Figure 10-1), you need to fill out the ACI node static management addresses individually (for APICs, leafs, and spines).
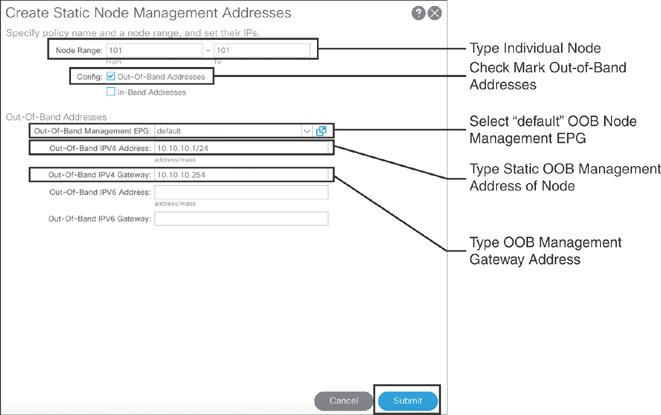
Figure 10-1 Creating OOB Static Node Management Addresses
You need to create individual static node management addresses for all ACI fabric infrastructure (APICs, leafs, and spines). You can follow the process just outlined to create the rest of the addresses.
Creating the Management Contract
For an OOB management contract, you first create the filter with specific management ports and protocols. To do so, from the APIC GUI you need to go to Tenants > mgmt > Contracts, right-click Filters, and click Create Filter, as shown in Figure 10-2.
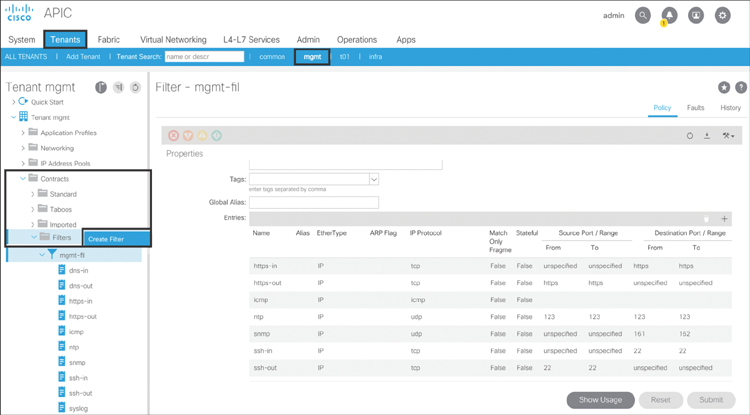
Figure 10-2 Creating a Management Filter
As shown in Figure 10-3, in the dialog that appears, type mgmt-fil as the filter name and then click the + sign to add the management ports and protocols (in this example, syslog).
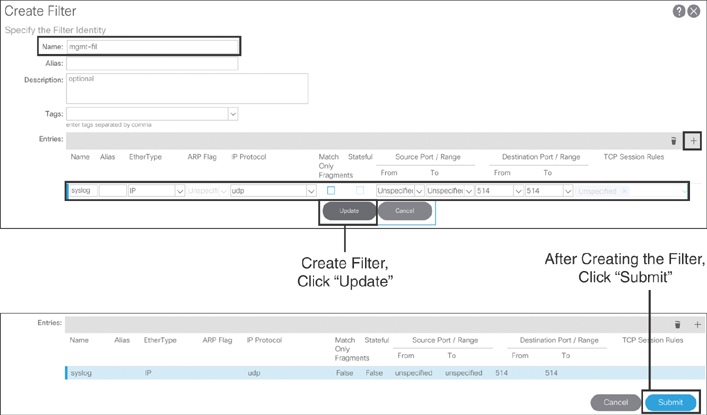
Figure 10-3 Creating Management Filter Ports/Protocols
This section has shown how to create a filter with just one syslog entry. However, based on field experience, it is recommended that you create a filter with the management ports and protocols listed in Table 10-1. You can follow the process just outlined to create the rest of the ports and protocols.
Table 10-1 Management Filter Ports/Protocols
Name |
EtherType |
IP Protocol |
Source Port/Range |
Destination Port/Range |
||
From |
To |
From |
To |
|||
syslog |
IP |
UDP |
Unspecified |
Unspecified |
514 |
514 |
snmp |
IP |
UDP |
Unspecified |
Unspecified |
161 |
162 |
icmp |
IP |
ICMP |
Unspecified |
Unspecified |
Unspecified |
Unspecified |
ntp |
IP |
UDP |
123 |
123 |
123 |
123 |
https-in |
IP |
TCP |
Unspecified |
Unspecified |
https |
https |
https-out |
IP |
TCP |
https |
https |
Unspecified |
Unspecified |
ssh-in |
IP |
TCP |
Unspecified |
Unspecified |
22 |
22 |
ssh-out |
IP |
TCP |
22 |
22 |
Unspecified |
Unspecified |
dns-in |
IP |
TCP |
Unspecified |
Unspecified |
dns |
dns |
dns-out |
IP |
TCP |
Dns |
dns |
Unspecified |
Unspecified |
tacacs |
IP |
TCP |
Unspecified |
Unspecified |
49 |
49 |
After creating a management filter, you need to create the OOB contract. On the left side of the policy navigation pane, expand Contracts, right-click the Out-of-Band Contracts tab, and click Create Out-of-Band Contract. In the dialog that appears (see Figure 10-4), you need to type oob-cnt as the contract name, choose VRF as the scope, and click the + sign to create the subject. In the new dialog that appears, enter oob-sbj as the subject name, click the + sign, and select mgmt-fil from the Filters drop-down menu.
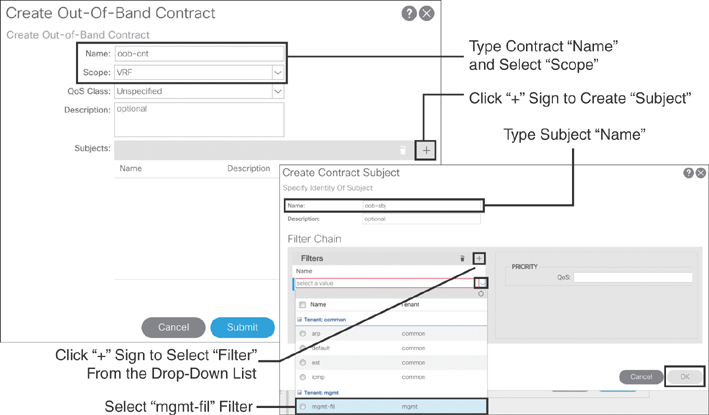
Figure 10-4 Creating an OOB Contract
Choosing the Node Management EPG
As you already know, ACI groups all endpoints (for all ACI infrastructure: APICs, leafs, and spines with management IP addresses) to endpoint groups (EPGs). An EPG is the object on which ACI applies policy enforcement. This concept remains intact even with management traffic. In order to create an OOB node management EPG, on the left side of the APIC GUI pane, navigate to Node Management EPGs > Out-of-Band EPG - default. On the right side of the pane, click the + sign to add the oob-cnt contract as a provided contract (see Figure 10-5).

Figure 10-5 Choosing the OOB Node Management EPG
Creating an External Management Entity EPG
For an OOB external management entity instance, also known as an out-of-band external management EPG, on the left side of the policy navigation pane in the APIC GUI, right-click External Management Network Instance Profiles and select Create External Management Network Instance Profile. Then, on the right side of the pane, type oob-ext as the object name, click the + sign to add the OOB contract as a consumed contract, and click Update. Click the + sign to add the subnets allowed to manage and access the ACI fabric from external networks (in this case, 0.0.0.0/0). Click Update and then click Submit. Figure 10-6 illustrates this process.

Figure 10-6 Creating the OOB External Management Entity Instance
You should now be able to use the OOB management network for managing and monitoring the ACI fabric.
Verifying the OOB Management Configuration
For verification, you can check various configuration items, but the main objective is to check the OOB management functionality. To do this, you can establish a Secure Shell (SSH) session to one of your ACI nodes by using its OOB management IP address, as shown in Example 10-1.
Example 10-1 Connecting to an APIC by Using SSH
Sadiq-laptop$ ssh [email protected]
Application Policy Infrastructure Controller
[email protected]'s password:
Last login: 2019-11-05T16:35:13.000-05:00 UTC
apic1#
apic1#
To check the OOB configuration, you can run the commands shown in Example 10-2 on the APIC via the CLI.
Example 10-2 Verifying the OOB Configuration
apic1# show tenant mgmt contract oob-cnt
 Tenant  Contract   Type      Qos Class    Scope  Subject  Access-group  Dir
  Description
 ------  --------   --------  -----------  -----  ------   ------------  ----
  ------
 mgmt    oob-cnt     oob-mgmt  unspecified  vrf    oob-sbj  mgmt-fil     both


apic1# show tenant mgmt access-list mgmt-fil
Tenant      : mgmt
Access-List : mgmt-fil
    match icmp
    match tcp dest 22
    match tcp src 22
    match tcp src 443
    match tcp dest 443
    match udp src 123 dest 123
    match udp dest 161-162
    match udp dest 514
    match udp dest 53
    match udp src 53
        match tcp dest 49

apic1# show running-config tenant mgmt oob-mgmt
# Command: show running-config tenant mgmt oob-mgmt
# Time: Wed Nov 13 21:47:34 2019
  tenant mgmt
    oob-mgmt epg default
      contract provider oob-cnt
      exit
    exit

apic1 # show running-config tenant mgmt external-l3
# Command: show running-config tenant mgmt external-l3
# Time: Wed Nov 13 21:51:57 2019
  tenant mgmt
    external-l3 epg OOB-ext oob-mgmt
      match ip 0.0.0.0/0
      contract consumer oob-cnt
      exit

apic1# show oob-mgmt switch 1001

Table1 : OOB-Mgmt Node Details

 Type             Node ID   Ip Address      Gateway       OOB-EPG      Oper State
 ---------        -------   -----------     --------      -------      ----------
 Leaf-1001        1001      10.10.10.11/24  10.10.10.254  default       up

Table2 : OOB-Mgmt EPG Details

 Name             Qos              Tag              Nodes       Oper State
 ---------------  ---------------  ---------------  ----------  ----------
 default          unspecified      49154            101         up
 default          unspecified      49154            102         up
 default          unspecified      49154            201         up
 default          unspecified      49154            202         up
 default          unspecified      49154            1001        up
 default          unspecified      49154            1002        up

Table3 : OOB-Mgmt EPG Contract Details

 Provider OOB-Mmgt-Epg  Contracts        Consumer OOB-Mgmt Ext-L3 Epg
 ---------------        ---------------  -------------------------
 default                oob-cnt          OOB-ext

 Table4 : OOB-Mgmt External L3 EPG Details

 Name             Qos              Contract         IP Network
 ---------------  ---------------  ---------------  ----------
 OOB-ext          unspecified      oob-cnt          0.0.0.0/0
In-Band Management
In addition to supporting OOB management, ACI offers in-band (INB) management, which is suitable for enterprises that do not want the extra expense of an OOB management infrastructure. Also, INB is a good choice for environments where a predefined row of racks with application servers are hosted in the data center and there is not much room available for extra switches aside from ACI ToR leafs. Furthermore, if you have Cisco Tetration deployed, you must use INB.
Note
You can configure the INB management addresses either by statically assigning them on fabric nodes of your choice individually or by defining the range of fabric nodes and letting the APIC assign the INB addresses from the management subnet automatically. Our in-field recommendation is to configure static management addresses individually on each fabric node.
Configuring INB management in ACI involves the following basic steps:
Step 1. Create an INB contract.
Step 2. Create access policies for the leaf(s) connected to APICs.
Step 3. Create access policies for the border leaf(s) connected to the external router(s).
Step 4. Create an INB management external routed network (L3Out) and choose a routing method.
Step 5. Create networks (external management EPGs) under the INB L3Out and choose the INB contract as a consumed contract.
Step 6. Create an INB BD with a subnet.
Step 7. Under the INB node management EPG, type encap-vlan, choose the INB BD, and choose the contract as a provided contract.
Step 8. Create static INB management addresses and associate them with the INB node management EPG.
The following sections describe the details of these steps.
Creating a Management Contract
For an INB management contract, you can use the same filter you created earlier for the OOB contract (refer to Figure 10-2 and Figure 10-3). After you create the INB management filter, you need to create the INB contract. On the left side of the policy navigation pane, expand Contracts, right-click Standard, and click Create Contract. In the dialog that appears, you need to type inb-cnt as the contract name, choose VRF as the scope, and click the + sign to create subject. Then type inb-sbj as the subject name, click the + sign, and select mgmt-fil from the Filters drop-down menu (see Figure 10-7).

Figure 10-7 Creating an INB Contract
Creating Leaf Interface Access Policies for APIC INB Management
To perform INB management on an APIC, you need to create interface access policies for leafs connected to the APIC. In order to do that, you first create a leaf interface access port policy group: Go to Fabric > Access Policies > Interfaces > Leaf Interfaces > Policy Groups, right-click Leaf Access Port, and click Create Leaf Access Port Policy Group. In the dialog that appears, type mgmt-inb-polgrp as the name of the object and fill out the desired interface policies, as shown in Figure 10-8.

Figure 10-8 Creating a Leaf Interface Access Port Policy Group (on an APIC)
Next, you have to create the leaf interface profile. To do so, go to Fabric > Access Policies > Interfaces > Leaf Interfaces, right-click Profiles, and click Create Leaf Interface Profile. In the dialog that appears, type 301-302-int-prof as the name of the object and click on the + sign to select the leaf interfaces that you connect to APIC. Fill out the desired access port selector policies and choose mgmt-inb-polgrp from the Interface Policy Group drop-down menu (see Figure 10-9).

Figure 10-9 Creating a Leaf Interface Profile (on an APIC)
Follow the same procedure to add more leaf interfaces connecting to APICs. When you finish the leaf interface policies, you need to create the leaf switch policies. Select Fabric > Access Policies > Switches > Leaf Switches, right-click Profiles, and click Create Leaf Profile. As shown in Figure 10-10, click the + sign and select the leaf selectors. In the dialog that appears, type L301-L302 as the object name and select the appropriate leaf block (in this example, leaf nodes 301 and 302). Click Next to go to the Step 2 screen, where you can choose the previously created interface selector profile. Click Finish.

Figure 10-10 Creating a Leaf Switch Profile (on an APIC)
Creating Access Policies for the Border Leaf(s) Connected to L3Out
As mentioned earlier, the ACI fabric provides INB management capabilities through its infrastructure. INB management traffic requires a path to flow in and out of the fabric. This can be achieved by establishing an L3Out from ACI border leafs toward external routers. However, before you create the L3Out in the mgmt tenant, you need to first create border leaf interface access policies connecting to external routers. To do that, you first create a leaf interface access port policy group: Go to Fabric > Access Policies > Interfaces > Leaf Interfaces > Policy Groups, right-click Leaf Access Port, and click Create Leaf Access Port Policy Group. In the dialog that appears, type l3-inb-polgrp as the name of the object, and fill out the desired interface policies (see Figure 10-11).
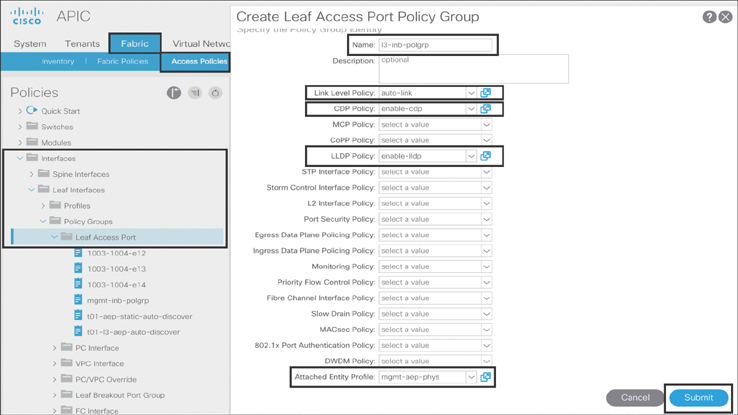
Figure 10-11 Creating a Leaf Interface Access Port Policy Group (L3Out)
Note
Ensure that the attached entity profile mgmt-aep-phys is part of external routed domain mgmt-dom-l3, which will be used while creating the INB management L3Out configuration shown in the next section.
Next, you have to create the border leaf interface profile. To do so, go to Fabric > Access Policies > Interfaces > Leaf Interfaces, right-click Profiles, and click Create Leaf Interface Profile. In the dialog that appears, type 201-202-int-prof as the name of the object and click the + sign to select the leaf interfaces that you want to connect to APIC. Fill out the desired access port selector policies and choose l3-inb-polgrp from the Interface Policy Group drop-down menu (see Figure 10-12).

Figure 10-12 Creating a Leaf Interface Profile (L3Out)
Follow the same procedure to add more border leaf interfaces connecting to external routers. When you finish the leaf interface policies, you need to create the leaf switch policies. Select Fabric > Access Policies > Switches > Leaf Switches, right-click Profiles, and click Create Leaf Profile. As shown in Figure 10-13, click the + sign and select the leaf selectors. In the dialog that appears, type L201-L202 as the object name and select the appropriate leaf block (in this example, border leaf nodes 201 and 202). Click Next to go to the Step 2 screen, where you can choose the previously created interface selector profile. Click Finish.

Figure 10-13 Creating a Leaf Switch Profile (L3Out)
Creating INB Management External Routed Networks (L3Out)
After you create the border leaf interface access port policies, you need to create the INB management external routed network, also known as L3Out. To do that, go to Tenant > mgmt > Networking, right-click External Routed Networks, and click Create Routed Outside. In the dialog that appears, fill out the attributes of the L3Out object policy: Enter l3out:p-inband-mgmt as the name of the object, keep the default route control enforcement policy, Export, select inb from the In-Band VRF drop-down menu, and select mgmt-dom-l3 from the External Routed Domain drop-down menu. Finally, choose OSPF with area ID 0.0.0.11 as the routing method and type NSSA for the area. You can use the OSPF area of your choice. Click Submit. Figure 10-14 illustrates these steps.

Figure 10-14 Creating an INB Management L3Out
Expand the newly created external routed networks object l3out:p-inband-mgmt, right-click Logical Node Profiles, and click Create Node Profile. Type inband-mgmt-node-prof as the name of the object, click the + sign, and add the node ID and router ID. Click OK and then click Submit. Figure 10-15 illustrates this process.
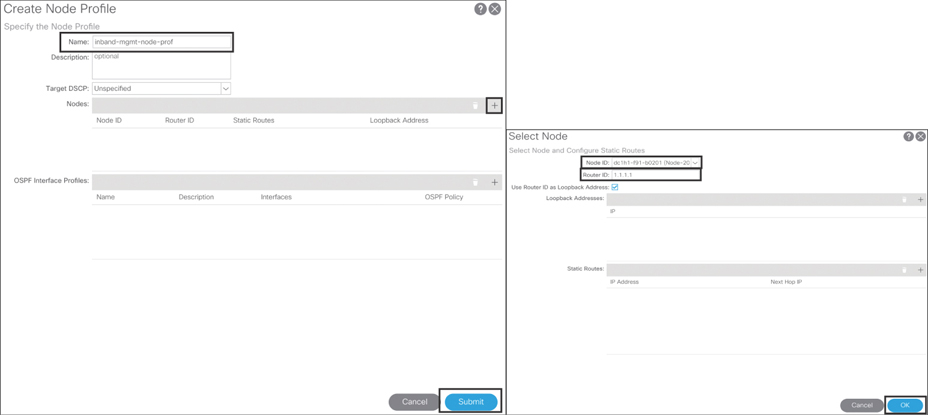
Figure 10-15 Creating an INB Management L3Out Logical Node Profile
You can add more node IDs and router IDs by following the same procedure, depending on how many border leafs you want to peer with external routers for INB management traffic flow.
Next, you need to expand the newly created logical node profile object inband-mgmt-node-prof, right-click Logical Interface Profiles, and click Create Interface Profile. As shown in Figure 10-16, a three-step configuration process begins. In the Step 1 dialog, type inband-int-prof as the name of the object and click Next.

Figure 10-16 Creating an INB Management L3Out Logical Interface Profile: Step 1
From the Step 2 dialog, under the OSPF Policy drop-down menu, select Create OSPF Interface Policy and configure necessary OSPF parameters. Figure 10-17 illustrates this process.

Figure 10-17 Creating an OSPF Interface Policy
Also in the Step 2 dialog, shown in Figure 10-18, choose the OSPF Authentication Type of your choice or choose no authentication and fill out other necessary configuration according to your requirements. Click Next to move to Step 3.
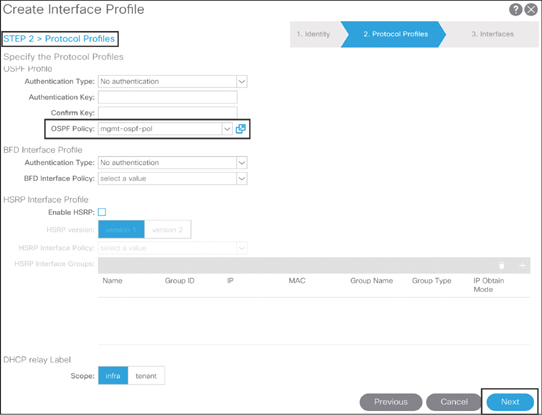
Figure 10-18 Creating an INB Management L3Out Logical Interface Profile: Step 2
In the Step 3 dialog (see Figure 10-19), click the + sign to create a routed interface. Select the Port as the path type. From the Node drop-down menu, select node 201. Select eth1/9 as the interface path. Type 20.20.20.1/29 as the IPv4 address. Click OK and then click Finish. The node ID, interface path, and IPv4 address are sample values taken as an example. You should insert the values based on your environment.

Figure 10-19 Creating an INB Management L3Out Logical Interface Profile: Step 3
Creating External Management EPGs
To create networks under INB management L3Out, navigate to Networking > External Routed Networks > l3out:p-inband-mgmt, right-click Networks, and click Create External Network. In the dialog that appears, type inband-mgmt-epg as the object name and click the + sign to create the subnet that you will allow to access your ACI infrastructure via INB management (see Figure 10-20).
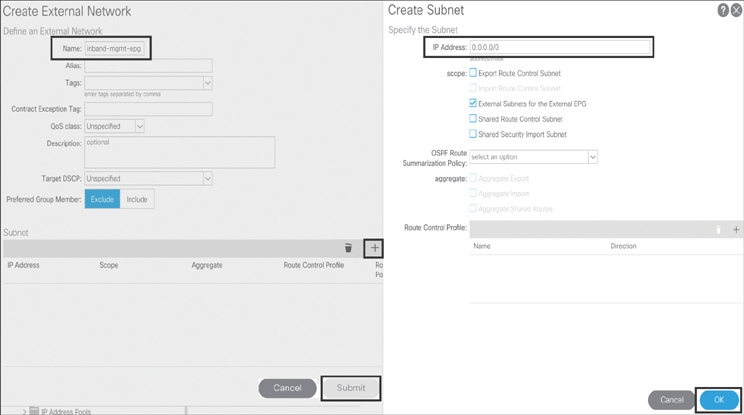
Figure 10-20 Creating INB Management Networks (External Management EPG)
Next, select the newly created INB management L3Out networks and select the Contracts tab. Navigate to Consumed Contracts, as shown in Figure 10-21, and click the + sign to add the inb-cnt contract as a consumed contract. Click Update.

Figure 10-21 Consuming an INB Contract in INB L3Out Networks
Creating an INB BD with a Subnet
In ACI, the INB management BD object is already predefined in the policy. You just need to create a subnet under the inb INB management BD because the spine does not reply to ARP requests for the node’s INB management IP address. To do this configuration, you need to go to Tenants > mgmt > Networking > Bridge Domains > inb. On the right-hand side of the window, click Policy and then click the L3 Configurations tab, as shown in Figure 10-22.

Figure 10-22 Navigating the INB Management Bridge Domain Object
To create a subnet, click the + sign and type 20.20.20.1/24 as the gateway IP address, select Advertised Externally, and click Submit (see Figure 10-23). The subnet gateway IP address shown here is an example. You should insert the values based on your environment.
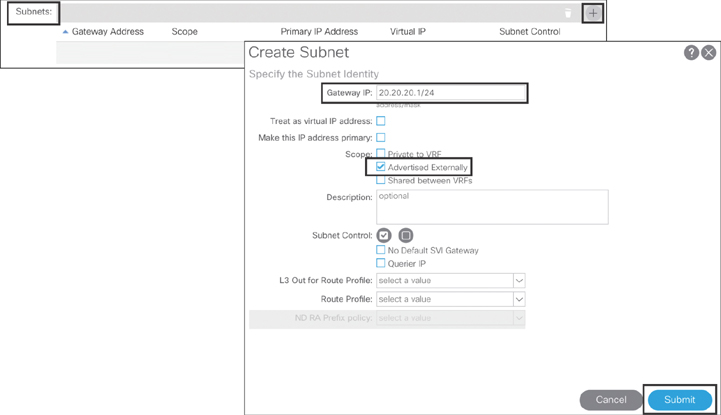
Figure 10-23 Creating an INB Management BD Subnet
Next, to associate this subnet to INB management L3Out, click on the + sign, select the l3out:p-inband-mgmt INB management L3Out, and click Update (see Figure 10-24). Finally, click Submit to finish creating the INB management BD subnet.

Figure 10-24 Associating an INB Management BD Subnet to L3Out
Configuring the Node Management EPG
To configure the INB node management EPG, as shown in Figure 10-25, navigate to Tenants > mgmt > Node Management EPGs > select In-Band EPG. In the dialog that appears, type vlan-5 in the Encap field and select inb from the Bridge Domain drop-down menu. Click Submit. Next, you need to add the INB management contract in the INB node management EPG, so select the In-Band EPG - default object again and, on the right side of the screen, click the + sign and add the inb-cnt INB management contract as a provided contract. The values used here are shown as an example. You should insert the values based on your environment.
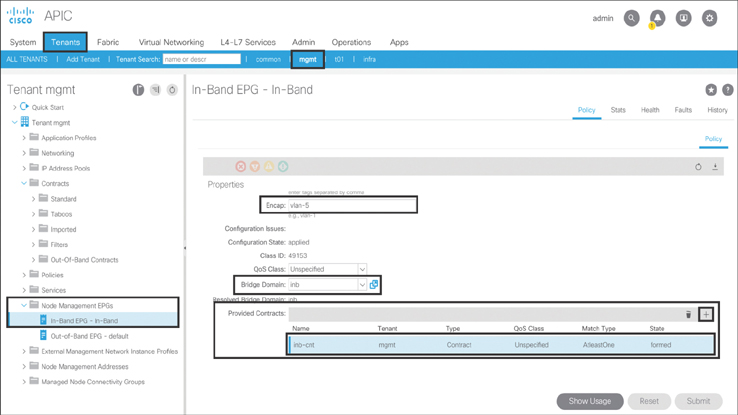
Figure 10-25 Configuring the INB Node Management EPG
Creating Static Management Addresses
To create a static INB management address, in the APIC GUI, go to Tenants > mgmt > Node Management Addresses, right-click Static Node Management Addresses, and click Create Static Node Management Addresses. In the dialog that appears, you need to fill out the ACI node (APIC, leaf, and spine) static management addresses individually, as shown in Figure 10-26.

Figure 10-26 Creating INB Static Node Management Addresses
You should now be able to use the INB management network for managing and monitoring the ACI fabric.
Verifying the INB Management Configuration
To verify the INB management configuration, you can check various configuration items, but the main objective is to check the INB management functionality. To do this, you can establish an SSH session to one of your ACI nodes by using its INB management IP address, as shown in Example 10-3.
Example 10-3 Connecting to an APIC by Using SSH
Sadiq-laptop$ ssh [email protected]
Application Policy Infrastructure Controller
[email protected]'s password:
Last login: 2019-11-05T23:31:19.000-05:00 UTC
apic1#
apic1#
Example 10-4 shows the commands you can run on the APIC to check the INB configuration.
Example 10-4 Verifying the INB Configuration
apic1# show tenant mgmt contract inb-cnt
 Tenant Contract Type     Qos Class   Scope Subject  Access-group  Dir   Description
 ------ -------- -------- ----------- ----- -------  ------------  ----  ----------
 mgmt    inb-cnt   permit   unspecified  vrf


apic1# show tenant mgmt access-list mgmt-fil
Tenant      : mgmt
Access-List : mgmt-fil
    match icmp
    match tcp dest 22
    match tcp src 22
    match tcp src 443
    match tcp dest 443
    match udp src 123 dest 123
    match udp dest 161-162
    match udp dest 514
    match udp dest 53
    match udp src 53
        match tcp dest 49

apic1# show running-config tenant mgmt inband-mgmt
# Command: show running-config tenant mgmt inband-mgmt
# Time: Mon Nov 25 08:14:18 2019
  tenant mgmt
    inband-mgmt epg In-Band
      contract provider inb-cnt
      bridge-domain inb
      vlan 5
      exit
    exit

apic1# show running-config tenant mgmt external-l3 epg inband-mgmt-epg
# Command: show running-config tenant mgmt external-l3 epg inband-mgmt-epg
# Time: Mon Nov 25 08:29:05 2019
  tenant mgmt
    external-l3 epg inband-mgmt-epg l3out l3out:p-inband-mgmt
      vrf member inb
      match ip 0.0.0.0/0
      contract consumer inb-cnt
      exit
    exit

apic1# show running-config tenant mgmt l3out
# Command: show running-config tenant mgmt l3out
# Time: Mon Nov 25 08:32:37 2019
  tenant mgmt
    l3out l3out:p-inband-mgmt
      vrf member inb
      exit
    exit

apic1# show inband-mgmt switch 1001

Table1 : INB-Mgmt Node Details

 Type       Node ID  Ip Address        Gateway       INB-EPG  Oper State
 ---------  -------  ----------------  ------------  -------  ----------
 Leaf-1001  1001     20.20.20.11/24    20.20.20.254  default  up

Table2 : INB-Mgmt EPG Details

 Name             Qos              Tag         Nodes     Vlan      Oper State
 -------          -----------      -----       ------    ----      ----------
 default          unspecified      49153       101       vlan-5    up
 default          unspecified      49153       102       vlan-5    up
 default          unspecified      49153       201       vlan-5    up
 default          unspecified      49153       202       vlan-5    up
 default          unspecified      49153       1001      vlan-5    up
 default          unspecified      49153       1002      vlan-5    up

Table3 : INB-Mgmt EPG Contract Details

 INB-MGMT-Epg     Contracts   App EPG    L3 External EPG    Oper State
 ------------     ---------  --------    ---------------    ----------
 default          inb-cnt                inband-mgmt-epg    up
Caution
If you have configured both OOB and INB management in ACI, INB management is preferred for packets sourced from the APIC by default. Therefore, ensure that you select OOB as your preferred method of management if that is what you selected in all ACI management-related configurations, such as for SNMP, syslog, NTP, TACACS+, and VMM. In order to do that, make the selections shown in Figure 10-27.

Figure 10-27 Selecting OOB as the Preferred Management Method
To verify this configuration, log in to the APIC via the CLI and run the command shown in Example 10-5.
Example 10-5 Verifying OOB as the Preferred Management Method for an APIC
apic1# bash
admin@apic1:~>
admin@apic1:~> ip route show 0.0.0.0/0
default via 10.10.10.1 dev oobmgmt  metric 16
default via 20.20.20.1 dev bond0.5  metric 32
From this output, you can see that the OOB management gateway is selected as the preferred next-hop route for all management traffic, with a metric of 16 followed; INB management is preferred next, with a higher metric of 32.
AAA
Authentication, authorization, and accounting (AAA) in ACI supports TACACS+, RADIUS, and LDAP protocols. However, because TACACS+ is the industry standard for network device control, this section covers only the TACACS+ protocol with respect to AAA configuration.
Configuring Cisco Secure ACS
Before configuring AAA in ACI, you need to first make the necessary configuration on Cisco Secure Access Control System (ACS) to provide the appropriate secure access control to the ACI fabric infrastructure. The high-level configuration steps on ACS server are as follows:
Configure network device group location and type.
Configure network devices and AAA clients.
Create identity group.
Configure read-only and read-write access users on ACS server.
Create shell profile with AV pair.
Configure device administration authorization policy.
Let’s follow these high-level steps into more detail configuration steps as illustrated below.
Note
Only specific web browsers and versions work well with the Cisco ACS GUI. This section uses Mozilla Firefox version 63.0.1.
Step 1. First, you need to create the Network Device Group Location and Device Types to group all of your ACI fabric infrastructure, which will be acting as TACACS+ clients. To configure the network device group location, navigate to the following ACS web GUI path as Network Resources > Network Device Groups > Location and click Create. Type the name of the location (in this case, NGLAB) and click Submit. Figure 10-28 illustrates this process.
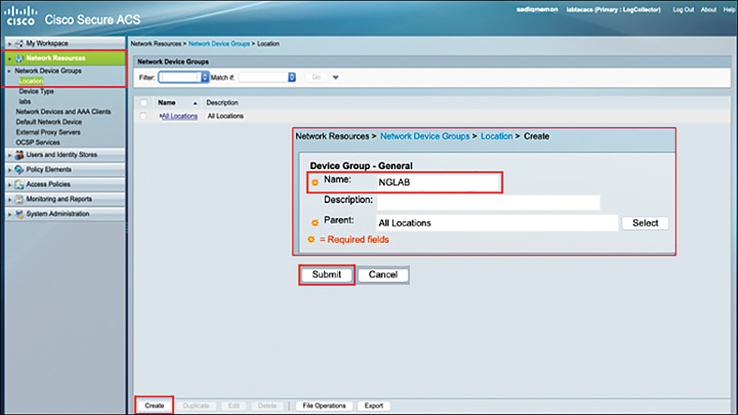
Figure 10-28 Creating Network Device Groups Location in Cisco Secure ACS
Step 2. For network device type configuration, navigate to Network Resources > Network Device Groups > Device Type and click Create. Type the name of the device type (in this case ACI Fabric) and click Submit. Figure 10-29 illustrates this process.
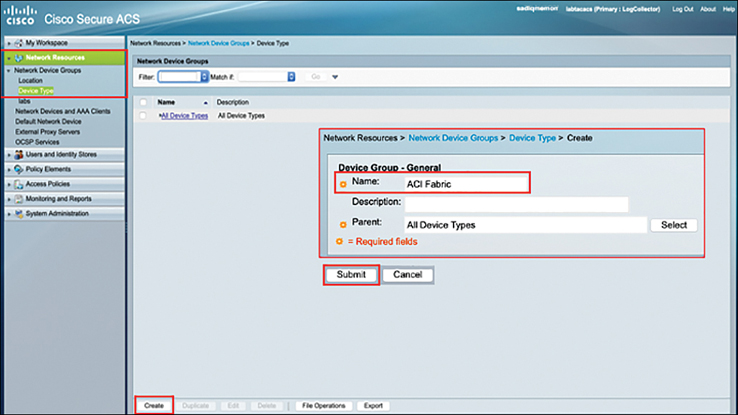
Figure 10-29 Creating Network Device Type in Cisco Secure ACS
Step 3. Configure the ACI fabric infrastructure devices (APICs, leafs, and spines) on the Cisco Secure ACS server. Navigate to Network Resources > Network Device Groups > Network Devices and AAA Clients and click Create. Figure 10-30 illustrates this process.
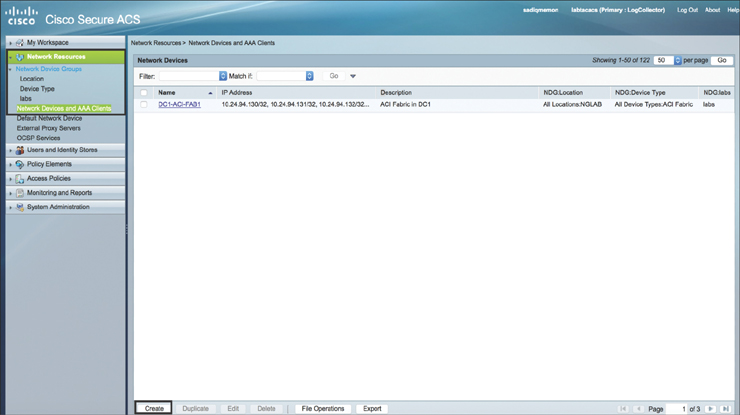
Figure 10-30 Creating Network Devices in Cisco Secure ACS
Step 4. As shown in Figure 10-31, enter DC1-ACI-FAB1 as the client name and enter the description ACI Fabric in DC1. For the already created Location and Device Type, click Select. Choose the IP Range(s) radio button and type the Management IP addresses of all ACI fabric devices in the Add tab. (Note that management IP addresses can be either OOB or INB, depending on the management EPG you use while configuring TACACS+ in ACI, as discussed later in this chapter.) Expand TACACS+ under Authentication Options and type in cisco123 as the shared secret key. This is the same shared secret key that you will use later in this chapter, when you configure TACACS+ in ACI. Click Submit. All the input values are shown as an example. You can use your own values based on your environment.
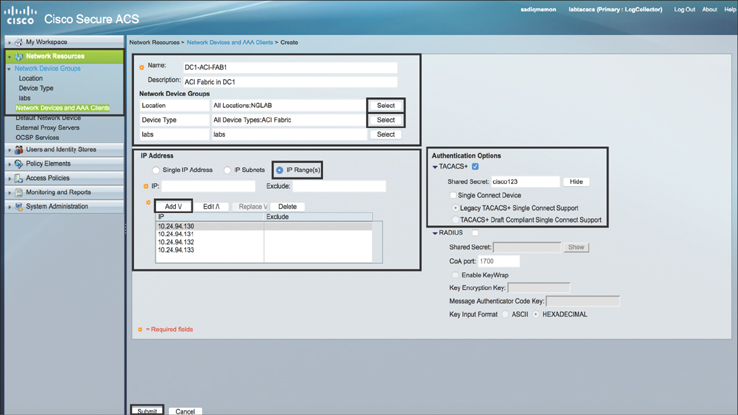
Figure 10-31 Configuring the Network Device Group in Cisco Secure ACS
Step 5. Now you need to configure Cisco Secure ACS users and identity groups. Navigate to Users and Identity Stores > Identity Groups and click Create. Specify the name of an identity group and click Submit. Create at least the identity groups ACI-Admins and ACI-Read-Only for this example. Figure 10-32 shows the configuration for ACI-Admins.

Figure 10-32 Creating Identity Groups in Cisco Secure ACS
Step 6. Configure external users that will be used to access the ACI fabric infrastructure; these can be internal Cisco ACS users or external users, such as from Microsoft Active Directory. To do so, navigate to Users and Identity Stores > Internal Identity Stores > Users. Create admin user aci-rw as an example here, map this user to the identity group ACI-Admins created in the previous step, and configure a password. Similarly, create another user called aci-ro as an example with read-only privileges, map this user to the identity group ACI-Read-Only created in the previous step, and configure a password. Click Submit. Figure 10-33 illustrates the configuration steps for user aci-rw.

Figure 10-33 Creating Users with Passwords and Mapping Them to Identity Groups
Note
Cisco Secure ACS can be integrated to external Identity Store such as LDAP; in that case, local users are not required to be created.
Step 7. Create the policy elements. This is where you define the Cisco AV pair to specify the APIC required role-based access control (RBAC) roles and privileges for different users.
You configure the AV pair in the following format:
shell:domains = domainA/writeRole1|writeRole2|writeRole3/
readRole1|readRole2,

domainB/writeRole1|writeRole2|writeRole3/readRole1|readRole2
The following are some examples of the AV pair strings for different types of user access:
Users with admin access to the entire fabric:
shell:domains = all/admin
Users with read-only access to the entire fabric:
shell:domains = all//admin
Users with admin access to tenants under the security domain cisco and read-only access to the rest of the tenants:
shell:domains = cisco/admin/,all//admin
Note
Starting with ACI Release 3.1(x), the AV pair shell:domains=all//admin allows you to assign read-only privileges to users and provide them access to the switches via the CLI.
Step 8. Navigate to Policy Elements > Authorization and Permissions > Device Administration > Shell Profiles and click Create. Name the new shell profile aci-rw, as shown in Figure 10-34.

Figure 10-34 Creating a Shell Profile
Step 9. Navigate to the Custom Attributes tab, add the AV pair string, and click Submit. Figure 10-35 illustrates this process. You can use the same procedure to create another shell profile for read-only access using AV pair shell:domains=all//admin in the Custom Attributes tab.
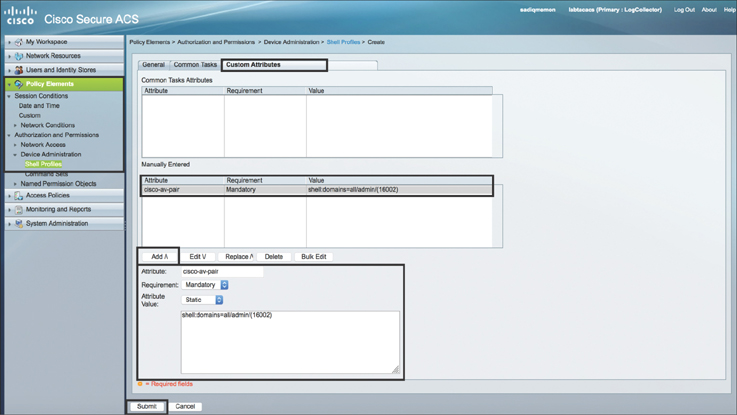
Figure 10-35 Adding an AV Pair String in the Custom Attributes Tab
Step 10. Finally, you need to configure the access policies and tie it all together by mapping the user to the shell profile to the AAA clients. First create the access services by navigating to Access Policies > Access Services and click Create. In Step 1 – General, type the name (in this case ACI Access). Choose Device Administration as User Selected Service Type and select Identity and Authorization from the list. Click Next. In Step 2 – Allowed Protocols, elect the necessary protocols of your choice and click Finish. This process is illustrated in Figure 10-36.
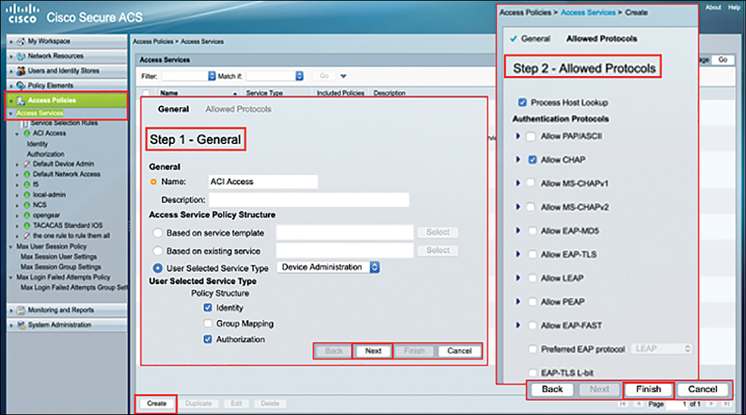
Figure 10-36 Creating Access Services in Cisco ACS
Step 11. In this step, you need to configure the Service Selection Rules. For that, navigate to Access Policies > Service Selection Rules and click Create. Type the name (in this case ACI). Select Protocol and match it to TACACS. Choose ACI Fabric as the NDG Device Type and select ACI Access as Service. Click OK and then click Save Changes. This process is illustrated in Figure 10-37.
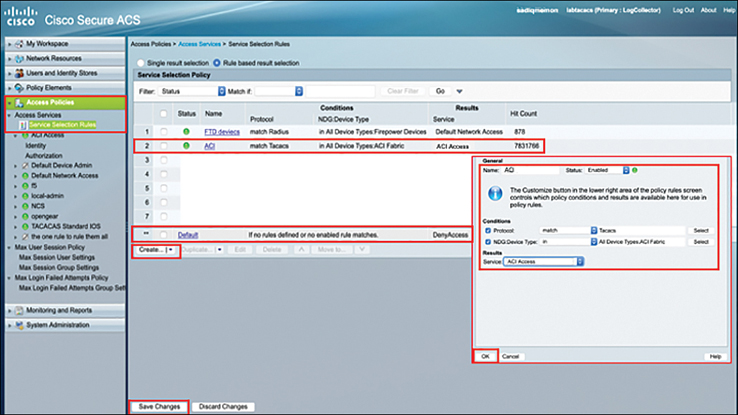
Figure 10-37 Creating Service Selection Rules in Cisco ACS
Step 12. In this step, you need to configure Identity under the access service you created in Step 10, such as ACI Access. Select Internal Users as the Identity source and click Save Changes. This process is illustrated in Figure 10-38.

Figure 10-38 Configure Identity in Cisco ACS
Step 13. In the final step, you need to configure the device administration authorization policy. Navigate to Access Policies > ACI Access > Authorization. Create a new rule that maps the identity group, device type, location, and shell profile, as shown in Figure 10-39. Click OK and Save Changes.

Figure 10-39 Creating an Access Policy and Authorization
Configuring Cisco ISE
Aside from Cisco Secure ACS, you can also configure Cisco Identity Service Engine (ISE) as an external access control system for the ACI fabric infrastructure. Following are the high-level configuration steps on ISE:
Configure network device group location and type.
Configure network devices.
Create identity group and configure identities in ISE.
Create TACACS profile with AV pair.
Configure TACACS admin policy set.
More detailed configuration steps are illustrated below.
Note
These configuration steps are for ISE version 2.x.
Step 1. You first need to create the Network Device Groups Location and Device Types to group all your ACI fabric infrastructure acting as TACACS+ clients. To configure the network device groups location, navigate to Administration > Network Resources > Network Device Groups > Groups > All Locations and click Add. Type the name of the location (in this case, NGLAB) and click Submit. For Network Device type configuration, browse through Administration > Network Resources > Network Device Groups > Groups > All Device Types and click Add. Type the name of the device type (in this case, ACI Fabric) and click Submit. Figure 10-40 illustrates the process.
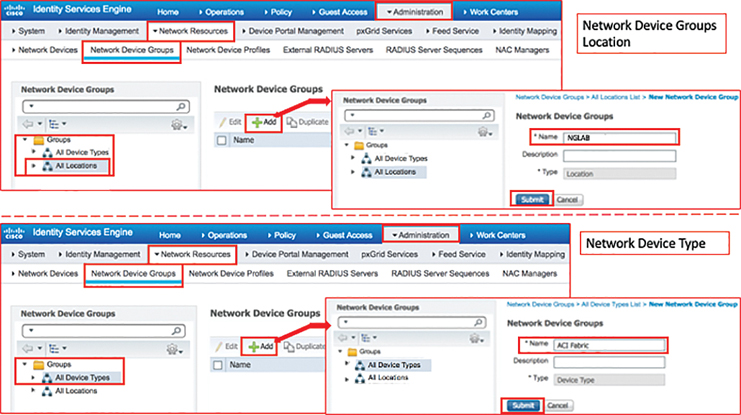
Figure 10-40 Configuring Network Device Groups Location and Device Type in ISE
Step 2. Create your Network Devices where you will define ACI infrastructure for access control through TACACS+. To do this task, navigate to the following ISE web GUI path as Administration > Network Resources > Network Devices and click Add. From here, you can go ahead and assign a name to your Network Device, assign the Location and Device Type, enable TACACS+ authentication using the same Shared Secret as what you will assign in ACI AAA configuration, and assign the IP addresses of the APICs and fabric switches. In this example, the IP address of APIC1, which is 10.24.94.130, is demonstrated in Figure 10-41.

Figure 10-41 Configuring Network Device in ISE
Step 3. In this step, you will create an Identity Group to organize local users (called Identities in ISE). To create the Identity Group, navigate to Work Centers > Device Administration > User Identity Groups > User Identity Group and click Add. Type the name of the Identity Group. You can create at the minimum two groups—namely, ACI Admin and ACI Read-only groups are created. Now, create a local user such as aci-rw and assign it to the ACI Admin group. Similarly, for read-only access you can create another local user as aci-ro and assign it to the ACI Read-only group. For learning purposes, only aci-rw account is shown in Figure 10-42.

Figure 10-42 Configuring Identity Group and Identities in ISE
Note
Cisco ISE can be integrated to an external Identity Store such as LDAP; in that case, local users are not required to be created.
Step 4. Now create the TACACS Profiles containing the AV pair. The AV pair syntax for the ACI infrastructure is explained in detail in the earlier section “Configuring Cisco Secure ACS.” To configure TACACS Profiles, navigate to the following ISE web GUI path as Work Centers > Device Administration > Policy Results > TACACS Profiles, and click Add. Type the name (in this case, Read-Write) and configure custom attributes as shown in Figure 10-43. You can follow this procedure to create another TACACS Profile for Read-Only access.

Figure 10-43 Configuring TACACS Profiles with Custom Attributes in ISE
Step 5. You now need to create a Device Admin Policy Set to gel together all the ISE policies. To create the Device Admin Policy Set, navigate to Work Centers > Device Administration > Device Admin Policy Sets and click the + sign to create a policy above the existing Default policy. Type the name of the policy set and click Create New Condition to set up access control conditions based on the policies shown in Figure 10-44.

Figure 10-44 Configuring Device Admin Policy Set with New Condition in ISE
Step 6. The next step in creating the device admin policy set is to define the Authentication Policy. You can select the Default Rule and apply the Allowed Protocols and Identity Source configurations. From the Allowed Protocols list, click Create a new Allowed Protocol, type the name, and choose the authentication protocol of your choice, as shown in Figure 10-45. This should match with ACI AAA configuration authentication protocol selection.

Figure 10-45 Configuring Authentication Policy for Device Admin Policy Set
Step 7. Finally, in creating a device admin policy set, you now need to define the Authorization Policy. For that you will need to create a new rule, which you should place above the Default rule. Specify the Name, Identity Group, and Shell Profile. For example, since you have already created two Identity Groups, namely ACI Admin and ACI Read-Only, you should assign the correct Shell Profiles to each group, such as Read-Write and Read-Only. This process is illustrated in Figure 10-46.
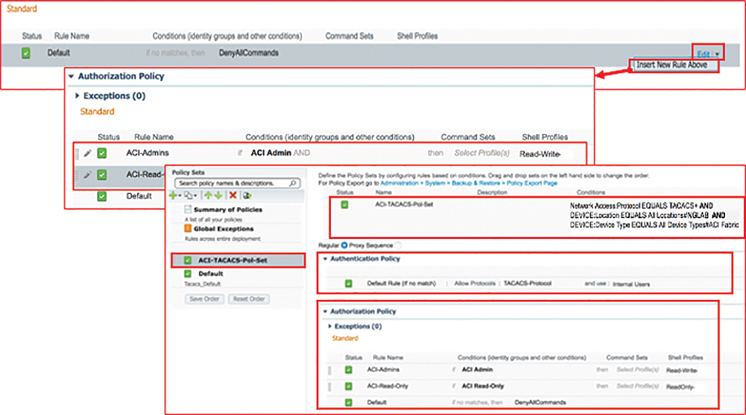
Figure 10-46 Configuring Authorization Policy for Device Admin Policy Set
In Figure 10-46, you can see that ACI-TACACS-Pol-Set is created with Default Authentication Policy Rule using TACACS-Protocol and Internal Users as external Identity Store along with Authorization Policy rules, ACI-Admins and ACI-Read-Only with respective shell profiles.
Configuring AAA in ACI
Now that you have finished configuring a portion of the Cisco Secure ACS or Cisco ISE to provide secure access control to the ACI fabric infrastructure, it’s time to start configuring AAA in ACI. To configure AAA in ACI, you need to perform the following steps:
Step 1. Navigate to Admin > AAA > TACACS+ Management and right-click TACACS+ Providers. Specify the ACS server hostname (and ensure that DNS is set up in your fabric if you are using hostname) or IP address, the port (the default is TCP port 49), the authorization protocol (in this case CHAP, and it should match in the ACS/ISE configuration), the shared secret key (which should match the shared secret key configured on the ACS server shown earlier in this section), and the management EPG (INB or OOB). Figure 10-47 illustrates this process.

Figure 10-47 Creating a TACACS+ Provider
Step 2. To create the TACACS+ provider group and map to the TACACS+ provider created in the previous step, navigate to Admin > AAA > the TACACS+ Management and right-click TACACS+ Provider Groups. Specify the name of the TACACS+ provider group and associate it with a previously created TACACS+ provider, as shown in Figure 10-48.
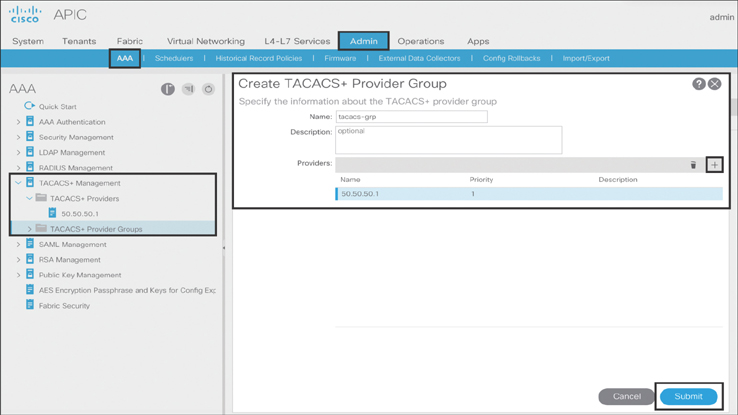
Figure 10-48 Creating a TACACS+ Provider Group
Step 3. To create the login domain and map to the TACACS+ provider group, navigate to Admin > AAA > AAA Authentication and right-click Login Domains. Specify the name of the login domain, select TACACS+ for the realm, and associate a previously created TACACS+ provider group, as shown in Figure 10-49.
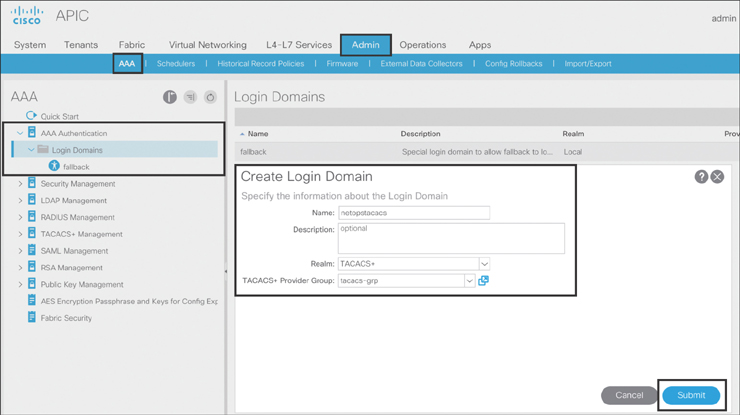
Figure 10-49 Creating a Login Domain
Note
A fallback login domain is already created by default. This is the local domain for allowing local authentication in case you are locked out of your fabric if the default authentication settings are changed or misconfigured somehow.
Step 4. To change the default authentication method to TACACS+, click AAA Authentication in the navigation pane, select TACACS+ as the realm, and select the TACACS+ provider group, as shown in Figure 10-50.
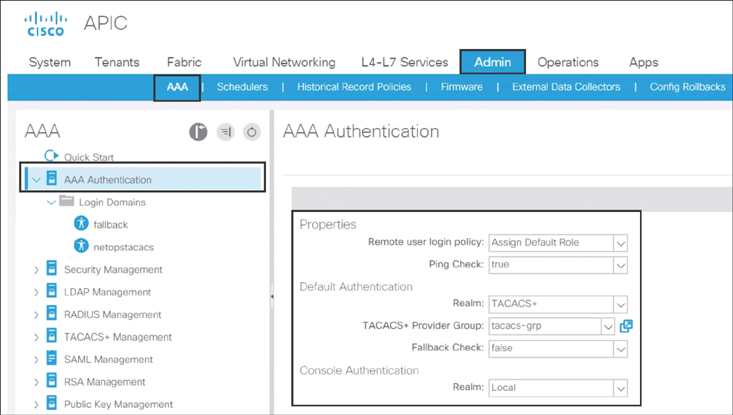
Figure 10-50 Changing the Default Authentication Method to TACACS+
Note
Make sure Fallback Check is set to false under Default Authentication; otherwise, you will not be able to recover with local login credentials.
Recovering with the Local Fallback User
In the event that connectivity to the TACACS+ server is lost and you are locked out of your fabric, you can use the local admin fallback user. To log in to ACI fabric as a local fallback user, you can use either of the following:
From the GUI: Use apic:fallback\admin.
From CLI: Use ssh apic#fallback\admin.
Verifying the AAA Configuration
You need to do a couple of checks to make sure your AAA configuration is correct. Follow these steps:
Step 1. Make sure you can ping the TACACS+ server from both the APIC and the fabric nodes. Success with these pings can rule out any network issues.
Step 2. Check to see if the configuration has been correctly pushed to the APICs and fabric nodes, as shown in Example 10-6.
Step 3. Check the Nginx logs and search for the TACACS+ provider IP address to confirm reachability (see Example 10-7). These logs can sometimes give you clues about why TACACS connectivity is not working.
Example 10-6 Verifying AAA Configuration
apic1# show tacacs-server
timeout : 5
retries : 1

Total number of servers: 1

Hostname : 50.50.50.1
Port : 49
Protocol : chap
Timeout : 10
Retries : 1

Leaf101# show tacacs-server groups
total number of groups:1
following TACACS+ server groups are configured:
        group tacacs-grp:
                server: 50.50.50.1 on port 49
                deadtime is 0

Leaf101# show aaa authentication
         default: group tacacs-grp
         console: local
Example 10-7 Verifying TACACS+ Server Reachability Through Nginx Logs
leaf101# grep 50.50.50.1 /var/log/dme/log/nginx.log | less
34703||19-11-10 10:40:33.239+08:00||aaa||DBG4||||Received response from 50.50.50.1 -
  notifying callback handler (IPv4)||../dme/svc/extXMLApi/src/gen/ifc/app/./ping/
  lib_ifc_ping.cc||757
34703||19-11-10 11:29:23.239+08:00||aaa||DBG4||||Received update on status of
  50.50.50.1 (DN uni/userext/tacacsext/tacacsplusprovider-50.50.50.1) - status is
   ALIVE||../dme/svc/extXMLApi/src/gen/ifc/app/./pam/PamWorker.cc||1448
Syslog
As explained in detail in Chapter 9, syslog is a network monitoring protocol that has been used in the industry for quite some time. It runs on UDP port 514. During failures, ACI generates faults and events that get stored as system logs on an APIC or that can be sent out to a centralized syslog server, preferably connected outside the ACI fabric. Besides faults and events, an APIC can also send audit and session logs to an external syslog server.
In order to configure syslog in ACI, you need to follow these steps:
Step 1. Create an external data collector as a syslog destination.
Step 2. Create a syslog source at the access level, fabric level, or tenant level and associate the syslog source with a destination.
To create a syslog external data collector, from the APIC GUI, you need to go to Admin > External Data Collectors > Monitoring Destinations, right-click Syslog, and select Create Syslog Monitoring Destination Group, as shown in Figure 10-51.

Figure 10-51 Creating Syslog External Data Collectors
You now need to follow this configuration process (see Figure 10-52). The input values are shown as an example.
Step 1. Complete the profile:
Type syslog-grp as the object name.
Type a description, if needed.
Choose the syslog format to ACI.
Set Admin State to enabled.
Under Local File Destination, set Admin State to enabled and Severity to information.
Under Console Destination, set Admin State to enabled and Severity to alerts.
Click Next.
Step 2. Specify the remote destinations:
Click the + sign to add a remote destination.
Type 30.30.30.1 as the IP address of the external syslog server.
Set Admin State to enabled.
Set Severity to information.
Set Port to 514.
Set Forwarding Facility to local7.
Set Management EPG to default (Out-of-Band).
Click OK and click Finish.

Figure 10-52 Creating Syslog Monitoring Destination Servers
After creating the syslog monitoring destination servers, you need to create the syslog sources. You can create syslog sources at three levels:
Access level
Fabric level
Tenant level
Next we look at the syslog source configuration steps for each of these levels.
To create the syslog source policy at the access level, you need to go to Fabric > Access Policies > Policies > Monitoring > default > Callhome/Smart Callhome/SNMP/Syslog. On the right side of the screen, select Syslog and click the + sign. Enter syslog-src as the object name and include the logs shown in Figure 10-53. For Min Severity, select information. Associate syslog-src with syslog-grp.
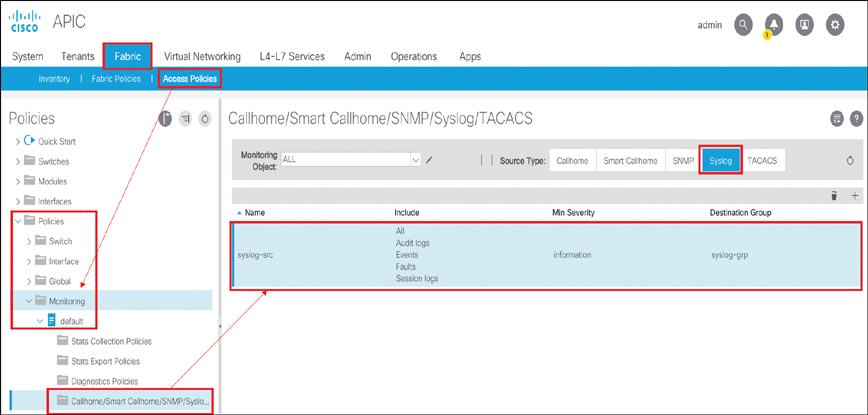
Figure 10-53 Creating a Syslog Source at the Access Level
To create a syslog source policy at the fabric level, you need to go to Fabric > Fabric Policies > Policies/Monitoring > default > Callhome/Smart Callhome/SNMP/Syslog. On the right side of the screen, select Syslog and click the + sign. Enter syslog-src as the object name and include the logs shown in Figure 10-54. For Min Severity, select information. Associate syslog-src with syslog-grp.
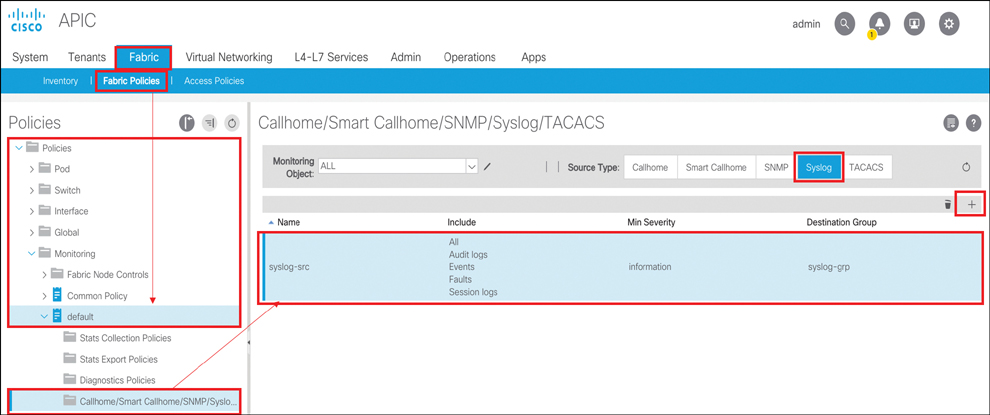
Figure 10-54 Creating a Syslog Source at the Fabric Level
To create a syslog source policy at the tenant level, you need to go to Tenants > t01 > Policies > Monitoring > default > Callhome/Smart Callhome/SNMP/Syslog. On the right side of the screen, select Syslog and click the + sign. Enter syslog-src as the object name and include the logs shown in Figure 10-55. For Min Severity, select information. Associate syslog-src with syslog-grp.

Figure 10-55 Creating a Syslog Source at the Tenant Level
ACI is a whitelist model in which traffic can only be forwarded when allowed by contracts. Management traffic can use either the OOB or the INB method to flow. Syslog traffic using OOB management does not require an explicit OOB contract on the APIC with UDP port 514. However, it is still a good practice to create a specific filter with UDP port 514 for syslog and add it to the filter list in your OOB contract subject configuration.
Syslog traffic using INB management requires an explicit INB contract on the APIC with UDP port 514. If this contract is not created, the syslog packets will be dropped by the border leaf, and the INB management L3Out will be used for management traffic.
Verifying the Syslog Configuration and Functionality
There are different ways to verify syslog configuration and functionality. The following examples show verification steps that should suffice for normal operation of your syslog configuration in ACI.
You can check the syslog configuration on the APIC as shown in Example 10-8.
Example 10-8 Verifying Syslog Configuration on an APIC
apic1# show running-config logging
# Command: show running-config logging
# Time: Sat Nov 16 17:59:14 2019
  logging server-group syslog-grp
    console
    server 100.100.100.1 severity warnings facility local7 mgmtepg oob port 514
    exit
Next, you can run the packet capture utility tcpdump on a leaf and capture only syslog traffic while shutting down a port (eth1/9 in this example on Leaf-201, which is part of an L3Out with OSPF peering to the external router) on the leaf via the APIC. You should see syslog generated by the leaf as soon as you shut down the port, as shown in Example 10-9.
Example 10-9 Verifying Syslog Functionality Through tcpdump Utility on a Leaf
Leaf-201# tcpdump -i eth0 -f port 514 -v
tcpdump: listening on eth0, link-type EN10MB (Ethernet), capture size 65535 bytes
19:16:56.022699 IP (tos 0x0, ttl 64, id 40817, offset 0, flags [none], proto UDP
(17), length 274)
Leaf-201.cisco.com.46672 > 100.100.100.1.syslog: SYSLOG, length: 246
Facility local7 (23), Severity warning (4)
Msg: Nov 16 19:16:56 Leaf-201 %LOG_LOCAL7-4-SYSTEM_MSG [F1385][deleted]
[protocol-ospf-adjacency-down][warning][sys/ospf/inst-default/dom-mgmt:inb/if-
[eth1/9]/adj-50.50.50.1/fault-F1385] OSPF adjacency is not full, current state Exchange�x0a
^C
1 packets captured
1 packets received by filter
0 packets dropped by kernel
Note
In Example 10-9, the tcpdump utility is used with the interface filter -i knob and eth0, which represents the OOB management that you have used in your configuration to send all management traffic. If you want to use INB management to send out all management traffic, you use the interface filter kpm_inb with the tcpdump utility.
SNMP
Like syslog, SNMP is a network monitoring protocol that has been in the industry for quite some time. It uses UDP port 162 for sending out traps and UDP port 161 for read queries (walk, get, next, bulk) from a managed station. In Cisco ACI, much as in legacy networks, SNMP trap configuration is different from SNMP read query configuration. Therefore, you need to ensure that both are configured properly.
In order to configure SNMP trap configuration in ACI, you need to perform the following steps:
Step 1. Create an external data collector as the SNMP trap destination.
Step 2. Create an SNMP source at the access level, fabric level, or tenant level and associate the SNMP source with an SNMP trap destination.
To create an SNMP external data collector, you need to go to Admin > External Data Collectors > Monitoring Destinations, right-click SNMP, and select Create SNMP Monitoring Destination Group (see Figure 10-56).

Figure 10-56 Creating an SNMP External Data Collector
As shown in Figure 10-57, you now need to follow this configuration process. The input values are shown as an example.
Step 1. Complete the profile:
Type snmp-trpgrp as the object name.
Type a description, if needed.
Click Next.
Step 2. Specify the remote destinations:
Click the + sign to add an SNMP trap destination.
Type 10.10.10.1 as the IP address of the external SNMP management station receiving traps.
Set Port to 162.
Set Version to v2c.
Set Community Name to auto-snmp.
Set Management EPG to default (Out-of-Band).
Click OK and click Finish.

Figure 10-57 Creating an SNMP Monitoring Destination
After you create the SNMP monitoring destination servers, you need to create the SNMP trap sources. You can create SNMP trap sources at three levels:
Access level
Fabric level
Tenant level
Next, we look at the SNMP trap configuration steps for each of these levels.
As shown in Figure 10-58, to create the SNMP trap source policy at the access level, you need to go to Fabric > Access Policies > Policies > Monitoring > default > Callhome/Smart Callhome/SNMP/Syslog. On the right side of the screen, select SNMP and click the + sign. Enter snmp-src as the object name. Associate snmp-src with snmp-trpgrp.
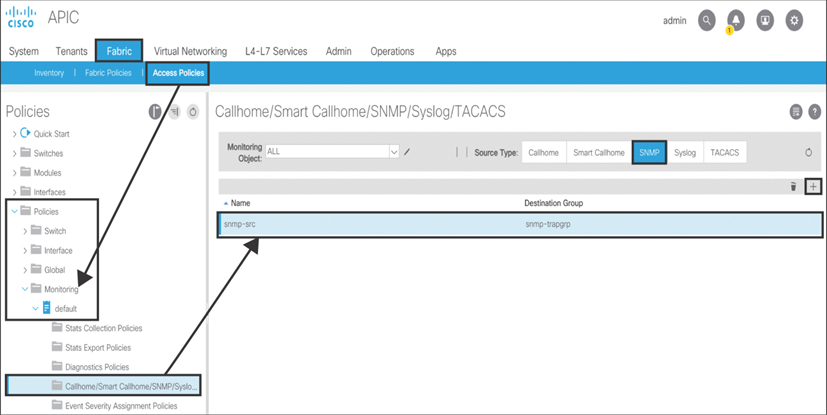
Figure 10-58 Creating an SNMP Trap Source at the Access Level
As shown in Figure 10-59, to create the SNMP trap source policy at the fabric level, you need to go to Fabric > Fabric Policies > Policies > Monitoring > default > Callhome/Smart Callhome/SNMP/Syslog. On the right side of the screen, select SNMP and click the + sign. Enter snmp-src as the object name. Associate snmp-src with snmp-trpgrp.
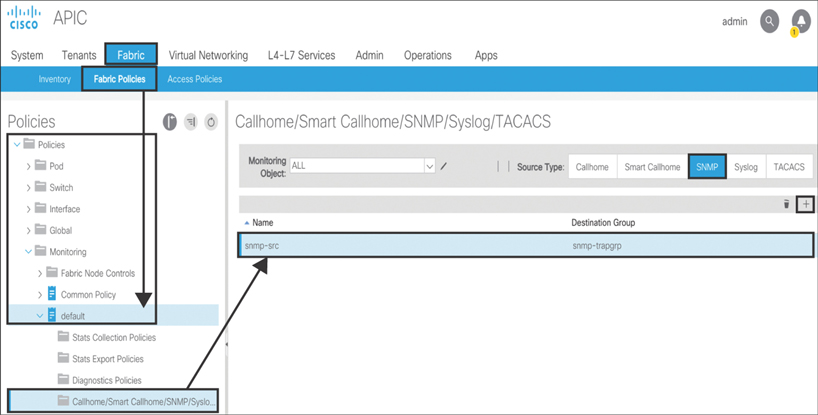
Figure 10-59 Creating an SNMP Trap Source at the Fabric Level
As shown in Figure 10-60, to create the SNMP trap source policy at the tenant level, you need to go to Tenants > t01 > Policies > Monitoring > default > Callhome/Smart Callhome/SNMP/Syslog. On the right side of the screen, select SNMP and click the + sign. Enter snmp-src as the object name. Associate snmp-src with snmp-trpgrp.

Figure 10-60 Creating an SNMP Trap Source at the Tenant Level
To do the SNMP read query configuration in ACI, you need to perform the following steps:
Step 1. Define the SNMP policy.
Step 2. Add an SNMP policy to the pod policy group.
Step 3. Add the pod policy group to the pod profile.
As shown in Figure 10-61, to define the SNMP policy, you need to go to Fabric > Fabric Policies > Policies > Pod, right-click SNMP, and select Create SNMP Policy. On the right side of the screen, enter snmp-policy as the name of the object. Set Admin State to Enabled and enter contact and location information. Click the + sign to add client group policies. Add the IP addresses of the SNMP management stations for which you want to allow SNMP read queries against ACI fabric infrastructure. Finally, click the + sign to add community policies.
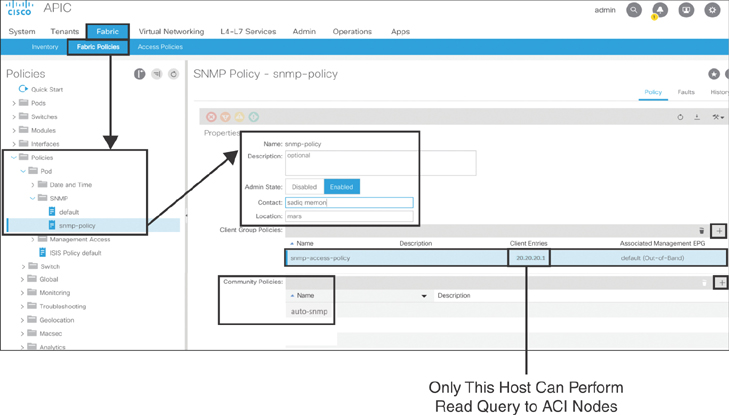
Figure 10-61 Creating an SNMP Policy
After you create the SNMP policy, the next step is to add this policy to the pod policy group. To do that, you need to go to Fabric > Fabric Policies > Pods and right-click Policy Groups to create a group with the name of your choice (in this case, pod-policy). On the right side of the screen, select the SNMP policy you created in the previous step and click Submit (see Figure 10-62).
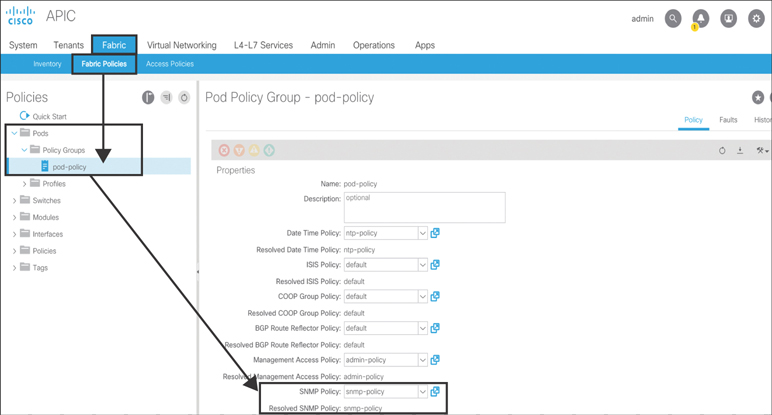
Figure 10-62 Adding an SNMP Policy to the Pod Policy Group
Note
If your policy group is already created, you just need to click on that policy group and select SNMP Policy.
Finally, you need to add the pod policy group to a pod profile, as shown in Figure 10-63.
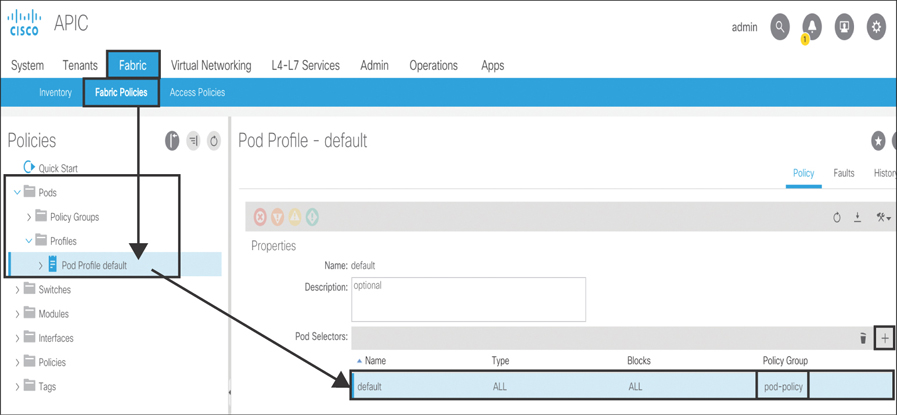
Figure 10-63 Adding a Pod Policy Group to a POD Profile
Note
If you already added the pod policy group in the pod profile earlier, you do not need to execute this step.
ACI is a whitelist model in which traffic can only be forwarded when allowed by contracts. Management traffic can use either the OOB or INB method to flow. SNMP traffic using OOB management does not require an explicit OOB contract on the APIC with UDP ports 161 (read queries) and 162 (traps). However, it is still a good practice to create a specific filter with UDP ports 161/162 for SNMP and add it to the filter list in your OOB contract subject configuration.
SNMP traffic using INB management requires an explicit INB contract on the APIC with UDP ports 161/162. If this contract is not created, the SNMP packets will be dropped by the border leaf, and the INB management L3Out will be used for management traffic.
Verifying the SNMP Configuration and Functionality
There are different ways to verify your SNMP configuration and functionality. The following examples show verification steps that should suffice for normal operation of your SNMP configuration in ACI.
You can check the SNMP configuration on the APIC as shown in Example 10-10.
Example 10-10 Verifying SNMP Configuration on an APIC
apic1# show snmp summary

Active Policy: snmp-policy, Admin State: enabled

Local SNMP engineID: [Hex] 0x800000098040e9b277fa3cec5a00000000

----------------------------------------
Community            Description
----------------------------------------
Public
Private

------------------------------------------------------------
User                 Authentication       Privacy
------------------------------------------------------------

------------------------------------------------------------
Client-Group         Mgmt-Epg                  Clients
------------------------------------------------------------
snmp-access-policy   default (Out-Of-Band)     20.20.20.1

------------------------------------------------------------
Host                 Port  Version  Level      SecName
------------------------------------------------------------
10.10.10.1           162   v2c      noauth     auto-snmp
Next, you need to verify that the configuration is pushed on one of the fabric nodes (APIC, leaf, or spine), as shown in Example 10-11.
Example 10-11 Verifying SNMP Configuration on a Leaf/Spine
Leaf-201# show snmp
sys contact: sadiq memon
sys location: mars

13 SNMP packets input
      0 Bad SNMP versions
      12 Unknown community name
      0 Illegal operation for community name supplied
      0 Encoding errors
      1 Number of requested variables
      0 Number of altered variables
      1 Get-request PDUs
      0 Get-next PDUs
      0 Set-request PDUs
      0 No such name PDU
      0 Bad value PDU
      0 Read Only PDU
      0 General errors
      0 Get Responses
      0 Unknown Context name
125 SNMP packets output
      124 Trap PDU
      0 Too big errors (Maximum packet size 0)
      0 No such name errors
      0 Bad values errors
      0 General errors
      0 Get Requests
      0 Get Next Requests
      0 Set Requests
      1 Get Responses
      0 Silent drops


Community            Group / Access      context    acl_filter
----------           --------------      -------    ----------
auto-snmp            network-admin

______________________________________________________________
               SNMP USERS
______________________________________________________________

User                          Auth  Priv(enforce) Groups
____                          ____  _____________ ______
SNMP protocol : Enabled

--------------------------------------------------------------------
Context                          [Protocol instance, VRF, Topology,]
                                 [vlan, MST]
--------------------------------------------------------------------

-------------------------------------------------------------------------------
Host                                      Port Version  Level  Type   SecName
-------------------------------------------------------------------------------
10.10.10.1                                162  v2c      noauth trap   auto-snmp
Use VRF: management
Now that you have verified the configuration, it’s time to verify the functionality of SNMP traps and read queries. Much as with syslog verification, you can run the packet capture utility tcpdump on a leaf and capture only SNMP trap traffic while shutting down a port (eth1/9 in this example on Leaf-201, which is part of an L3Out with OSPF peering to external router) on the leaf via the APIC. You should see the SNMP trap generated by the leaf as soon as you shut down the port, as shown in Example 10-12.
Note
In Example 10-12, tcpdump -i eth0 sees the SNMP trap only if the trap destination is reachable over the OOB interface.
Example 10-12 Verifying SNMP Trap Functionality Through the tcpdump Utility on a Leaf
Leaf-201# tcpdump -i eth0 -f port 162 -v

tcpdump: listening on eth0, link-type EN10MB (Ethernet), capture size 65535 bytes

23:57:02.565989 IP (tos 0x0, ttl 64, id 35956, offset 0, flags [none], proto UDP
  (17), length 266)
    Leaf-201.cisco.com.46298 > 10.10.10.1.snmp-trap:  { SNMPv2c C=auto-snmp
  { V2Trap(218) R=116  system.sysUpTime.0=55950023 S:1.1.4.1.0=E:cisco.9.276.0.1
  interfaces.ifTable.ifEntry.ifIndex.436240384=436240384
  interfaces.ifTable.ifEntry.ifAdminStatus.436240384=2
  interfaces.ifTable.ifEntry.ifOperStatus.436240384=2 31.1.1.1.1.436240384=eth1/9
  interfaces.ifTable.ifEntry.ifType.436240384=6
  interfaces.ifTable.ifEntry.ifDescr.436240384=eth1/9 31.1.1.1.18.436240384= } }

23:57:02.666355 IP (tos 0x0, ttl 64, id 35980, offset 0, flags [none], proto UDP
  (17), length 194)
  Leaf-201.cisco.com.46298 > 10.10.10.1.snmp-trap:  { SNMPv2c C=auto-snmp
 { V2Trap(146) R=117  system.sysUpTime.0=55950033 S:1.1.4.1.0=S:1.1.5.3
 interfaces.ifTable.ifEntry.ifAdminStatus.436240384=2
 interfaces.ifTable.ifEntry.ifIndex.436240384=436240384
 interfaces.ifTable.ifEntry.ifOperStatus.436240384=2 S:1.1.4.3.0=S:1.1.5.3 } }

23:57:02.766708 IP (tos 0x0, ttl 64, id 35985, offset 0, flags [none], proto UDP
  (17), length 188)
    Leaf-201.cisco.com.46298 > 10.10.10.1.snmp-trap:  { SNMPv2c C=auto-snmp
  { V2Trap(140) R=118  system.sysUpTime.0=55950043 S:1.1.4.1.0=14.16.2.16
  14.1.1.0=29.34.92.236 14.7.1.1.50.50.50.1.0=50.50.50.1 14.7.1.2.50.50.50.1.0=0
  14.7.1.12.50.50.50.1.0=1 } }
^C
3 packets captured
3 packets received by filter
0 packets dropped by kernel
Note
In Example 10-12, the tcpdump utility is used with the interface filter -i knob and eth0, which represents the OOB management that you have used in your configuration to send all management traffic. If you want to use INB management to send out all management traffic, you use the interface filter kpm_inb with the tcpdump utility.
In the packet capture in Example 10-12, you can see that an SNMP trap from Leaf-201 is sent to destination server 10.10.10.1 with community string snmp-auto. The packet capture output shows the ifAdminStatus value as 2, which means Down:
interfaces.ifTable.ifEntry.ifAdminStatus.436240384=2
In addition, the ifOperStatus value is 2, which means Down:
interfaces.ifTable.ifEntry.ifOperStatus.436240384=2
The integer value 436240384 is the snmp-ifindex of the eth1/9 interface, as shown in the Leaf 201 command output in Example 10-13.
Example 10-13 Verifying Interface Status Through SNMP IFMIB Value
Leaf-201# show interface snmp-ifindex
------------------------------------------
 Port              IFMIB Ifindex (hex)
------------------------------------------
Eth1/9            436240384  (0x1a008000)
Next, you can try performing SNMP read queries as shown in Example 10-14.
Example 10-14 Verifying SNMP Read Query Functionality Through the tcpdump Utility on a Leaf
admin@user-laptop:~> snmpget -v2c -c auto-snmp Leaf-201.cisco.com SNMPv2-
  MIB::sysDescr.0
Leaf-201# tcpdump -i eth0 -f port 161 -v

tcpdump: listening on eth0, link-type EN10MB (Ethernet), capture size 65535 bytes

14:52:48.632453 IP (tos 0x0, ttl 55, id 36995, offset 0, flags [DF], proto UDP (17),
  length 74)
    20.20.20.1.52535 > Leaf-201.cisco.com.snmp:  { SNMPv2c C=auto-snmp { GetRequest
  (28) R=1081746390  system.sysDescr.0 } }

14:52:48.632991 IP (tos 0x0, ttl 64, id 18250, offset 0, flags [none], proto UDP
  (17), length 239)
    Leaf-201.cisco.com.snmp > 20.20.20.1.52535:  { SNMPv2c C=auto-snmp { GetResponse
  (191) R=1081746390  system.sysDescr.0=Cisco NX-OS(tm) aci, Software (aci-
  n9000-system), Version 13.2(7k), RELEASE SOFTWARE Copyright (c) 2002-2015 by Cisco
  Systems, Inc. Compiled 2019/08/15 11:29:24 } }
^C
2 packets captured
2 packets received by filter
0 packets dropped by kernel
From the packet capture output in Example 10-14, you can see that client machine 20.20.20.1 is making an SNMP GetRequest to Leaf-201 by using SNMPv2-MIB to pull system description information. Leaf-201 responds with the SNMP GetResponse.
SPAN
Switched Port Analyzer (SPAN) provides the capability to capture ingress/egress traffic flows from a switch interface. In traditional networking, in order to create a SPAN session, you define the source interface where you want the packets to be duplicated and sent out to your defined SPAN destination, such as a packet analyzer. With ACI, SPAN capabilities are extended further—such as where network admins do not have a packet analyzer available or in a virtualization scenario where, due to workload mobility, the application server VM is allowed to move anywhere. In such cases, ACI makes it possible to capture packets dynamically on the APIC as a SPAN destination and also defines SPAN sources based on the endpoint, regardless of their location.
SPAN in ACI can be configured in four different categories:
Access: For monitoring traffic originating from access ports in leaf nodes
Fabric: For monitoring traffic from fabric ports between leaf and spine nodes
Tenant: For monitoring traffic from endpoint groups (EPGs) within a tenant
Visibility & Troubleshooting: For initiating SPAN based on a defined endpoint to another endpoint
The following sections describe the configuration steps for each of these SPAN categories.
Access SPAN
Access SPAN is used to configure local SPAN or ERSPAN on leaf switches. These SPAN sessions can capture packet ingress, egress, or both directions. SPAN sources can be physical ports, port channels, or VPCs. The SPAN destination can be a local access port if the SPAN source is on the same leaf switch or ERSPAN if the SPAN source is on a different leaf switch. If a packet analyzer is running on a VM front-ended by a virtual switch, the SPAN destination must be ERSPAN, although the host running hypervisor is connected directly to the local leaf switch. For access SPAN, you can create filters based on EPG or L3Out. When routed outside or based on L3Out, SPAN filters based on the encapsulation VLAN used in the routed sub-interface or SVI.
To use access SPAN, you need to first create the SPAN destination. To do that, you go to Fabric > Access Policies > Policies > Troubleshooting > SPAN, right-click SPAN Destination Groups, and select Create SPAN Destination Group. Depending on the SPAN destination type you choose—ERSPAN or local SPAN—select either the EPG or Access Interface option.
For ERSPAN, enter span-erspan-dst as the name of the object. Select the EPG under the application profile in your defined tenant (in this case, t01/cp-infra-prod/mgmt). Type 10.10.10.1 as the destination IP address of the packet analyzer machine. Type 1.1.1.1 as the source IP/prefix. As explained in Chapter 9, SPAN traffic competes with data traffic. Therefore, you need to define the right QoS DSCP values (in this example, CS5). Click Submit.
For local SPAN, type span-local-dst as the name of the object. Select the leaf node and interface through which you are connecting your packet analyzer machine (in this example, 1003-eth1/5). Click Submit. The input values are for example only.
Figure 10-64 illustrates the previous configuration steps.
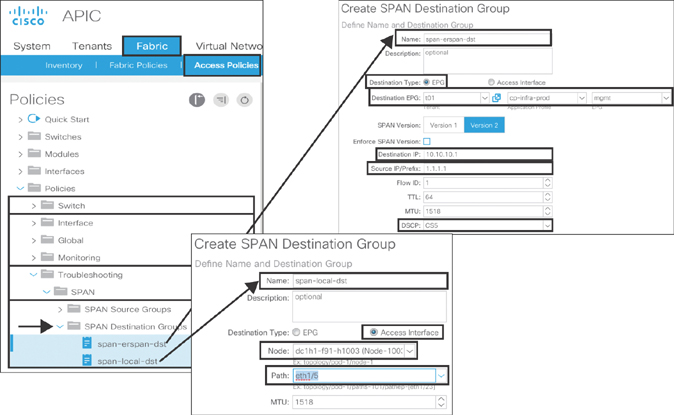
Figure 10-64 Access SPAN Destination
Next, you need to create the SPAN source with different filter options and associate it with the SPAN destination object created earlier. To configure an access SPAN source with no filter, go to Fabric > Access Policies > Policies > Troubleshooting > SPAN, right-click SPAN Source Groups, and select Create SPAN Source Group. Type span-src-web as the name of the object. Select span-local-dst from the Destination Labels drop-down menu. Click the + sign to create a source and specify web-srv as the source name. Keep the default Direction setting, Both, and specify no filter. Click the + sign to add source access paths. Choose Port as the interface path type. Select 1003 from the Node drop-down menu and eth1/55 from the Path menu. Click OK twice and then click Submit. Figure 10-65 illustrates this process.
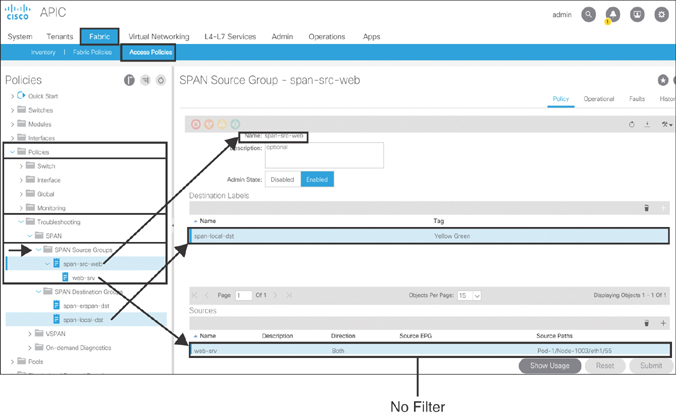
Figure 10-65 Access SPAN Source with No Filter
To configure an access SPAN source with an EPG filter, go to Fabric > Access Policies > Policies > Troubleshooting> SPAN, right-click SPAN Source Groups, and select Create SPAN Source Group. Type span-src-web as the name of the object. Select span-erspan-dst from the Destination Labels drop-down menu. Click the + sign to create a source and specify web-srv as the source name. Keep the default Direction setting, Both, and set the filter type to EPG. From the Source EPG drop-down menu, select t01/c-inf/c-net-mgmt. Click the + sign to add source access paths. Choose Port as the interface path type. Select 1003 from the Node drop-down menu and eth1/55 from the Path menu. Click OK twice and then click Submit. Figure 10-66 illustrates this process.

Figure 10-66 Access SPAN Source with an EPG Filter
To configure an access SPAN source with a routed outside filter, go to Fabric > Access Policies > Policies > Troubleshooting > SPAN, right-click SPAN Source Groups, and select Create SPAN Source Group. Type span-src-web as the name of the object. Select span-erspan-dst from the Destination Labels drop-down menu. Click the + sign to create a source and specify web-srv as the source name. Keep the default Direction setting, Both, and select the filter type Routed Outside. Choose l3out:d-core as the name of the routed outside object, and type 10.10.10.1/30 as the transport IP address of the border leaf for peering with the external router.
Note
Fault F1561 is raised if the IP address does not match the transport address of the border leaf connecting to the external router.
Type the encapsulation VLAN of the SVI or routed subinterface that you used in peering your border leaf with the external router (in this example, 50). Click the + sign to add a source access path. Choose Port as the interface path type. Select 1003 from the Node drop-down menu and eth1/55 from the Path drop-down menu. Click OK twice and then click Submit. Figure 10-67 illustrates this process.

Figure 10-67 Access SPAN Source with a Routed Outside Filter
Fabric SPAN
Fabric SPAN is used to capture packets from fabric ports between leafs and spines. These SPAN sessions can capture packet ingress, egress, or both directions. SPAN sources can only be fabric ports between leafs and spines. The SPAN destination can only be an ERSPAN. For fabric SPAN, you can create filters based on a VRF instance or bridge domain.
To create a fabric SPAN, you need to first create the SPAN destination. To do that, you go to Fabric > Access Policies > Policies > Troubleshooting > SPAN, right-click SPAN Destination Groups, and select Create SPAN Destination Group. As mentioned earlier, the only Destination option in fabric SPAN is ERSPAN. Type span-erspan-dst as the name of the object. Select t01/c-inf/infra-mgmt as the EPG under the application profile in your defined tenant. Type 10.10.10.1 as the destination IP address of the packet analyzer machine. Type 1.1.1.1 as the source IP/prefix. As explained in Chapter 9, SPAN traffic competes with data traffic. Therefore, you need to define the right QoS DSCP values (in this example, CS5). Click Submit. Figure 10-68 illustrates these configuration steps. The input values are for example only.
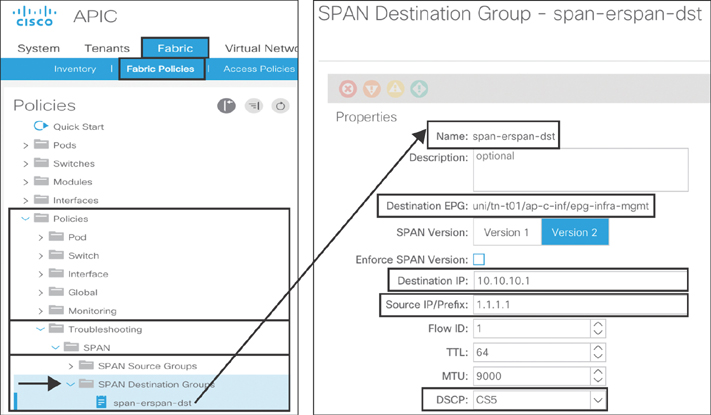
Figure 10-68 Fabric SPAN Destination
Next, you need to create a SPAN source with different filter options and associate it with the SPAN destination object created earlier. To configure a fabric SPAN source with a VRF filter, go to Fabric > Fabric Policies > Policies > Troubleshooting> SPAN, right-click SPAN Source Groups, and select Create SPAN Source Group. Type span-fabric-src as the name of the object. Select span-erspan-dst from the Destination Labels drop-down menu. Click the + sign to create a source. Specify leaf-1004 as the source name. Keep the default direction, Both, set Association to VRF, and select cp-standard from the VRF drop-down menu. Click the + sign to add a source fabric path. From the drop-down menu, select 1004-eth1/97 as the fabric path and click Update. Click the + sign again, add 1004-eth1/98 as a source fabric path, and click Update. Click OK and then click Submit. Figure 10-69 illustrates this process.
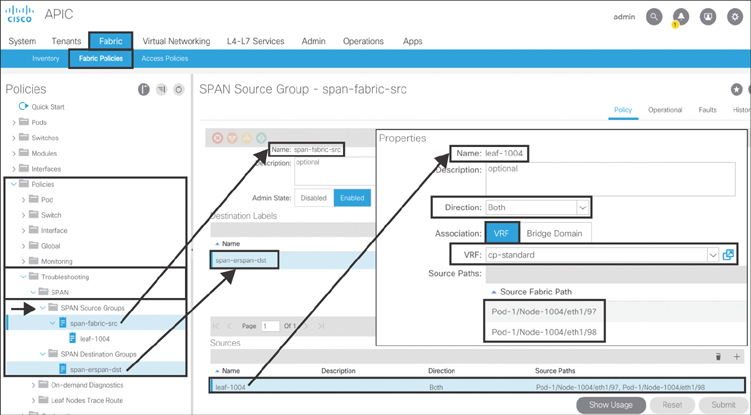
Figure 10-69 Fabric SPAN Source with VRF Filter
To configure a fabric SPAN source with a bridge domain filter, go to Fabric > Fabric Policies > Policies > Troubleshooting> SPAN, right-click SPAN Source Groups, and select Create SPAN Source Group. Type span-fabric-src as the name of the object. Select span-erspan-dst from the Destination Labels drop-down menu. Click the + sign to create a source. Specify leaf-1004 as the source name. Keep the default direction, Both, set Association to Bridge Domain, and select a-tools as the bridge domain. Click the + sign to add a source fabric path. From the drop-down menu, select 1004-eth1/97 as the fabric path and click Update. Click the + sign again, add 1004-eth1/98 as a source fabric path, and click Update. Click OK and then click Submit. Figure 10-70 illustrates this process.
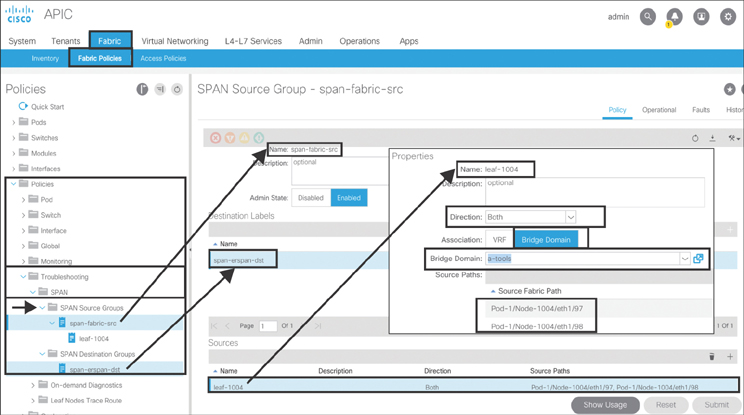
Figure 10-70 Fabric SPAN Source with a Bridge Domain Filter
Tenant SPAN
Tenant SPAN is used to capture packets from an EPG that is part of an application profile contained in a tenant. These SPAN sessions can capture packets ingress, egress, or both directions. A SPAN source can only be an EPG. The SPAN destination can only be an ERSPAN. There are no SPAN filter options available for tenant SPAN.
To create a Tenant SPAN, you need to first create the SPAN destination. To do that, go to Tenant tab > t01 > Policies > Troubleshooting > SPAN, right-click SPAN Destination Groups, and select Create SPAN Destination Group. As mentioned earlier, the only destination option in tenant SPAN is ERSPAN. Type span-erspan-dst as the name of the object. Select t01/c-inf/infra-mgmt as the EPG under the application profile in your defined tenant. Type 10.10.10.1 as the destination IP address of the packet analyzer machine. Type 1.1.1.1 as the source IP/prefix. As explained in Chapter 9, SPAN traffic competes with data traffic. Therefore, you need to define the right QoS DSCP values (in this example, CS5). Click Submit. Figure 10-71 illustrates these configuration steps. The input values are for example only.

Figure 10-71 Tenant SPAN Destination
Next, you need to create a SPAN source and associate it with the SPAN destination object created earlier. To do so, go to Tenant > t01 > Policies > Troubleshooting > SPAN, right-click SPAN Source Groups, and select Create SPAN Source Group. Type span-tenant-src as the name of the object. Select span-erspan-dst from the Tenant Destination Labels drop-down menu. Click the + sign to create a source. Type web-srv as the source name. Choose the default direction, Both. Select c-tools from the Source EPG drop-down menu and click OK. Click Submit. Figure 10-72 illustrates this process.

Figure 10-72 Tenant SPAN Source
Ensuring Visibility and Troubleshooting SPAN
ACI offers a unique SPAN capability in which you can use the APIC controller as the SPAN destination. This provides a useful capability to take a quick look at an endpoint connectivity issue remotely without the need for a packet-capturing host. It’s important to note that the capture rate might be limited because you’re capturing to the APIC.
Note
It is mandatory to have INB management in order to run a SPAN session in the Visibility & Troubleshooting tool. Without it, you get an error.
In order to create a SPAN session in the Visibility & Troubleshooting tool, you first need to create a session between two endpoints. To do that, go to Operations > Visibility & Troubleshooting. Type sadiq-web as the session name and select External IP to Endpoint as the session type. Under Source, type 50.50.50.1 as the external IP address. Under Destination, type 100.100.100.1 as the destination IP address and click Search. ACI locates the endpoint connected to one of its leaf switches; in this example, the destination endpoint belongs to EPG-mgmt, which is part of Application-cp-infra-prod, contained within Tenant-t01, and learned on virtual port-channel 1001-1002-vpc-e13-18. Click Start. Figure 10-73 illustrates these configuration steps. The input values are for example only.

Figure 10-73 Visibility & Troubleshooting Session
After a few seconds, ACI uploads the full topology view of the two endpoints (External IP and Endpoint) that you already selected in the Visibility & Troubleshooting tool. Next, click the SPAN tab, and in the window that appears, select APIC as the destination type and type 172.168.1.0 as the source IP prefix (because this is the ERSPAN prefix). The last octet will be the node ID of the leaf from which the packets are captured. From the Flow ID drop-down menu select 1. From the Preferred Version drop-down menu select Version 2. Click the Play button. Run your traffic between endpoints for a short period and then click the Stop button. The capture stops, and the data is stored in a PCAP file. You can download the file for further analysis from the APIC to your local PC by clicking that file. Figure 10-74 illustrates this process.

Figure 10-74 Visibility & Troubleshooting SPAN
Verifying the SPAN Configuration and Functionality
There are different ways to verify your SPAN configuration and functionality. Example 10-15 shows verification steps that should typically suffice for a SPAN configuration in ACI.
Example 10-15 Verifying SPAN Configuration
APIC2# show monitor access session leaf3
Type           : access
Session        : leaf3  *** Session not created by CLI ***
Node           : 303
Type           : local
Admin state    : enabled
Oper state     : up (active)
Dest Interface : eth1/21
Interface/Vlan/Vxlan    State   State Qualifier   Dir     Encap/BdEncap
  FabEncap/CtxEncap
 ----------------------  ------  ----------------  ------  --------------------
  ------------------
 po2                     up      active            both    vlan-811
  vxlan-15564700


Leaf3# show monitor session all
   session 3
---------------
description       : Span session 3
type              : local
state             : up (active)
mode              : access
source intf       :
    rx            : Po2
    tx            : Po2
    both          : Po2
source VLANs      :
    rx            :
    tx            :
    both          :
filter VLANs      : 76
filter L3Outs     : vlan74
destination ports : Eth1/21
NetFlow
NetFlow is a networking protocol for caching traffic flows passing through a router. These flows can then be exported out to a NetFlow collector for further analysis. NetFlow data is used for isolating application slowness and for bandwidth monitoring, cyber threat forensics, and network usage billing.
NetFlow has been supported since ACI Release 2.2(1), and it is available on the Nexus 9300 Gen-2 cloud-scale platform, such as EX and FX. In addition, NetFlow is also supported on remote leafs with ACI Release 4.0(1). In ACI, you can either enable NetFlow on Nexus 9300 cloud-scale platforms or enable Tetration Hardware Agent but not both.
To configure NetFlow, you need to first enable NetFlow on Nexus 9300 cloud-scale platforms. To do that, go to Fabric > Fabric Policies > Policies > Monitoring, right-click Fabric Node Control, and select Create Fabric Node Control. Type netflow as the object name, set Feature Selection to NetFlow Priority, and click Submit. Figure 10-75 illustrates this process. The input values are for example only.
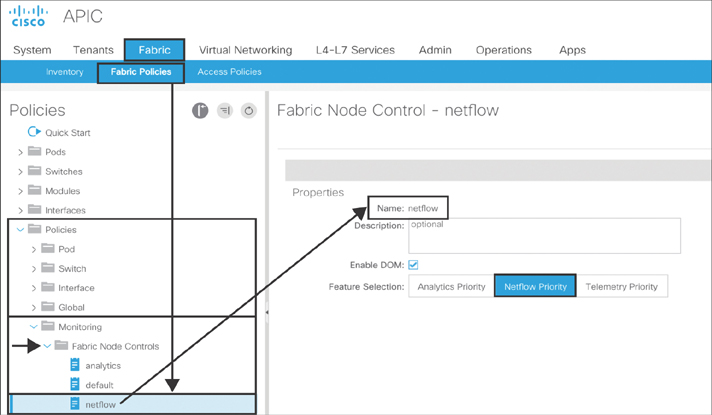
Figure 10-75 Enabling NetFlow Policies
Next, you create policy groups. To do this, go to Fabric > Fabric Policies > Switches > Leaf Switches, right-click Policy Groups, and select Create Policy Group. Type netflow-sw-polgrp as the object name. Choose netflow from the Node Control Policy drop-down menu. Click Submit. Figure 10-76 illustrates this process.

Figure 10-76 Enabling NetFlow Policy Groups
Finally, you need to create a profile. To do so, go to Fabric > Fabric Policies > Switches > Leaf Switches, right-click Profiles, and select Create Profile. Type leaf-sw-prof as the object name. Click the + sign to add switch associations. Type L201 as the object name. Select 201 in the Blocks column to run NetFlow in this leaf node. Select netflow-sw-polgrp in the Policy Group column. Click Update and then click Submit. Figure 10-77 illustrates this process. You should now be able to run NetFlow on Leaf 201.

Figure 10-77 Enabling a NetFlow Profile
NetFlow policies can be configured as either of the following:
Access policies (leaf downlink ports: access, VPC, port channel)
Tenant policies (bridge domain, L3Out)
In order to configure NetFlow, you need to follow four basic steps:
Step 1. Create a record (IPv4/IPv6).
Step 2. Create an exporter.
Step 3. Create a monitor and associate the record and exporter with it.
Step 4. Apply the monitor on the leaf interface.
The following sections walk through these steps for NetFlow access policies and tenant policies.
NetFlow with Access Policies
To configure NetFlow with access policies, you first need to create a NetFlow record. To do so, go to Fabric > Access Policies > Policies > Interface > NetFlow, right-click NetFlow Records, and select Create Flow Record. Type ipv4-record as the object name. Keep the Collect Parameters drop-down set to the default, Source Interface. From the Match Parameters drop-down menu, select Source IPv4, Destination IPv4, Source Port, Destination Port, and IP Protocol. Click Submit. Figure 10-78 illustrates this process.
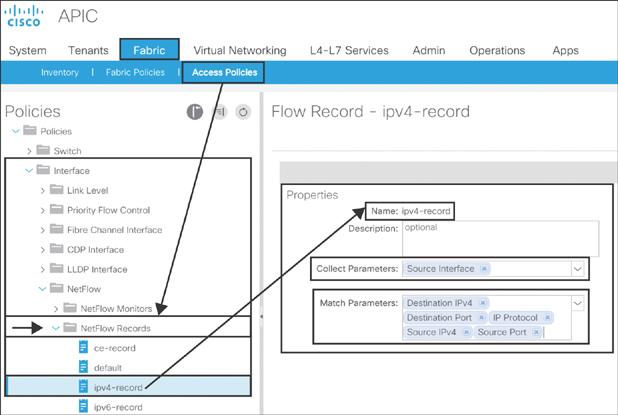
Figure 10-78 Configuring a NetFlow Record with Access Policies
Next, you need to create the NetFlow exporter. To do that, go to Fabric > Access Policies > Policies > Interface > NetFlow, right-click NetFlow Exporters, and select Create External Collector Reachability. Type solarwinds as the object name. Keep the Source Type drop-down set to the default, Custom Src IP. Type 1.1.0.0/24 as the source IP address. The last octet of the prefix shows the node ID of the leaf on which NetFlow is enabled. Type 2055 as the destination port and 20.86.84.111 as the destination IP address. As with SPAN, NetFlow traffic competes with data traffic, so you need to choose CS5 as the QoS DSCP value. Set NetFlow Exporter Version Format to Version 9 (as this is the only format that ACI supports). Depending on the location of the NetFlow collector, you need to pick the EPG Type—either App EPG or L3 EPG; in this case, choose L3 EPG. Set Tenant to t01, L3 EPG to l3out:d-core, and VRF to standard. Click Submit. Figure 10-79 illustrates this process.
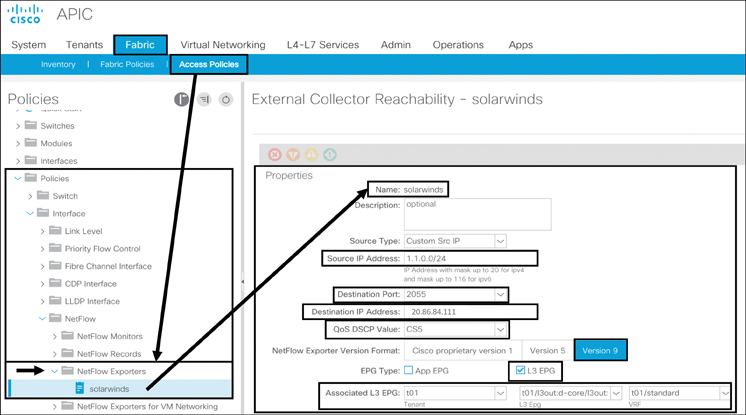
Figure 10-79 Configuring the NetFlow Exporter with Access Policies
Next, you now need to create the NetFlow monitor and associate the previously created NetFlow record and exporter with it. To do that, go to Fabric > Access Policies > Policies > Interface > NetFlow, right-click NetFlow Monitors, and select Create NetFlow Monitor. Type ipv4-monitor as the object name. Set Associated Flow Record to the previously created ipv4-record NetFlow record. Click the + sign and set Flow Exporter to the previously created solarwinds NetFlow exporter. Click Update and then click by Submit. Figure 10-80 illustrates this process.

Figure 10-80 Configuring the NetFlow Monitor with Access Policies
Finally, you need to associate the NetFlow monitor with the leaf interface. To do that, go to Fabric > Access Policies > Interfaces > Leaf Interfaces > Leaf Access Port and select t01-l3-aep-auto-discover, the border leaf interface policy group that you configured for L3Out connectivity to the external router. In addition to a leaf access port, you can also use a port channel or a VPC, depending on how you have connected your border leaf to the external router. On the right side of the screen, click the + sign and set NetFlow Monitor Policies to the previously created ipv4-monitor policy. Click Update and then click Submit. Figure 10-81 illustrates this process.

Figure 10-81 Applying the NetFlow Monitor to a Leaf Interface with Access Policies
Note
Border leaf interface eth1/4 is selected in the Profiles tab. This is the interface used to peer from the border leaf to the external router in this example.
NetFlow with Tenant Policies
To configure NetFlow with tenant policies, you first create the NetFlow Record. To do so, go to Tenant > t01 > Policies > NetFlow, right-click NetFlow Records, and select Create Flow Record. Type ipv4-record as the object name. Keep the Collect Parameters drop-down set to the default, Source Interface. From the Match Parameters drop-down menu, select Source IPv4, Destination IPv4, Source Port, Destination Port, and IP Protocol. Click Submit. Figure 10-82 illustrates this process.

Figure 10-82 Configuring a NetFlow Record with Tenant Policies
Next, you need to create the NetFlow Exporter. To do that, go to Tenant > t01 > Policies > NetFlow, right-click NetFlow Exporters, and select Create External Collector Reachability. Type flow-exporter as the object name. Keep the Source Type drop-down set to the default, Custom Src IP. Type 1.1.0.0/24 as the source IP address. The last octet of the prefix shows the node ID of the leaf on which NetFlow is enabled. Type 2055 as the destination port and 30.88.197.38 as the destination IP address. As with SPAN, NetFlow traffic competes with data traffic, so you need to choose CS5 as the QoS DSCP value. Set NetFlow Exporter Version Format to Version 9 (as this is the only format that ACI supports). Depending on the location of the NetFlow collector, you need to pick the EPG Type—either App EPG or L3 EPG; in this case, choose App EPG. Set Tenant to t01, Application EPG to cp-infra-prod/services, and VRF to standard. Click Submit. Figure 10-83 shows this process.
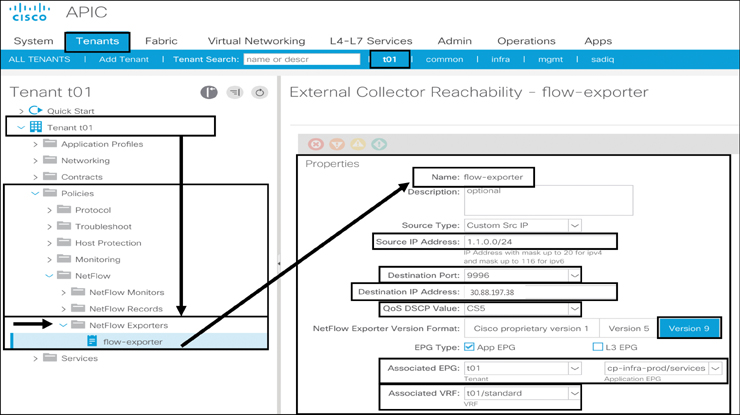
Figure 10-83 Configuring the NetFlow Exporter with Tenant Policies
Next, you need to create the NetFlow monitor and associate the previously created NetFlow record and exporter with it. To do that, go to Tenant > t01 > Policies > NetFlow, right-click NetFlow Monitors, and select Create NetFlow Monitor. Type ipv4-monitor as the object name. Set Associated Flow Record to the previously created ipv4-record NetFlow record. Click the + sign and set Flow Exporter to the previously created flow-exporter NetFlow exporter. Click Update and then click by Submit. Figure 10-84 illustrates this process.

Figure 10-84 Configuring the NetFlow Monitor with Tenant Policies
Finally, you need to associate the monitor with the leaf interface. To do that, go to Tenant > t01 > Networking > External Routed Networks and select l3out:d-core as the L3Out policy object. Expand t01-node-prof and then example t01-ospf-prof. On the right side of the screen, click the + sign and set NetFlow Monitor Policies to the previously created ipv4-monitor policy. Click Update and then click Submit. Figure 10-85 illustrates this process.
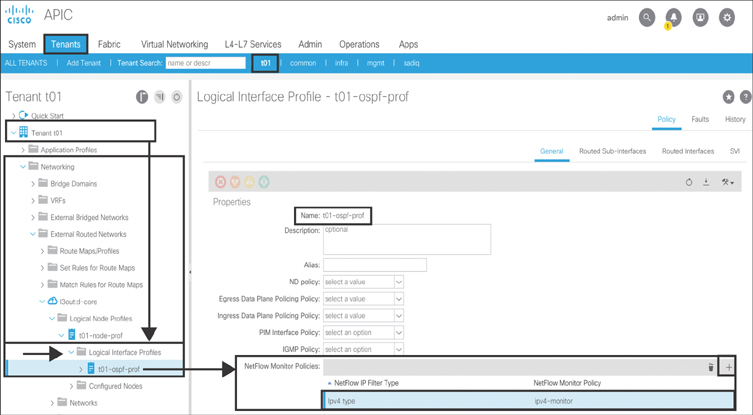
Figure 10-85 Applying a NetFlow Monitor to a Leaf Interface with Tenant Policies
You have finished configuring NetFlow in ACI, and you’re ready to verify your configuration.
Verifying the NetFlow Configuration and Functionality
Example 10-16 shows verification steps that should typically suffice for a NetFlow configuration in ACI.
Example 10-16 Verifying the NetFlow Configuration
tcsh1-f02-b0201# show flow cache ipv4
IPV4 Entries
SIP             DIP             BD ID   S-Port   D-Port   Protocol  Byte Count
  Packet Count  TCP FLAGS  if_id       flowStart
10.88.146.51    10.88.197.48    4611    53       37779    17        144
  1        0x0        0x1a003000  28365088  28365088
10.88.150.154   2.2.2.2         4611    28570    1967     17        98
  1        0x0        0x1a003000  28367890  28367890
10.88.144.73    10.88.197.53    4611    5640     59228    6         70
  1        0x10       0x1a003000  28365680  28365680
10.88.194.7     10.88.193.14    4611    58282    4353     6         10456
  98       0x18       0x1a003000  28365917  28367549
tcsh1-f02-b0201# show flow exporter
Flow exporter solarwinds:
    Destination: 20.86.84.111
    VRF: t01:standard (1)
    Destination UDP Port 2055
    Source: 1.1.0.201
    DSCP 40
    Export Version 9
        Sequence number 2656
        Data template timeout 0 seconds
    Exporter Statistics
        Number of Flow Records Exported 8582
        Number of Templates Exported 9
        Number of Export Packets Sent 255
        Number of Export Bytes Sent 349040
        Number of Destination Unreachable Events 0
        Number of No Buffer Events 0
        Number of Packets Dropped (No Route to Host) 0
        Number of Packets Dropped (other) 0
        Number of Packets Dropped (Output Drops) 0
        Time statistics were last cleared: Never
Feature Prio: NetFlow

tcsh1-f02-b0201# show flow exporter
Flow exporter t01:flow-exporter:
    Destination: 30.88.197.38
    VRF: t01:standard (1)
    Destination UDP Port 9996
    Source: 1.1.0.201
    DSCP 44
    Export Version 9
        Sequence number 895
        Data template timeout 0 seconds
    Exporter Statistics
        Number of Flow Records Exported 30240
        Number of Templates Exported 30
        Number of Export Packets Sent 895
        Number of Export Bytes Sent 1229700
        Number of Destination Unreachable Events 0
        Number of No Buffer Events 0
        Number of Packets Dropped (No Route to Host) 0
        Number of Packets Dropped (other) 0
        Number of Packets Dropped (Output Drops) 0
        Time statistics were last cleared: Never
Feature Prio: NetFlow
Summary
Managing and monitoring are two extremely crucial subjects in the smooth execution and operation of any network. In this chapter, you have learned about key ACI management and monitoring protocols, such as OOB and INB management, AAA, syslog, SNMP, SPAN, and NetFlow, and their respective configurations. You have also learned how to verify and validate these configurations.
Note
There are no Key Topics or Review Questions for this chapter.