
Chapter 5. Data Tables
Tables are an html structure designed to present information in tabular format. Table markup has several components and attributes that can be used to identify the elements in a standard data table: column headings, row headings, caption, and content summary. When these elements are used properly, a data table can be understood by both visual and nonvisual users.
However, tables are often pressed into service for other purposes, including page layout, alignment, and spacing. Invisible tables (<table border="0">) are commonly used to create multicolumn layouts that display consistently across browsers. When table markup is misused in this way, documents become less machine-readable. Software cannot read a document accurately when its semantic meaning has been diluted with meaningless tables.
On the other hand, when table markup is used appropriately and correctly, software can read table structure. For example, screen reader software offers a table navigation option that allows users to move to a cell and hear its contents read aloud along with its column and row headings. Without correctly coded structure, however, the user will hear only the contents of the cell without the context provided by the headings.
Given the limitations of the medium—low resolution, limited and variable display—simple tables fare better on the Web. The primary concern with data tables is that users can easily become disoriented. Visual users may find it difficult to decode data when column headings are offscreen. Nonvisual users access each table element individually and do not have the means to orient themselves visually.
5.1. Basic Principles
5.1.1. Use table markup for data
Before styles were implemented and supported by client software, Web designers had no tools for laying out Web pages. HTML is not a tool for design and page layout; it is for defining document structure. As such, it is composed almost entirely of structural elements, with very few tags to describe visual properties. With the early versions of HTML, visual representation of structure was defined largely by the client software: for example, headings big and bold, quotations indented, and paragraphs separated by a blank line. Following strict HTML coding meant that Web designers really had very little chance to design their pages. With few options and little control, Web designers began to be creative in their use of HTML structures.
For example, no structural element exists to mark a banner or navigation bar. Yet these elements are commonly used on Web sites to establish site identity and to offer navigation links to other pages in the site. One common approach to producing this familiar layout is to use table markup to divide the page into different areas (Figure 5.1).
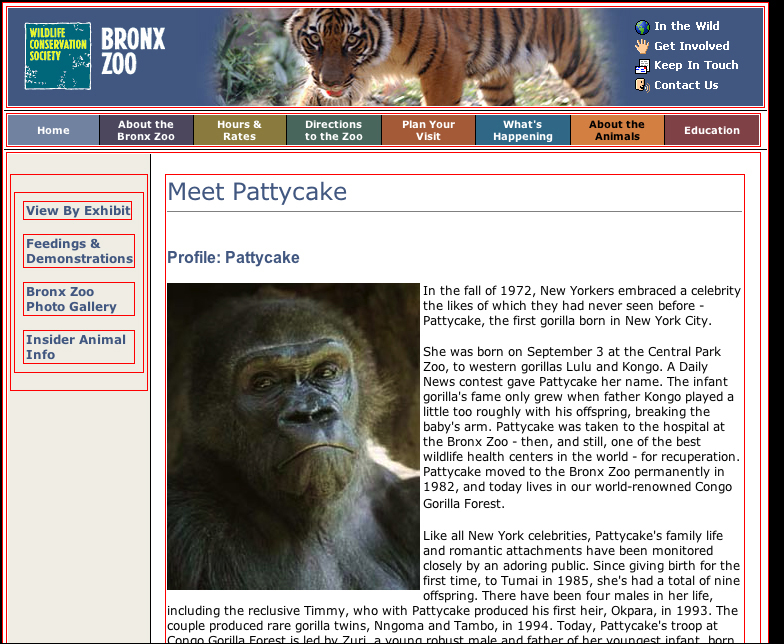
FIGURE 5.1 The Bronx Zoo pages are divided into sections—a site banner and site navigation across the top of the page, section navigation links in the left column, and the main content in the right column—using a layout table.
The trouble with this practice is that semantic markup, such as the tags used to describe tables, is intended to describe the function of elements. When these tags are misused, documents are no longer machine-readable in a way that is accurate and meaningful. Software cannot distinguish “real” tables from layout tables and will try to make sense of content that is within a table.
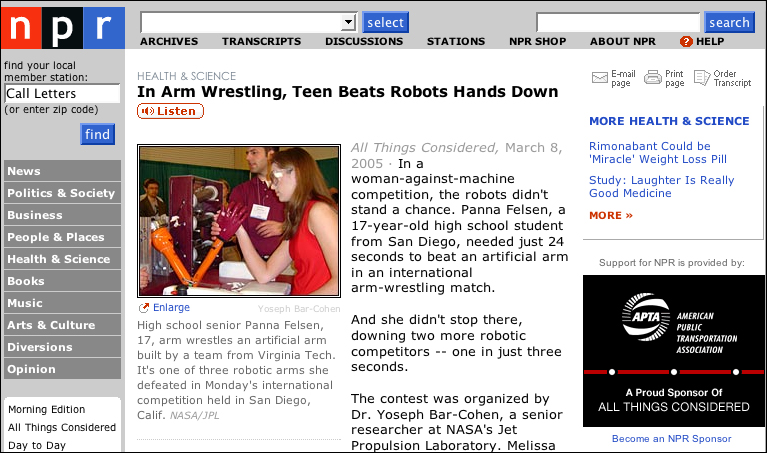
Before CSS, table markup was the only option for laying out Web pages; this is no longer the case. Style sheet positioning is widely supported by client software and is a far better tool for Web page layout (Figure 5.2).
In a nutshell. Structural integrity requires that tags be used appropriately. Avoid using tables for layout; use tables to mark up tabular information.
5.1.2. Simplify data table layouts
One of the more cumbersome aspects of Web documents is the scroll. With longer documents, users have no means of viewing a complete document, short of printing. Instead, pages must be viewed in segments. When documents are divided in this way, users may find it difficult to keep track of context, and may have to resort to scrolling up and down between sections (the equivalent of flipping between pages) to get a complete picture of the information.
When getting information from a table of data, context is essential. A cell of information has little meaning without the column and row headings that describe it. When we work with tables printed from spreadsheet or word-processing applications, these essential elements can be printed on each page. On a Web page, complex or lengthy tables will sometimes display with headings offscreen, or print with headings on a separate page.
When accessing tabular information, nonvisual users rely on software to provide context. A properly coded table enables software to announce the column and row headings that are associated with a table cell. However, a complex table with multiple dimensions and spanned columns or rows can be difficult for software to interpret effectively.
In general, the best way to design tables for visual and nonvisual users is to simplify the layout as much as possible. A simple table will be easier to scan, and easier for software to interpret. Rather than represent many information layers in one table, break the information into separate tables with a maximum of two dimensions (one row of column headings, one column of row headings) in each table (Figure 5.3).
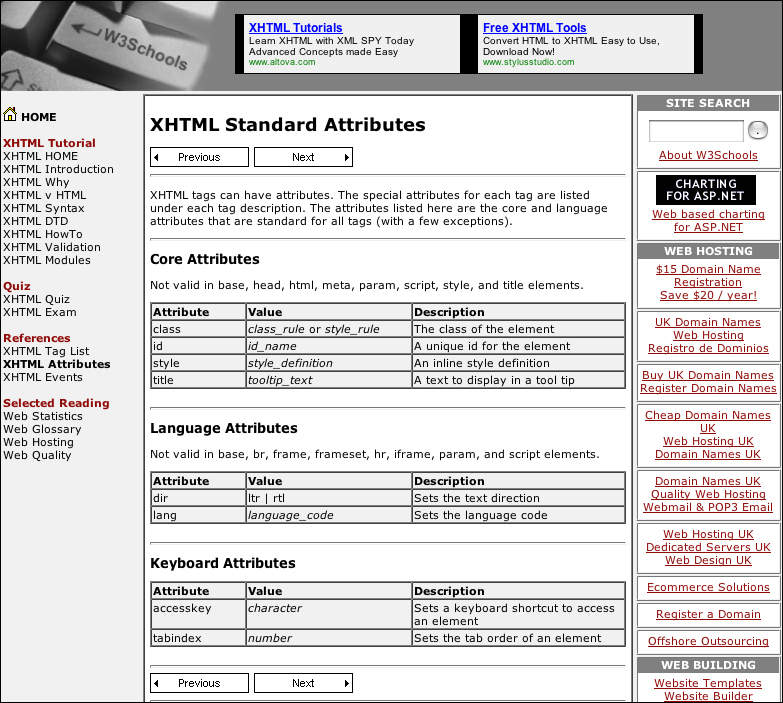
FIGURE 5.3 W3Schools uses tables to provide details in its Web tutorials. On this page, rather than present all XHTML standard attributes as one complex, multidimensional table, the attributes are broken down into categories and presented in simple tables.
In a nutshell. Complex data tables can be challenging to navigate for both visual and nonvisual users. Present tabular information in its simplest form for easier scanning and screen reader access.
5.2. Markup
5.2.1. Identify data table row and column headings
Imagine a table with no column or row headings. Each table cell would exist without context, making it difficult, if not impossible, to make sense of the information presented (Figure 5.4, next page).
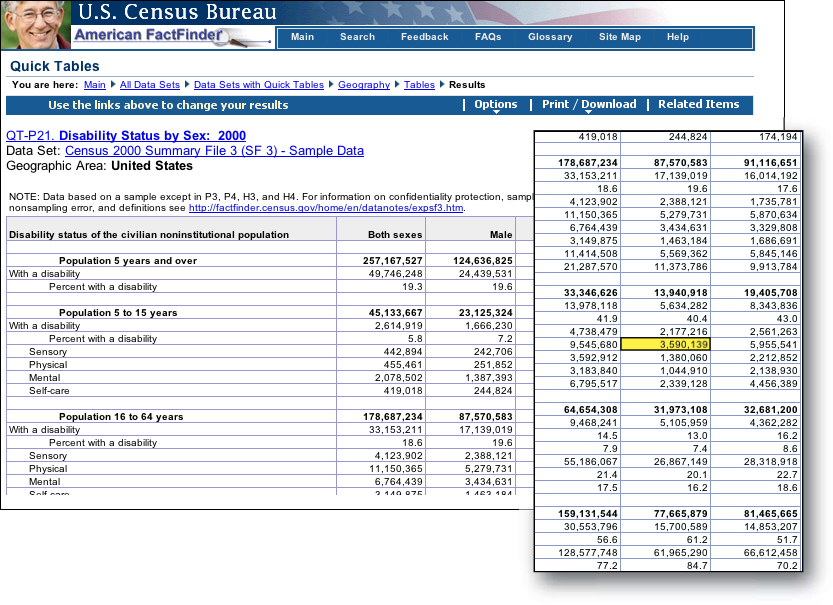
FIGURE 5.4 Data has meaning when it is presented in context, as in this data table from the U.S. Census Bureau. The numbers in the table cells have little meaning without the associated column and row headings, as demonstrated in the inset.
Nonvisual users have a similar experience when tables are presented without properly coded row and column headings. When table cells are not explicitly tied to descriptive text, the best that software can manage is to infer that the first row and first column are headings.
The simplest way to bind headings to table cells is to use the SCOPE attribute of the table header tag (TH) to make the relationship between headings and data explicit. When coding a column or row heading, adding the SCOPE attribute declares all cells below (<th scope="col">) or to the right (<th scope="row">) as belonging to that heading.
The SCOPE attribute works best with tables that have one or two dimensions—just one set of column headings and one set of row headings. For more complex tables, there are other methods for assigning headings, but they may not have the desired effect. Complex tables are generally difficult to decipher, and even a properly coded complex table may not be usable. Rather than tackle a complex table with complicated table code, try instead to simplify the table layout (Figure 5.5).
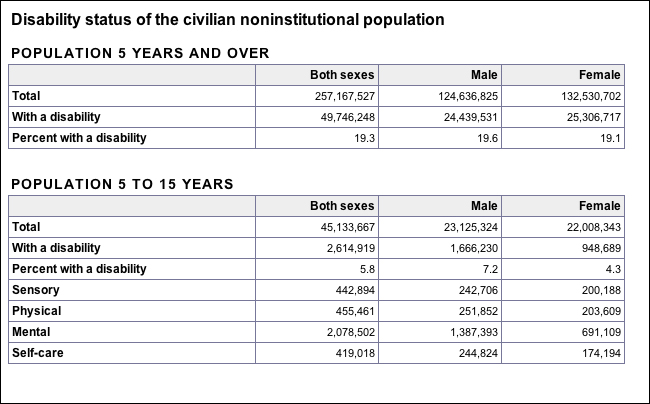
FIGURE 5.5 One approach to presenting complex data is to simplify its presentation. Here, the Disability Status table is broken into separate tables representing each population group. These simplified tables can be coded using basic table tags—CAPTION, TR, TH, and TD—and using SCOPE to associate headings and data.
In a nutshell. Table headings are essential for establishing context for the data contained within the rows and columns of a table. Code tables so row and column headings are explicitly tied to the data they describe.
5.2.2. Use CAPTION and SUMMARY to describe data tables
In addition to headings, HTML provides two other ways to describe tabular information: CAPTION and SUMMARY. A table caption is a short title that describes the subject of the table. Captions display with the table they describe and can be formatted using CSS. A summary is a nondisplaying attribute of the TABLE tag that summarizes what is described in the table. Since SUMMARY does not display, its practical purpose is to provide nonvisual users with a brief description of the subject and format of a data table. When both SUMMARY and CAPTION are present, screen reader users can orient themselves prior to working with a data table.
In a nutshell. Provide additional context by using CAPTION and SUMMARY tags to tie descriptive information about data tables to the tables they describe.