
Chapter 11
Inside Information for Managers Only
IN THIS CHAPTER
Recognizing the managerial limits of external financial statements
Examining the additional information needed for managing assets and liabilities
Identifying the in-depth information needed for managing profit
Providing additional information for managing cash flow
If you’re a business manager, I strongly suggest that you read the preceding chapter before continuing with this one. Chapter 10 discusses how a business’s external, nonmanagerial lenders and investors read an external financial report. These stakeholders are entitled to regular financial reports so they can determine whether the business is making good use of their money. The chapter explains key ratios that the external stakeholders use for interpreting the financial condition, profit performance, and cash flows of a business — which are equally relevant for the managers of the business.
 Business managers should understand the financial statement ratios in Chapter 10. Every ratio does double duty; it’s useful to the outside lenders and investors of the business and equally useful to its internal managers. For example, the profit ratio and return on assets ratio are extraordinarily important to both the external stakeholders and the managers of a business — the first measures the profit yield from sales revenue, and the second measures profit on the assets employed by the business.
As important as they are, external financial statements don’t provide all the accounting information that managers need to plan and control the financial affairs of a business. Managers who look no further than these statements really don’t have all the information they need to do their jobs. This additional information, which is largely confidential, is available from the accounting system of the business (or should be).
The accounts reported in external financial statements are like the table of contents of a book; each account is like a chapter title. Managers need to do more than skim chapter titles. They need to read the chapters. This chapter looks behind the accounts reported in the external financial statements. I explain the types of additional accounting information that managers need in order to control financial condition, profit performance, and cash flows and to plan the financial future of their business.
Building on the Foundation of the External Financial Statements
 Managers are problem solvers. Every business has problems, perhaps even some serious ones. However, external financial statements aren’t designed to highlight such problems. Except in extreme cases — in which the business is obviously in dire financial straits — you’d never learn about its problems just from reading its external financial statements. To borrow lyrics from an old Bing Crosby song, external financial statements are designed to “accentuate the positive, eliminate the negative … [and] don’t mess with Mister In-Between.”
Seeking out problems and opportunities
Business managers need more accounting information than what’s disclosed in external financial statements for two basic purposes:
- To alert them to problems that exist or may be emerging that threaten the profit performance, cash flow, and financial condition of the business
- To suggest opportunities for improving the financial performance and health of the business
A popular expression these days is “mining the data.” The accounting system of a business is the mother lode of management information, but you have to dig that information out of the accounting database. Working with the controller (chief accountant), a manager should decide what information she needs beyond what’s reported in the external financial statements.
Avoiding information overload
Business managers are very busy people. Nothing is more frustrating than getting reams of information that you have no use for. For that reason, the controller should guard carefully against information overload. While some types of accounting information should stream to business managers on a regular basis, other types should be provided only as needed.
Ideally, the controller reads the mind of every manager and provides exactly the accounting information that each manager needs. In practice, that can’t always happen, of course. A manager may not be certain about which information she needs and which she doesn’t. The flow of information has to be worked out over time.
Furthermore, how to communicate the information is open to debate and individual preferences. Some of the additional management information can be put in the main body of an accounting report, but most is communicated in supplemental schedules, graphs, and commentary. The information may be delivered to the manager’s computer, or the manager may be given the option to call up selected information from the accounting database of the business.
My point is simply this: Managers and controllers must communicate — early and often — to make sure managers get the information nuggets they need without being swamped with unnecessary data. No one wants to waste precious time compiling reports that are never read. So before a controller begins the process of compiling accounting information for managers’ eyes only, be sure there’s ample communication about what each manager needs.
Gathering Financial Condition Information
The balance sheet — one of three primary financial statements included in an external financial report — summarizes the financial condition of the business. (See Chapter 6 for details.) Figure 11-1 presents an example of an externally reported balance sheet. This example is taken from my and my son’s How to Read a Financial Report, 8th Edition (Wiley). A business may report more than the accounts included in the example. For example, a business may invest in marketable securities or have receivables from loans made to officers of the business. A business corporation may issue more than one class of capital stock and would report a separate account for each class. And so on.

© John Wiley & Sons, Inc.
FIGURE 11-1: Balance sheet example.
The idea of the figure is to focus on the core assets and liabilities of a typical business. Notice two assets in the balance sheet: accounts receivable and inventory. These two accounts in the balance sheet tell you that the business sells products and makes sales on credit to its customers. Businesses that sell services don’t have an inventory asset account, and businesses that sell only for cash and cash equivalents (credit/debit cards) don’t report accounts receivable. A balance sheet reflects the nature and practices of the business entity, of course.
Notice that in Figure 11-1 the balance sheet is for last year and this year (the fiscal year just ended). And the balance sheet includes a column for changes in each account during the year. For example, you may notice that the company’s cash balance actually decreased $470,000 during the year. Don’t hit the panic button just yet. A decrease in cash doesn’t mean that the business suffered a loss for the year. Indeed, Figure 11-2 shows that the business made a nice profit for the year.

© John Wiley & Sons, Inc.
FIGURE 11-2: Income statement example.
The following sections walk down the balance sheet — assets first, then liabilities, and last, owners’ equity accounts — stressing what sorts of inside financial information managers need to carry out their job.
Cash
The external balance sheet (Figure 11-1) reports just one cash account. But many businesses keep several bank checking and deposit accounts, and some (such as casinos and supermarkets) keep a fair amount of currency on hand. A business may have foreign bank deposits in euros, English pounds, or other currencies. Most businesses set up separate checking accounts for payroll; only payroll checks are written against these accounts.
Managers should monitor the balances in every cash account in order to control and optimize the deployment of their cash resources. Therefore, information about each bank account should be reported to the manager.
Managers should ask these questions regarding cash:
- Is the ending balance of cash the actual amount at the balance sheet date, or did the business engage in window dressing in order to inflate its ending cash balance? Window dressing refers to holding the books open after the ending balance sheet date in order to record additional cash inflow, as if the cash were received on the last day of the period. Window dressing is not uncommon. (For details, see Chapter 9.) If window dressing has gone on, the manager should know the true, actual ending cash balance of the business.
- Were there any cash zero days during the year? In other words, did the company’s cash balance actually fall to zero (or near zero) during the year? How often did this happen? Is there a seasonal fluctuation in cash flow that causes “low tide” for cash, or are the cash-out days due to running the business with too little cash?
- Are there any limitations on the uses of cash imposed by loan covenants by the company’s lenders? Do any of the loans require compensatory balances that require that the business keep a minimum balance relative to the loan balance? In this situation, the cash balance isn’t fully available for general operating purposes.
- Are there any out-of-the-ordinary demands on cash? For example, a business may have entered into buyout agreements with a key shareholder or with a vendor to escape the terms of an unfavorable contract. Any looming demands on cash should be reported to managers.
Accounts receivable
A business that makes sales on credit has the accounts receivable asset — unless it has collected all its customers’ receivables by the end of the period, which isn’t very likely. To be more correct, the business has hundreds or thousands of individual accounts receivable from its credit customers. In its external balance sheet, a business reports just one summary amount for all its accounts receivable. However, this total amount isn’t nearly enough information for the business manager.
Here are some key questions a manager should ask about accounts receivable:
- Of the total amount of accounts receivable, how much is current (within the normal credit terms offered to customers), slightly past due, and seriously past due? A past-due receivable causes a delay in cash flow and increases the risk of its becoming a bad debt (a receivable that ends up being partially or wholly uncollectible).
- Has an adequate amount been recorded for bad debts? Is the company’s method for determining its bad debts expense consistent year to year? Was the estimate of bad debts this period tweaked in order to boost or dampen profit for the period? Has the IRS raised any questions about the company’s method for writing off bad debts? (Chapter 8 discusses bad debts expense.)
Who owes the most money to the business? (The manager should receive a schedule of customers that shows this information.) Which customers are the slowest payers? Do the sales prices to these customers take into account that they typically don’t pay on time?
It’s also useful to know which customers pay quickly to take advantage of prompt payment discounts. In short, the payment profiles of credit customers are important information for managers.- Are there “stray” receivables buried in the accounts receivable total? A business may loan money to its managers and employees or to other businesses. There may be good business reasons for such loans. In any case, these receivables shouldn’t be included with accounts receivable, which should be reserved for receivables from credit sales to customers. Other receivables should be listed in a separate schedule.
Inventory
For businesses that sell products, inventory is typically a major asset. It’s also typically the most problematic asset from both the management and accounting points of view. First off, the manager should understand the accounting method being used to determine the cost of inventory and the cost of goods sold expense. (You may want to quickly review the section in Chapter 8 that covers this topic.) In particular, the manager should have a good feel regarding whether the accounting method results in conservative or liberal profit measures.
Managers should ask these questions regarding inventory:
- How long, on average, do products remain in storage before they’re sold? The manager should receive a turnover analysis of inventory that clearly exposes the holding periods of products. Slow-moving products cause nothing but problems. The manager should ferret out products that have been held in inventory too long. The cost of these sluggish products may have to be written down or written off, and the manager has to authorize these accounting entries. The manager should review the sales demand for slow-moving products, of course.
- If the business uses the LIFO method (last-in, first-out), was there a LIFO liquidation gain during the period that caused an artificial and one-time boost in profit for the year? (I explain this aspect of the LIFO method in Chapter 8.)
The manager should also request these reports:
- Inventory reports that include a side-by-side comparison of the costs and the sales prices of products (or at least the major products sold by the business): It’s helpful to include the mark-up percent for each product, which allows the manager to compare mark-up percent differences from product to product.
- Regular reports summarizing major product cost changes during the period and forecasts of near-term changes: It may be useful to report the current replacement cost of inventory, assuming it’s feasible to determine this amount.
Prepaid expenses
Generally, the business manager doesn’t need much additional information on this asset. However, there may be a major decrease or increase in this asset from a year ago that isn’t consistent with the growth or decline in sales from year to year. For example, in Figure 11-1, notice that this asset account increased $275,000 during the year, which is a relatively large percent of the beginning balance in the account ($275,000 increase ÷ $685,000 beginning balance = 40% jump during the year). The manager should pay attention to any abnormal change in the asset. Perhaps a new type of cost has to be prepaid now, such as insurance coverage for employee safety triggered by an OSHA audit of the employee working conditions in the business. A brief schedule of the major types of prepaid expenses is useful.
Fixed assets less accumulated depreciation
Fixed assets is the all-inclusive term for the wide range of long-term operating assets used by a business — from buildings and heavy machinery to office furniture. Except for the cost of land, the cost of a fixed asset is spread over its estimated useful life to the business; the amount allocated to each period is called depreciation expense. The manager should know the company’s accounting policy regarding which fixed assets are capitalized (the cost is recorded in a fixed asset account) and which are expensed immediately (the cost is recorded entirely to expense at the time of purchase).
Under the current Internal Revenue Code, up to $500,000 of costs each year that theoretically should be capitalized and depreciated can be charged immediately to depreciation expense. The manager should know whether the business took an abnormally large hit against earnings this year due to the immediate expensing of such costs.
Most businesses adopt a cost limit below which minor fixed assets (a screwdriver, stapler, or wastebasket, for example) are recorded to expense instead of being depreciated over some number of years. The controller should alert the manager if an unusually high amount of these small-cost fixed assets was charged off to expense during the year, which could have a significant impact on the bottom line.
The manager should be aware of the general accounting policies of the business regarding estimating useful lives of fixed assets and whether the straight-line or accelerated methods of allocation are used. Indeed, the manager should have a major voice in deciding these policies and not simply defer to the controller. In Chapter 8, I explain these accounting issues.
Using accelerated depreciation methods may result in certain fixed assets that are fully depreciated but are still in active use. These assets should be reported to the manager — even though they have a zero book value — so the manager is aware that these fixed assets are still being used but no depreciation expense is being recorded for their use.
Generally, the manager doesn’t need to know the current replacement costs of all fixed assets — just those that will be replaced in the near future. At the same time, it’s useful for the manager to get a status report on the company’s fixed assets, which takes more of an engineering approach than an accounting approach. The status report includes information on the capacity, operating efficiency, and projected remaining life of each major fixed asset. The status report should include leased assets that aren’t owned by the business and therefore aren’t included in the fixed asset account.
The manager needs an insurance summary report for all fixed assets that are (or should be) insured for fire and other casualty losses; this report lists the types of coverage on each major fixed asset, deductibles, claims during the year, and so on. Also, the manager needs a list of the various liability risks of owning and using the fixed assets. The manager has to decide whether the risks should be insured.
Intangible assets
The balance sheet in Figure 11-1 reveals that the company has more than $5 million invested in intangible assets. Intangible assets can include a wide variety of things. The cost of acquiring the legal rights for using a patent or trademark could be in this asset account. Perhaps the business bought out another business and paid more than the current market values of identifiable assets being acquired — the extra amount being for the goodwill of the business acquired. The cost of the goodwill is recorded in the intangible assets account.
Accounting for these types of assets is tricky, if you don’t mind my saying so. In any case, the costs that are recorded in the intangible assets account should be justified on the grounds that the costs will provide profit one way or another. The business should be better off owning the intangible asset versus not owning it.
After acquiring intangible assets, the business should regularly take a hard look at the items making up the balance in its intangible assets account to test whether the items continue to have value to the business or perhaps have deteriorated in terms of their profit payoff. The accountants refer to this as testing for the possible impairment of value of intangible assets. The appropriate managers — most likely including marketing managers — should receive reports about each component of the balance of the intangible assets account. Managers, in most cases, are the ones to initiate a hard look at whether there’s been impairment of one or more of the intangible assets of the business.
Instead of the impairment testing approach, a private business has the option to adopt a period of years over which the cost of intangibles is charged to amortization expense. Clearly, managers should know which method the business is using.
Last, I should mention that the IRS rules can get very complicated in the matter of intangible costs. It’s best to stay on the right side of the IRS.
Accounts payable
As you know, individuals have credit scores that affect their ability to borrow money and the interest rates they have to pay. Likewise, businesses have credit scores. If a business has a really bad credit rating or reputation, it may not be able to buy on credit and may have to pay steep interest rates. I don’t have space here to go into the details of how credit ratings are developed for businesses. Suffice it to say that a business should pay its bills on time. If a business consistently pays its accounts payable late, this behavior gets reported to a credit rating agency (such as Dun & Bradstreet).
The manager needs a schedule of accounts payable that are past due (beyond the credit terms given by the vendors and suppliers). Of course, the manager should know why the accounts have become overdue. The manager may have to personally contact these creditors and convince them to continue offering credit to the business.
Frankly, some businesses operate on the principle of paying late. Their standard operating procedure is to pay their accounts payable two, three, or more weeks after the due dates. This could be due to not having adequate cash balances or wanting to hang onto their cash as long as possible. In the past, IBM was notorious for paying late, but because its credit rating was unimpeachable, it got away with this policy.
Accrued expenses payable
The controller should prepare a schedule for the manager that lists the major items making up the balance of the accrued expenses payable liability account. Many operating liabilities accumulate or, as accountants prefer to say, accrue over the course of the year; they aren’t paid until sometime later. One main example is employee vacation and sick pay; an employee may work for almost a year before being entitled to take two weeks’ vacation with pay. The accountant records an expense each payroll period for this employee benefit, and it accumulates in the liability account until the liability is paid (the employee takes his vacation). Another payroll-based expense that accrues is the cost of federal and state unemployment taxes on the employer.
 Accrued expenses payable can be a tricky liability from the accounting point of view. There’s a lot of room for management discretion (or manipulation, depending on how you look at it) regarding which particular operating liabilities to record as expense during the year and which not to record as expense until they’re paid. The basic choice is whether to expense as you go or expense later. If you decide to record the expense as you go through the year, the accountant has to make estimates and assumptions, which are subject to error. Then there’s the question of expediency. Employee vacation and sick pay may seem to be obvious expenses to accrue, but in fact many businesses don’t accrue the expense on the grounds that it’s simply too time-consuming and that some employees quit and forfeit the rights to their vacations.
Many businesses guarantee the products they sell for a certain period of time, such as 90 days or one year. The customer has the right to return the product for repair (or replacement) during the guarantee period. For example, when I returned my iPhone for repair, Apple should have already recorded in a liability account the estimated cost of repairing iPhones that are returned after the point of sale. Businesses have more “creeping” liabilities than you might imagine. With a little work, I could list 20 or 30 of them, but I’ll spare you the details. My point is that the manager should know what’s in the accrued expenses payable liability account and what isn’t. Also, the manager should have a good fix on when these liabilities will be paid.
Income tax payable
It takes an income tax professional to comply with federal and state income tax laws on a business. The manager should make certain that the accountant responsible for its tax returns is qualified and up-to-date.
The controller should explain to the manager the reasons for a relatively large balance in this liability account at the end of the year. In a normal situation, a business should have paid 90 percent or more of its annual income tax by the end of the year. However, there are legitimate reasons that the ending balance of the income tax liability could be relatively large compared with the annual income tax expense — say, 20 or 30 percent of the annual expense. It behooves the manager to know the reasons for a large ending balance in the income tax liability. The controller should report these reasons to the chief financial officer and perhaps the treasurer of the business.
The manager should also know how the business stands with the IRS and whether the IRS has raised objections to the business’s tax returns. The business may be in the middle of legal proceedings with the IRS, which the manager should be briefed on, of course. The CEO (and perhaps other top-level managers) should be given a frank appraisal of how things may turn out and whether the business is facing any additional tax payments and penalties. Needless to say, this is very sensitive information, and the controller may prefer that none of it be documented in a written report.
Finally, the chief executive officer working closely with the controller should decide how aggressive to be on income tax issues and alternatives. Keep in mind that tax avoidance is legal, but tax evasion is illegal. As you probably know, the income tax law is exceedingly complex, but ignorance of the law is no excuse. The controller should make abundantly clear to the manager whether the business is walking on thin ice in its income tax returns.
Interest-bearing debt
In Figure 11-1, the balance sheet reports two interest-bearing liabilities: one for short-term debts (those due in one year or less) and one for long-term debt. The reason is that financial reporting standards require that external balance sheets report the amount of current liabilities so the reader can compare this amount of short-term liabilities to the total of current assets (cash and assets that will be converted into cash in the short term). Interest-bearing debt that is due in one year or less is included in the current liabilities section of the balance sheet. (See Chapter 6 for details.)
The ending balances of short-term and long-term debt that are reported in the external balance sheet aren’t nearly enough information for the manager. The best practice is to lay out in one comprehensive schedule for the manager all the interest-bearing obligations of the business. The obligations should be organized according to their due (maturity) dates, and the schedule should include other relevant information, such as the lender, the interest rate on each debt, the plans to roll over the debt (or not), the collateral, and the main covenants and restrictions on the business imposed by the lender.
Recall that debt is one of the two sources of capital to a business (the other being owners’ equity, which I get to next). The sustainability of a business depends on the sustainability of its sources of capital. The more a business depends on debt capital, the more important it is to manage its debt well and maintain excellent relations with its lenders.
Raising and using debt and equity capital, referred to as financial management or corporate finance, is a broad subject that extends beyond the scope of this book. For more information, look at Small Business Financial Management Kit For Dummies (Wiley) — coauthored by my son, Tage, and me; it explains the financial management function in more detail.
Owners’ equity
External balance sheets report two kinds of ownership accounts: one for capital invested by the owners in the business and one for retained earnings (profit that hasn’t been distributed to shareowners). In Figure 11-1, just one invested capital account is shown in the owners’ equity section, as if the business had only one class of owners’ equity. In fact, business corporations, limited liability companies, partnerships, and other types of business legal entities can have complex ownership structures. The owners’ equity sections in their balance sheets may report several invested capital accounts — one for each class of ownership interest in the business.
Broadly speaking, the manager faces three basic issues regarding the owners’ equity of the business:
- Is more capital needed from the owners?
- Should some capital be returned to the owners?
- Can and should the business make a cash distribution from profit to the owners and, if so, how much?
These questions belong in the field of financial management and extend beyond the scope of this book. However, I should mention that the external financial statements are very useful in deciding these key financial management issues. For example, the manager needs to know how much total capital is needed to support the sales level of the business. For every $100 of sales revenue, how much total assets does the business need? The asset turnover ratio equals annual sales revenue divided by total assets. This ratio provides a good touchstone for the amount of capital being used for sales.
The external financial report of a business doesn’t divulge the individual shareowners of the business and the number of shares each person or institution owns. The manager may want to know this information. Any major change in the ownership of the business usually is important information to the manager.
Culling Profit Information
The sales revenue (and other income, if any) and expenses (and losses, if any) of a business over a period of time are summarized in its income statement. Profit (sales revenue minus expenses) is the bottom line of the external income statement. Chapter 5 explains the externally reported income statement as well as how sales revenue and expenses are interconnected with the operating assets and liabilities of the business. The income statement fits hand in glove with the balance sheet.
Presenting an income statement for managers
Figure 11-2 presents the most recent annual income statement of the business whose balance sheet is shown in Figure 11-1. The two financial statements go together, of course. Remember: The income statement in Figure 11-2 is prepared according to generally accepted accounting principles (GAAP) that have been established for external financial reporting. No EPS (earnings per share) is reported because the business is a private company.
In Figure 11-2, I’ve made one significant modification to the standard external income statement. I added a line for cash flow from operating activities, or cash flow from profit, as I prefer to call it. So you see two “bottom lines”:
- Net income based on the accrual-basis accounting methods for recording revenue and expenses during the period, according to GAAP
- Cash flow from the profit-making (operating) activities for the period
Why two bottom lines? Not only do business managers have to make profit, but they also have to convert that profit into cash flow as soon as possible.
Managers should track cash flow as well as their profit performance. It’s dangerous to simply assume that if profit is okay, then cash flow is okay. As Chapter 7 explains, cash flow deviates from profit, possibly by quite a bit. In reporting profit performance to managers, I think it’s a good idea to keep accrual-basis profit and the cash flow from profit side by side in the income statement to managers, as in Figure 11-2.
Calculating cash flow on the back of an envelope
In the income statement (Figure 11-2), notice that cash flow from profit (operating activities) is higher than profit for the year: $3,105,000 cash flow - $2,642,000 net income = $463,000 higher cash flow. This difference, which is fairly significant, deserves an explanation.
When it comes to explaining the difference between profit (net income) and cash flow, I think accountants do a lousy job, as I argue in Chapter 7. For one thing, cash flow from profit (operating activities) is reported in a separate financial statement — the statement of cash flows — instead of being placed next to net income in the income statement. Furthermore, accountants present a complicated schedule that shows how they determined cash flow instead of explaining the difference in a brief summary.
I suggest that managers get in the habit of doing a quick calculation of cash flow, one they could do on the back of an envelope. Doing such a calculation would reinforce the manager’s understanding of and comfort level with cash flow.
Why is cash flow $463,000 higher than profit for the year? The sidebar “Cash flow characteristics of sales and expenses” offers a short review of the differences between accrual-basis profit accounting and cash flow from revenue and for expenses. The numbers in the following calculation come from the balance sheet (Figure 11-1) and income statement (Figure 11-2).
In our business example, the difference between net income and cash flow can be summarized as follows:
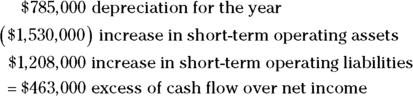
The $785,000 depreciation recorded for the year is not a cash outlay; indeed, it’s just the opposite. The amount of deprecation has been recovered through sales revenue cash flow and thus is a positive cash flow factor. Accounts receivable, inventory, and prepaid expenses all increase during the year. These asset increases have the effect of decreasing cash flow from profit; the total of these three negative factors is $1,530,000. Accounts payable, accrued expenses payable, and income tax payable all increase during the year; the total of these three positive factors is $1,208,000. Adding the three lines gives you the $463,000 cash overflow.
You may automatically think that it’s good that cash flow is more than profit. Well, not so fast. There are many aspects to cash flow, and in some situations, a cash flow lower than profit is just what the doctor ordered.
Managing operating cash flows
In a small, one-owner/one-manager business, one person has to manage both profit and cash flow from profit. In larger businesses, managers who have profit responsibility may or may not have cash flow responsibility. The profit manager may ignore the cash flow aspects of his or her sales and expense activities. The responsibility for controlling cash flow falls on some other manager. Of course, someone should manage the cash flows of sales and expenses.
As the calculation in the preceding section shows, the net cash flow during the period from carrying on profit-making operations depends on the changes in the operating assets and liabilities directly connected with sales revenue and expenses. Changes in these accounts during the year determine the cash flow from operating activities. In other words, changes in these accounts boost or crimp cash flow. One or more managers should closely monitor the changes in operating assets and liabilities. Controlling cash flow from profit (operating activities) means controlling changes in the operating assets and liabilities of making sales and incurring expenses — there’s no getting around this fact of business life.
A good general rule is that each operating asset and liability should change about the same percent as the percent change in the sales activity of the business. If sales revenue increases, say, 10 percent, then operating assets and liabilities should increase about 10 percent. The percents of increase in the operating assets and liabilities (in particular, accounts receivable, inventory, accounts payable, and accrued expenses payable) should be emphasized in the cash flow report to the manager.
Scrutinizing sales revenue and expenses
In this section, I offer examples of sales revenue and expense information that managers need but that isn’t reported in the external income statement of a business. Given the broad range of different businesses and different circumstances, I can’t offer extensive details — just common examples.
Here’s a sampling of the kinds of accounting information that business managers need either in their internal income statements (P&L reports) or in supplementary schedules and analyses:
- Sales volumes (quantities sold) for all sources of sales revenue
- List sales prices and discounts, allowances, and rebates against list sales prices; for many businesses, sales pricing is a two-sided affair that starts with list prices (such as the manufacturer’s suggested retail price) and includes deductions of all sorts from the list prices
- Sales returns — products that were bought but later returned by customers
- Special incentives offered by suppliers that effectively reduce the purchase cost of products
- Abnormal charges for embezzlement and pilferage losses
- Significant variations in discretionary expenses from year to year, such as repair and maintenance, employee training costs, and advertising
- Illegal payments to secure business, including bribes, kickbacks, and other under-the-table payments
Keep in mind that businesses aren’t willing to admit to making such payments, much less report them in internal communications. Therefore, the manager should know how these payments are disguised in the accounts of the business.
- Sales revenue and margin for new products
- Significant changes in fixed costs and reasons for the changes
- Expenses that surged much more than increases in sales volume or sales revenue
- New expenses that show up for the first time
- Accounting changes (if any) regarding when sales revenue and expenses are recorded
This list isn’t exhaustive, but it covers many important types of information that managers need in order to interpret their P&L reports and to plan profit improvements in the future. Analyzing profit is a very open-ended process. There are many ways to slice and dice sales and expense data. Managers have only so much time at their disposal, but they should take the time to understand and analyze the main factors that drive profit.
Digging deeper into ROE (return on equity)
Now here’s a question that may strike you as rather odd: What is the specific profit motive of the business? For large public companies, it’s abundantly clear that their main profit attention is on earnings per share (EPS). (I explain EPS in Chapter 10.) Of course, the company has to earn enough total net income and control the total number of its stock shares in order to hit its EPS targets. The profit objective of public businesses centers on EPS, because EPS plays such a dominant role in determining the market value of stock shares.
In contrast, the specific profit focus of a private business is not EPS but … well, but what? The main objective could be simply the bottom line, which is total net income. A private business may also put heavy importance on its return on equity (ROE), which is the measure of profit compared with the equity capital being used to earn that profit. (I introduce ROE in Chapter 10.) For example, Warren Buffett, CEO of Berkshire Hathaway, stresses ROE in his annual letter to stockholders.
Return on equity (ROE) is computed as follows for the most recent year of our business example (see Figures 11-1 and 11-2 for data; dollar amounts are in thousands):
The calculation of ROE is expanded in the so-called DuPont model, which has its origins years ago in the company of the same name. The DuPont model computes return on equity (ROE) in three parts, as follows:
The three ratios in this equation are applied as follows for our business example:
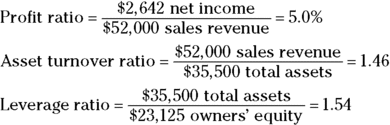
In other words, the business earned 5.0 percent profit on its sales, its sales were 1.46 times its total assets (total capital used to generate the sales), and it had assets equal to 1.54 times its owners’ equity. Multiplying the three factors gives you the following:
Whether a 10.4% ROE is acceptable or not is up to the owners and management to decide. If not, then the managers need to prepare a plan for improving ROE. The three-factor DuPont method is a useful starting point.