
Analyzing bond characteristics between composites and quasi-brittle substrates in the repair of bridges and other concrete structures
C. Carloni, University of Hartford, USA
Abstract:
During the last two decades, externally bonded fiber-reinforced polymer (FRP) composites have been widely used for strengthening, repairing, and rehabilitating reinforced concrete (RC) structural members. The bond characteristics contribute to the effectiveness of the stress transfer achieved between the FRP composite and the concrete substrate. Debonding of the FRP composite reinforcement is the most critical concern in this type of application. Under monotonic and fatigue-loading conditions, FRP–concrete shear debonding has been idealized as a Mode-II fracture problem along the bi-material interface. A cohesive material law is used to describe the interfacial stress transfer at the macroscopic level. The area under the entire curve represents the fracture energy, and is related to the load-carrying capacity of the interface. In this chapter, previous experimental results published by the author are discussed to show how the fracture energy can be considered a true fracture parameter. The results are instrumental in discussing the strain limits provided in international codes and guidelines. Future research needed and newly developed composites are introduced at the end of the chapter.
Key words
fiber-reinforced polymer (FRP); concrete; fracture energy; debonding; Mode-II; strain limit; interfacial crack propagation
3.1 Introduction
The increasing use of fiber-reinforced polymer (FRP) composites for strengthening and repairing existing reinforced concrete (RC) structures has promoted a remarkable research interest over the last two decades (Bank, 2006). When applied to the tension side of a beam, the FRP composite laminate/sheet increases the internal moment capacity of the strengthened section. Similarly, when attached to the web of a beam in the high-shear region, the FRP composite contributes to the nominal shear capacity of the section. Particular attention was paid to the study of the debonding mechanism in beams retrofitted with FRP laminates/sheets (Buyukozturk and Hearing, 1998; Teng et al., 2003). In fact, debonding is one of the most important causes of inefficiency, and certainly one of the most dangerous because it is a brittle phenomenon (Arduini et al., 1997), which might occur with no visible warning at a load level significantly lower than the flexural or shear capacity of the strengthened member corresponding to the rupture of the FRP reinforcement.
Debonding in beams takes place in regions of high-stress concentration (Wu et al., 1997; Leung, 2001). With respect to flexural FRP reinforcement, two different types of debonding are considered. (1) End plate debonding (EPD), which occurs at the curtailment of the FRP composite and typically involves the concrete cover, although it can also propagate at the FRP–concrete interface. EPD is also termed cover delamination (ACI 440.2R-08, 2008); EPD could be prevented by providing anchorages at the ends of the FRP reinforcement, for example in the form of FRP stirrups (Chen and Teng, 2003). (2) Intermediate crack-induced debonding (ICD), which initiates at flexural or flexural/shear cracks near the region of maximum moment and propagates in the direction of decreasing moment; ICD typically occurs in a thin mortar-rich layer of concrete (Carloni and Subramaniam, 2010), where the epoxy impregnates the substrate, and does not propagate into the concrete cover.
This chapter will focus on ICD, although some results and observations can be applied to EPD. Moreover, some of the concepts herein presented are applicable to the debonding of FRP laminates/sheets applied to the web of a beam as external stirrups. For flexural reinforcement, guidelines and codes adopted in different countries limit the value of the effective strain in the FRP composite in order to impede the onset of ICD. However, in this chapter the cohesive nature of the debonding mechanism will be discussed, and it will be observed how some assumptions, which are commonly accepted in the design of the FRP reinforcement, require additional investigation and discussion.
In this chapter, there will be a brief discussion of newly-developed fiber-reinforced cementitious matrix (FRCM) composites. FRCMs employ a cement-based matrix instead of epoxy. FRCM composites have some potential advantages when compared to FRPs: (1) resistance to high temperatures and UV radiation; (2) the inorganic matrix is water-based, which facilitates its application and allows for reuse of tools; (3) permeability compatibility with the concrete substrate; and (4) unvarying workability time with temperature between 4°C and 40°C.
3.2 Experimental investigation of debonding
Full-scale beam tests were, and still are, the optimal tests (Sebastian, 2001; Rosenboom and Rizkalla, 2008) to investigate the characteristic of the FRP–concrete bond. However, the high cost of the set-up and the complexity of the flexural behavior of a RC strengthened beam, which includes load sharing between internal steel reinforcement and external FRP laminates/sheets, in addition to the quasi-brittle behavior of concrete, and the subsequent formation of a not easily predicted crack pattern, have induced several research groups to develop an ad hoc set-up to investigate the FRP–concrete debonding. Ritchie et al. (1991), Sharif et al. (1994), and Arduini et al. (1997) were among the first experimental studies to focus on the debonding phenomenon in beams, whereas Chajes et al. (1996), Taljsten (1997), and Bizindavyi and Neal (1999) were among the first researchers to use a single-lap shear test set-up to study the stress transfer between FRP and concrete. A literature review on FRP–concrete debonding can be found in Hearing (2000), Buyukozturk et al. (2004), Gunes (2004), Han (2009), Grace et al. (2012), and Kang et al. (2012). Chen and Teng (2001) and Yao et al. (2005) described in their work the most common direct-shear set-ups proposed in the literature, which are still used although it should be pointed out that some of those set-ups have gained more popularity than others in the last decade, and some others have been proposed or adjusted from the original ones (Mohamed Ali et al., 2008; Gartner et al., 2011). Researchers are still debating the differences among the set-ups in order to identify which one(s) are capable of capturing the debonding phenomenon in beams. It is recognized that among the different set-ups, the single-lap and the double-lap shear test set-ups capture the debonding phenomenon better.
3.2.1 Single-lap direct-shear tests
In order to foster the discussion on the quasi-brittle nature of the debonding mechanism, comment on the strain limits provided in guidelines and codes, and eventually highlight the need for future research, in this section part of the previous experimental work conducted by the author in collaboration with Prof. Kolluru V. Subramaniam (Indian Institute of Technology, Hyderabad, India) will be briefly revisited (Subramaniam et al., 2007). Single-lap direct-shear tests were used to evaluate the FRP–concrete debonding using the classical pull–push configuration. The tensile load was applied to the FRP sheet, while the concrete block was restrained against movement. This set-up is also referred to as the near-end supported single-shear test (Yao et al., 2005).
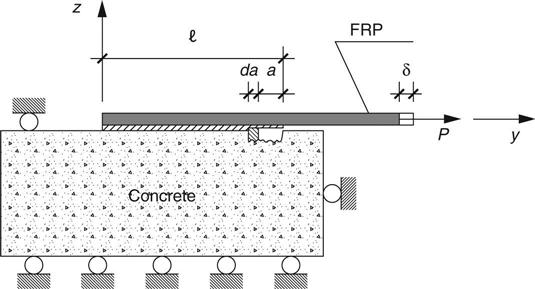
Figure 3.1 shows the specimen dimensions and the loading arrangement (Carloni and Subramaniam, 2012b). The nominal dimensions of the prismatic concrete block were as follows: length L = 330 mm, width b = 125 mm, height h = 125 mm. The coarse aggregates consisted of gravel with a maximum size of 10 mm. River sand was used as fine aggregate. The 28-day compressive strength of concrete, determined as per ASTM C 39 (2011), was 39 MPa. The nominal thickness tf of the carbon fibers contained in the FRP composite sheet was equal to 0.167 mm. The tensile strength and the Young’s modulus Ef of the composite sheet based on the fiber thickness were equal to 3.83 and 230 GPa, respectively. The FRP sheet was bonded in the center on one side of the concrete block using the wet-layup procedure. The bonded length ![]() of the sheet was kept fixed at 152 mm for all specimens. A length (n) of the FRP equal to 35 mm was left unbonded to provide an initial notch. Different nominal widths, bf, of the FRP sheet equal to 12, 19, 25, 38, and 46 mm were tested. Two linear variable differential transducers (LVDTs) were mounted on the concrete surface close to the edge of the bonded area. The LVDTs reacted off of a thin aluminum Ω-shaped plate, which was glued to the FRP surface at the beginning of the bonded area as shown in Fig. 3.1. The average of the two LVDT readings was named global slip. Tests were conducted in displacement control by increasing the global slip at a constant rate equal to 0.00065 mm/s, up to failure. The modality of failure of all direct-shear test specimens was associated with progressive debonding of the FRP sheet from the concrete substrate.
of the sheet was kept fixed at 152 mm for all specimens. A length (n) of the FRP equal to 35 mm was left unbonded to provide an initial notch. Different nominal widths, bf, of the FRP sheet equal to 12, 19, 25, 38, and 46 mm were tested. Two linear variable differential transducers (LVDTs) were mounted on the concrete surface close to the edge of the bonded area. The LVDTs reacted off of a thin aluminum Ω-shaped plate, which was glued to the FRP surface at the beginning of the bonded area as shown in Fig. 3.1. The average of the two LVDT readings was named global slip. Tests were conducted in displacement control by increasing the global slip at a constant rate equal to 0.00065 mm/s, up to failure. The modality of failure of all direct-shear test specimens was associated with progressive debonding of the FRP sheet from the concrete substrate.
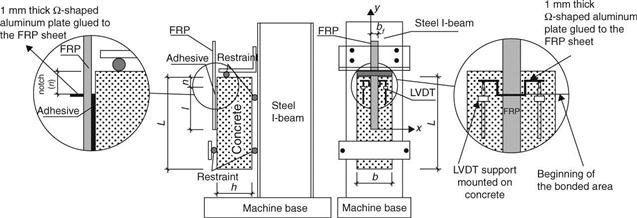
The strain components on the surface of the FRP and surrounding concrete during the monotonic quasi-static tests were determined from the displacement field, which was measured using a full-field optical technique known as digital image correlation (DIC). Details about DIC can be found in Sutton et al. (1983, 2009). The strain analysis reported in the next section refers to the Cartesian system shown in Fig. 3.1.
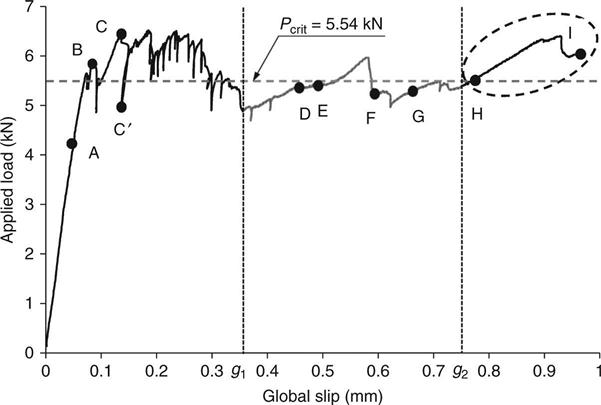
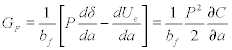
Figure 3.2 shows a typical load vs global slip response obtained from a direct-shear test. The load response of Fig. 3.2 corresponds to test W_6 (bf = 25 mm) reported in Subramaniam et al. (2007). The load responses obtained from specimens with different FRP widths were nominally similar in shape. Additional tests were published by the same authors (Subramaniam et al., 2011) using the same test set-up and concrete blocks with a different width (b = 52 mm) and height (h = 100 mm). The load responses of those specimens were also similar in shape. The load response was initially linear up to point A. A nonlinear behavior was observed in the region AC. The strain analysis, presented in the next section, showed that the interfacial crack initiated in the nonlinear part AC of the load response (Ali-Ahmad et al., 2006; Subramaniam et al., 2007, 2011. The difference between crack initiation and crack propagation in a strengthened beam is outlined in Sebastian (2001). A sudden drop (CC’) in the load marked the onset of the interfacial crack propagation. Load drops before point C (for example at point B) indicated that the debonding process initiated. As the crack propagated (after C), the load remained nominally constant and its value Pcrit was determined as the mean value of the load corresponding to the range of the global slip (g1 = 0.35 mm, g2 = 0.75 mm). The global slip range (g1, g2) slightly varied for each test and was identified on the basis of the strain analysis results that will be presented in the next section. The load response between points H and I will be justified by the strain analysis that follows. The load Pcrit is often termed load-carrying capacity or bond strength. Bond strength is probably used improperly in this context, because strength is usually associated with a stress component rather than a load, which depends on the size of the specimen.
To provide a rational basis for comparison, the load-carrying capacity was expressed in terms of the ultimate nominal stress (σcrit) in the FRP at debonding:
[3.1]
The variation of σcrit with the ratio bf/b is reported in Subramaniam et al. (2007). σcrit increased linearly with the ratio bf/b, suggesting the existence of a width effect. This relationship appeared to be independent of the width of the concrete block (Subramaniam et al., 2011). In Subramaniam et al. (2007), it was found that the specimens with bf = 12 mm exhibited significant scatter and provided results that did not agree with the trend. The reason for the nonconformity of the bf = 12 mm specimens became clear with the results of the strain analysis.
3.2.2 Strain analysis in direct-shear tests
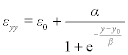
Figure 3.3 shows the variation of the axial strain εyy on the surface of the FRP along the bonded length for point E of the load response of Fig. 3.2. The axial strain distribution along the FRP obtained from all specimens tested was nominally similar. The experimental strain values are represented by ‘×’s. The axial strain values were determined along the center line of the FRP sheet by averaging the strain across a 10-mm-wide strip for each value of y. Averaging the strain across a 10 mm width allows for taking into account the variation of the strain due to the presence of a non-homogeneous substrate and local material variations in the FRP sheet (Ali-Ahmad et al., 2006). A 10-mm strip was chosen based on the size of the aggregate. It can be noticed that at y = 116 mm the axial strain has a relative maximum. The axial strain along the FRP at point E was approximated using the procedure outlined in Ali-Ahmad et al. (2006). The experimental nonlinear strain distribution along the bonded length of Fig. 3.3 was approximated using the following expression (solid line in Fig. 3.3):
[3.2]
 [3.2]
[3.2]
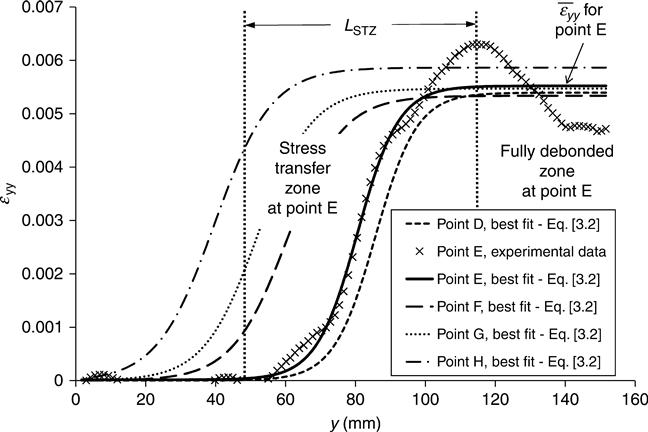
where α, β, y0, and ε0 were determined using nonlinear regression analysis of the strains obtained from DIC. The choice of the function [3.2] is not unique (Dai et al., 2005; 2006; Zhou et al., 2010; Liu and Wu, 2012) and its influence on the results presented in the next section was not investigated in the study. The observed strain distribution along the FRP was essentially equal to zero close to the unloaded end. There was a rapid increase in strain upon approaching the loaded end. The strain leveled off at a value ![]() approximately equal to 5520 με. The observed strain distribution was divided into three main regions: (1) the stress-free zone (SFZ); (2) the stress-transfer zone (STZ); and (3) the fully-debonded zone (FDZ). In the FDZ, the strains were essentially constant and were found to remain unchanged as the global slip increased, which is consistent with the observation that the load remained nominally constant (Pcrit) after the debonding process propagated. Analysis of the strain data revealed that the STZ was fully established when the load response attained Pcrit. In other words, the ‘S’ shape of the strain profile was fully established for points of the load response after C. For each test, the global slip range (g1, g2) within which the STZ was fully established was determined and used to compute the load-carrying capacity Pcrit. The fitting curves, obtained using Equation [3.2], for points D, F, G, and H, are shown in Fig. 3.3 for comparison. It can be observed that a simple translation of the STZ further along the length of the FRP sheet occurred as the global slip increased while its shape remained constant. The translation of the STZ indicated self-similar crack growth.
approximately equal to 5520 με. The observed strain distribution was divided into three main regions: (1) the stress-free zone (SFZ); (2) the stress-transfer zone (STZ); and (3) the fully-debonded zone (FDZ). In the FDZ, the strains were essentially constant and were found to remain unchanged as the global slip increased, which is consistent with the observation that the load remained nominally constant (Pcrit) after the debonding process propagated. Analysis of the strain data revealed that the STZ was fully established when the load response attained Pcrit. In other words, the ‘S’ shape of the strain profile was fully established for points of the load response after C. For each test, the global slip range (g1, g2) within which the STZ was fully established was determined and used to compute the load-carrying capacity Pcrit. The fitting curves, obtained using Equation [3.2], for points D, F, G, and H, are shown in Fig. 3.3 for comparison. It can be observed that a simple translation of the STZ further along the length of the FRP sheet occurred as the global slip increased while its shape remained constant. The translation of the STZ indicated self-similar crack growth.
The STZ at point H reached the end of the bonded length. Any further increment of the global slip corresponded to a different fracture path that involved a larger amount of concrete as the crack kinked in the direction of the concrete block. The portion of the load response H-I in Fig. 3.2 is related to this different behavior of the FRP–concrete interface (Carrara et al., 2011). It is important to notice that the best-fit curve provided a maximum strain ![]() that varied slightly from point to point along the load response. These variations were consistent with the variation of the load. The mean values of the maximum strain
that varied slightly from point to point along the load response. These variations were consistent with the variation of the load. The mean values of the maximum strain ![]() , calculated from ten points of the load response in the range (g1, g2), are shown in Fig. 3.4 and reported in Table 3.1 for all the tests published in Subramaniam et al. (2007). The mean value (5560 με) of test W_6 is shown with a black-filled marker in Fig. 3.4.
, calculated from ten points of the load response in the range (g1, g2), are shown in Fig. 3.4 and reported in Table 3.1 for all the tests published in Subramaniam et al. (2007). The mean value (5560 με) of test W_6 is shown with a black-filled marker in Fig. 3.4.
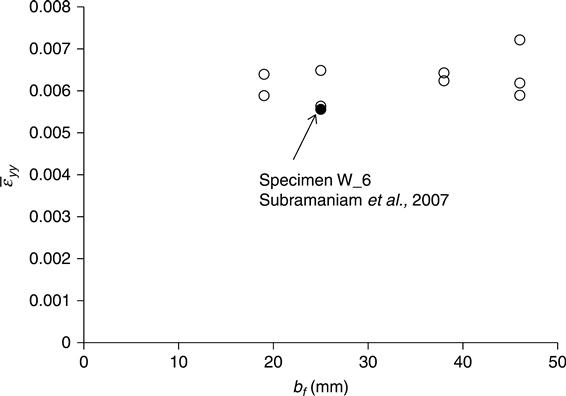
Table 3.1
Fracture parameters of the tests published in Subramaniam et al. (2007)
| Test | bf (mm) | Pcrit (kN) | LSTZ (mm) | GF (MPa × mm) | |
| W_1 | 46 | 12.90 | 80 | 7210 | 0.874 |
| W_2 | 46 | 12.05 | 76 | 6180 | 0.634 |
| W_3 | 46 | 13.20 | 75 | 5890 | 0.563 |
| W_4 | 38 | 10.09 | 81 | 6430 | 0.692 |
| W_5 | 38 | 10.02 | 73 | 6240 | 0.652 |
| W_6 | 25 | 5.54 | 80 | 5560 | 0.546 |
| W_7 | 25 | 5.44 | 76 | 5630 | 0.530 |
| W_8 | 25 | 5.36 | 69 | 6490 | 0.705 |
| W_9 | 19 | 4.27 | 75 | 6400 | 0.686 |
| W_10 | 19 | 4.05 | 78 | 5890 | 0.579 |
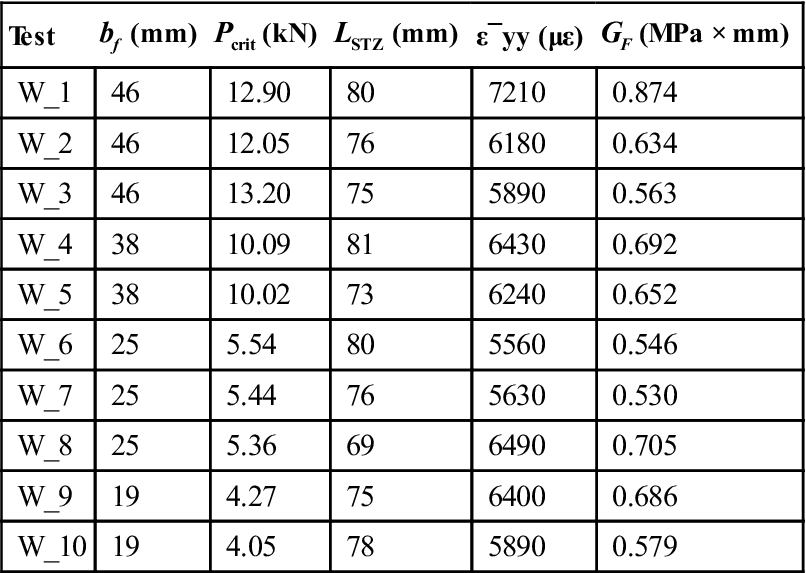
The progressive debonding of the FRP composite sheet from concrete is associated with a STZ of a fixed length LSTZ, which translates as the crack advances (Fig. 3.3). LSTZ is also termed the effective bond length (Chen and Teng, 2001) or the development length (ACI 440.2R-08, 2008). Values of LSTZ are reported in Table 3.1 and summarized in Fig. 3.5. Each value plotted in Fig. 3.5 represents the mean value for each test and was calculated from ten points of the load response within (g1, g2). Some of the proposed formulas for LSTZ (Nuebauer and Rostasy, 1999; Chen and Teng, 2001; Monti et al., 2003; Karbhari et al., 2006) are plotted in Fig. 3.5 for comparison. The experimental values of LSTZ are not affected by the width of the FRP sheet.
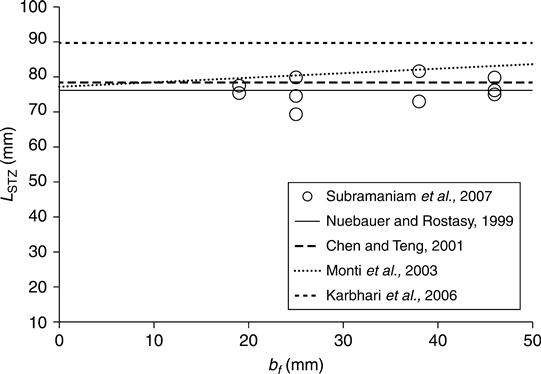
Figure 3.6 shows the variation of the axial strain εyy across the width of the specimen W_6 (Subramaniam et al., 2007) at point E (Fig. 3.2) for different values of y. Figure 3.6 reveals the presence of a central region of the FRP where the axial strain is nominally constant across the width bs is the measurement of the central region of the FRP. The width bd of the concrete strip involved in the stress transfer is larger than the FRP width. Only for those specimens with bf > 12 mm the central region was observed; therefore, it was concluded that specimens with bf = 12 mm did not follow the trend of σcrit vs bf/b due to the absence of the central region. A plot of the strain εyy for a specimen with bf = 12 mm can be found in Subramaniam et al. (2007). The width of the central region of the FRP increased as the FRP width increased, while the quantity (bd − bs) remained constant. Hence, the increase in the nominal stress at debonding with an increase in the FRP width was explained by the increase of the central region. Available results in the literature (Chen and Teng, 2001; Yao et al., 2005) did not confirm the conclusions reported in Subramaniam et al. (2007). Chen and Teng (2001) reported a decrease of the normalized load-carrying capacity with an increase of the FRP-to-concrete width ratio. A coefficient βp that takes into account the effect of the FRP-to-concrete width ratio was proposed by the authors. It should be noticed, however, that the specimens considered by the authors (Chen and Teng, 2001) to validate the model had a minimum FRP width equal to 25.4 mm. Size effect was not considered in their study, and some of the data, obtained from the literature and used to calibrate the model, were from bond tests between steel plates and concrete.
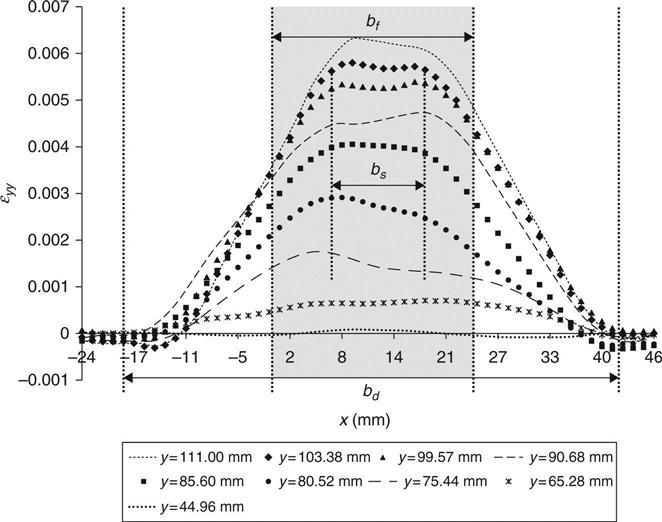
Subramaniam et al. (2007) showed that the plot of the shear strain εxy across the width of the specimen for different values of y also revealed the presence of edge regions in the FRP sheet that were characterized by high-shear strain gradients. The central region in which the axial strain was constant coincided with the central region of the strip where the shear strain was zero.
3.3 Fracture mechanics approach to the analysis of debonding
Fracture propagation during ICD occurs in concrete; therefore, it is reasonable to assume that the quasi-brittle behavior of concrete governs the debonding process. It seems appropriate to model the debonding mechanism within the framework of fracture mechanics applied to quasi-brittle materials (Bazant and Planas, 1997). In linear elastic fracture mechanics (LEFM) it is well known that a singularity in the stress and displacement fields occurs at the crack tip (Anderson, 2004; Bazant and Planas, 1997). In LEFM the nonlinearity of the material is neglected, although in practice only a limit value of the stress can be reached and in a zone near the crack tip a stress re-distribution occurs, which is related to the nonlinearity of the material. The nonlinearity near the crack tip can be due to hardening or softening of the material. In order to overcome the inapplicability of LEFM for quasi-brittle materials such as concrete, the concept of the fracture process zone (FPZ) is introduced. The FPZ represents a bridging zone between the cracked and uncracked regions, where progressive softening occurs. It is important to point out that in quasi-brittle materials the FPZ is most likely coincident with, or close in size to, the region of material nonlinearity. In other materials, such as steel, the softening part of the nonlinear zone is negligible and the nonlinear hardening zone is predominant. The characteristics and size of the FPZ depend on the material. In concrete, the FPZ is related to progressive damage that is associated with several complex phenomena (microcracking, void formation, etc.). As the fracture process progresses in concrete, coalescence of microcracks in the FPZ gives continuity to the already existing crack and consequently the crack propagates.
The concept of cohesive zone or cohesive crack is associated with the work of Hillerborg et al. (1976). The cohesive crack model is a simple model for the FPZ in concrete, and can be taken as a reference to compare other models (Elices et al., 2002). For a Mode-I (Anderson, 2004) condition, it is assumed that within the FPZ a crack tip should not be defined. Conversely, the stress σ transferred through the cohesive crack is a function of the crack opening w. The function σ = f(w) is characteristic of the material and is often called the softening function. When w = 0, σ = ft, which is the tensile strength of concrete.
3.3.1 Cohesive material law
Several researchers attempted to study the ICD phenomenon and the debonding in direct-shear tests as a Mode-II fracture problem (Anderson, 2004) where the interface region is idealized to be of zero thickness with well-defined material properties (Ali-Ahmad et al., 2006; Wu and Niu, 2007; Mazzotti et al., 2008). In this idealization, the interfacial crack, associated with initiation and propagation of debonding, is subject to a Mode-II loading condition. The quasi-brittle behavior of the interfacial crack, in the spirit of the cohesive crack model, is described by introducing a cohesive material law, which relates the interfacial shear stress (τzy) to the relative slip (s) between FRP and concrete. It is important to highlight that the cohesive material law τzy –s represents the constitutive law of a fictitious material that links the FRP strip to the concrete substrate (interface). The shear stress should not be associated with the shear stress that occurs in concrete at a particular distance from the concrete surface. Researchers (Abdel Baky et al., 2012) attempted to describe the variation of the shear stress through the depth of the concrete substrate, and observed that the normal stress σyy in concrete influences the value of the maximum shear stress (τmax). Although it is reasonable to assume that the stress field in concrete near the interface has an important role in the stress transfer, and therefore in the debonding mechanism, the cohesive material law herein introduced aims to describe the interfacial debonding at the macro-scale; hence its parameters should not refer to the actual stress state in concrete at the microscopic level.
Fracture along the interface does not occur on an ideal plane parallel to the FRP strip but follows a tortuous path, which is in part controlled by the distribution of the aggregates and in part by the mixed-mode nature of the fracture process at the microscopic level. In fact, the crack continuously kinks to follow the path that requires the least amount of energy, and is related to the fracture properties of the two materials (Hutchinson and Suo, 1992; Gunes, 2004; Gunes et al., 2009). At the macroscopic level, the microscopic mixed-mode fracture can be considered a Mode-II fracture at the FRP–concrete interface.
Several analytical/numerical procedures to estimate the cohesive interface behavior from the load response of direct-shear tests were developed. For example, Ali-Ahmad et al. (2006) established an experimental procedure to directly determine the Mode-II interfacial fracture law using DIC measurements. The cohesive material law for the interface, when implemented in a numerical analysis procedure, allowed for predicting the load response of concrete beams strengthened with externally bonded FRP sheets (Wu and Yin, 2003; Ali-Ahmad et al., 2007; Wu and Niu, 2007). Among others, Ferracuti et al. (2007), Mazzotti et al. (2008), and Carrara et al. (2011) used a procedure similar to Ali-Ahmad et al. (2006). In those studies, the authors used strain gage readings along the FRP surface to obtain the interfacial law. Pellegrino et al. (2008) and Pellegrino and Modena (2009) used a double-lap shear test and a small-beam test to investigate the effect of the axial stiffness of the composite on the cohesive material law and indicated the need of more research to study this aspect.
From the measured strain εyy along the bonded length, the interface shear stress was calculated as (Taljsten, 1996, 1997):
[3.3]
The following assumptions were made: (1) the FRP sheet was homogenous and linear elastic; (2) the thickness and the width of the FRP sheet were constant along the bonded length; (3) the interface was subject only to shear loading; (4) the interface between the FRP and the concrete was assumed to be of infinitesimal thickness; and (5) the concrete substrate was rigid. The relative slip, s(y), between FRP and concrete at a given location on the FRP was obtained by integrating the axial strain in the FRP up to that point. Lu et al. (2005) commented on the possible ways to obtain the τzy –s curves, observing that the violent local variations of strain measured by strain gages entailed substantial differences in the fracture parameters. The procedure followed by Subramaniam et al. (2007, 2011) used the strain contours obtained from DIC, which allowed to identify the fluctuations of the strain profile due to the local variations of the FRP and the substrate (Ali-Ahmad et al., 2006). The cohesive material law curves corresponding to points D, E, F, and G of the load response of Fig. 3.2 are shown in Fig. 3.7. An important aspect of this procedure should be pointed out. The cohesive material law is a local constitutive law and should be obtained from strain measurements at a specific point along the bonded length for the entire load response and eventually compared with the constitute laws obtained from other points along the bonded area. Conversely, the procedure adopted in Ali-Ahmad et al. (2006) and in Subramaniam et al. (2007) used the strain values along the bonded length. Inherently, points along the bonded length have different interfacial properties, as suggested by the load response depicted in Fig. 3.2.

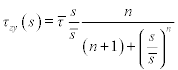
Several expressions of the cohesive material law are available in the literature. For example, Ferracuti et al. (2007) proposed the following relationship:
[3.4]
 [3.4]
[3.4]
where ![]() is the maximum shear stress and
is the maximum shear stress and ![]() is the corresponding slip. Other researchers indicated these parameters as τmax and s0, respectively. The parameter n (>2) mainly governs the softening branch of the softening curve.
is the corresponding slip. Other researchers indicated these parameters as τmax and s0, respectively. The parameter n (>2) mainly governs the softening branch of the softening curve.
3.3.2 Interfacial fracture energy
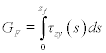
The interfacial fracture energy GF is the energy required to create and fully break the elementary unit area of the cohesive crack. GF corresponds to the area under the entire τzy–s curve (Bazant and Planas, 1997):
[3.5]
 [3.5]
[3.5]
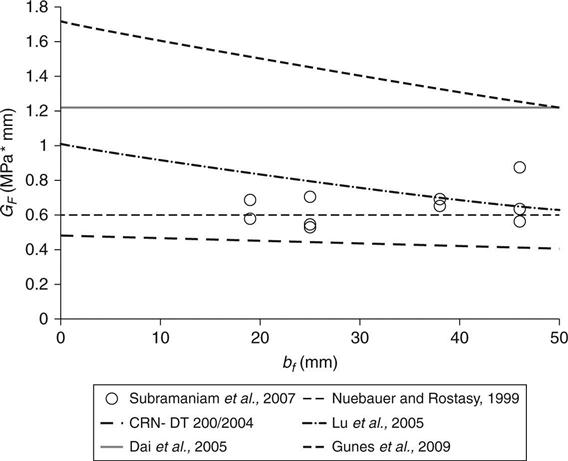
where sf is the slip corresponding to complete separation of the interface. The mean values of GF for all tests published in Subramaniam et al. (2007) are shown in Fig. 3.8 and reported in Table 3.1. The values plotted in Fig. 3.8 were obtained for each test by processing the same ten images corresponding to ten points of the load response used to calculate the values of Figs 3.4 and 3.5. The experimental data in Fig. 3.8 are compared with some of the available formulas in the literature for GF. Some of the formulas used as comparison in Fig. 3.7 include a width effect coefficient that depends on bf/b.
The relationship between the interfacial fracture energy and the fracture energy of concrete (Mode-I) is still an open discussion among researchers (Achintha and Burgoyne, 2008, 2011; Carrara et al., 2011). Although the fracture process in ICD occurs in concrete, it propagates in a mortar-rich thin layer (Carloni and Subramaniam, 2010) in which the mechanical and fracture properties are not easily defined. Undoubtedly, the two fracture energies are related, although a convincing relationship has not yet been found. Rabinovitch (2004) successfully used the Mode-I fracture energy of concrete to study the EPD using the fracture mechanics concept of energy release rate. In the context of EPD, the energy required to create and fully break the elementary unit area of cohesive crack should be closely related to the fracture energy of concrete as the debonding typically occurs in the concrete cover and peeling stresses are not negligible.
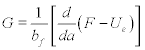
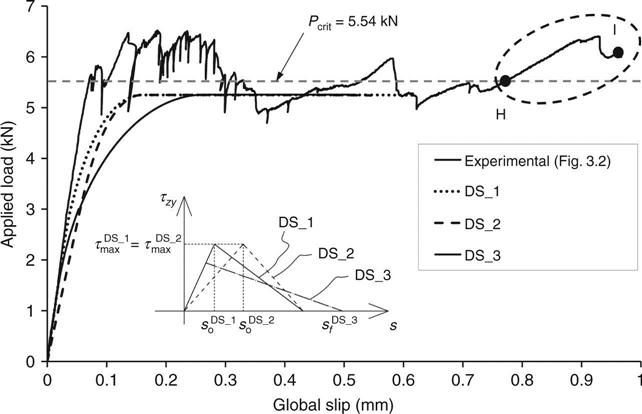
Taljsten (1996) obtained a relationship between the interfacial fracture energy and the load-carrying capacity in direct-shear tests by considering the energy release during the advancement of the interfacial crack a by an amount da (Fig. 3.9). The energy release rate G per unit width bf of the composite is obtained as:
[3.6]
 [3.6]
[3.6]
where F is the work done by the external load P and Ue is the elastic energy. When debonding propagates, G = Gf.
If δ is the displacement of the point of application of the applied force P (Fig. 3.9) and C is the compliance of the system, then:
[3.7]
and when the interfacial crack propagates:
[3.8]
 [3.8]
[3.8]
Therefore:
[3.9]
 [3.9]
[3.9]
If the substrate is considered rigid and the adhesive layer is idealized as a zero-thickness layer:
[3.10]
Ef and tf are the elastic modulus and the thickness of the composite, respectively. From Equations [3.9] and [3.10], the interface fracture energy GF is related to the load-carrying capacity (Hearing, 2000; Yuan et al., 2001; Wu et al., 2002; Liu and Wu, 2012; Wu et al., 2012):
[3.11]
Equation [3.11] can be obtained through an energy balance approach (Focacci et al., 2000; Hearing, 2000; Liu and Wu, 2012) and is based on the assumption that a pure Mode-II interfacial crack propagation occurs across the entire width of the composite. The theoretical load-carrying capacity under pure Mode-II was indicated as Pu in Equation [3.11] to distinguish it from the experimental value Pcrit. Wu et al. (2002) used an equilibrium approach to show how the load-carrying capacity depends only on the fracture energy and not on the shape of the τzy –s curve. An analytical approach can be found in Wu et al. (2012) in which a cohesive material law τzy (s) was assumed. The authors were able to predict the snapback phenomenon observed by other researchers (Ali-Ahmad et al., 2007). The load-carrying capacity calculated from Equation [3.11] should not be expected to match the experimental results (Pu ≠ Pcrit). In fact, the width effect shown in Fig. 3.6 indicated that only in the central region of the strip the axial strain is constant (and the shear strain is zero), which entailed that the Mode-II loading condition should be assumed only in the central region of the FRP sheet.
It is interesting to notice that different experimental set-ups are available in literature (Yao et al., 2005) for direct-shear tests that might lead to significantly different results and complicate the analysis of the data. It was shown that the cohesive material model developed from direct-shear tests is directly applicable to beam tests (Chen and Teng, 2003). However, Gunes et al. (2009) observed that the Mode-II fracture energy GF under flexural loading should be higher than that measured from direct-shear tests, due to the curvature effect.
3.3.3 Discussion of interfacial fracture energy as a true fracture parameter
Contradictory results (Chen and Teng, 2001; Subramaniam et al., 2007; Mazzotti et al., 2008; Carloni and Subramaniam, 2012b) complicate the interpretation of the interfacial fracture energy GF as a true fracture parameter. Han (2009) reported that GF increases with decreasing ratio bf/b. Similarly, Czaderski et al. (2010) reported that GF increases with decreasing width of the FRP. The interfacial cohesive law was obtained by measuring the strain along the FRP strip close to the edge. The authors also questioned whether GF is a material property by making a parallelism with the Mode-I and Mode-II fracture energies of concrete (Carpinteri et al., 1993; Gunes, 2004). Chen and Teng (2001) reviewed some of the fracture mechanics approaches, which provided a value of GF that depended on the width of the FRP and concrete. Conversely, Dai et al. (2006) affirmed that GF is a material property and has a certain value for a particular combination of FRP and concrete types. Mazzotti et al. (2008) obtained the fracture energy from the load-carrying capacity of the interface of near-end supported single-shear tests. They observed that the interfacial fracture energy did not scale with the width of the FRP sheet due to the small size of the aggregate. Ching and Buyukozturk (2006) conducted direct-shear tests to study the influence of the effect of moisture on GF. It was concluded that a different debonding mechanism occurred if the specimens were conditioned at relative humidity (RH) 100%, with a progressive decrease of the fracture toughness with increasing exposure. Subramaniam et al. (2007, 2011) indicated that the interfacial fracture parameters do not scale with the width if determined from measurements in the central region of the FRP sheet.
The discussion on the nature of the interfacial fracture energy as a true fracture parameter in part arises from the misuse of Equation [3.11]. From Equation [3.11], researchers used the experimental load-carrying capacity Pcrit to determine the fracture energy by assuming that Pu = Pcrit:
[3.12]
 [3.12]
This approach led to an erroneous evaluation of GF, because the experimental value of the load-carrying capacity includes the width effect and in particular the mixed-mode behavior of the edges (Subramaniam et al., 2007). The fracture energy cannot be directly related to the experimental load-carrying capacity of the interface. The values of GF determined via Equation [3.12] scale with the width of the FRP sheet. Hence, the experimental values of the fracture energy determined through Equation [3.12] should not be considered as true values. The experimental values in Fig. 3.8 indicated that the fracture energy is nominally invariant with the width of the FRP sheet. Therefore, GF is a true fracture parameter, provided that it is obtained from strain measurements in the central region of the FRP sheet where a Mode-II fracture occurs.
3.3.4 Mode-I interfacial loading and alternative fracture approaches
In addition to the discussion regarding the nature of the fracture energy, concerns remain on the applicability of the direct-shear test results to describe ICD, mainly because of the presence of a Mode-I component (peeling stresses). The Mode-I should not be confused with the one observed before at the microscopic level, but in the spirit of the macroscopic approach of the fictitious interface. The Mode-I opening is described by the relationship between the normal stress (peeling) σzz and the opening of the crack w (Martinelli et al., 2011; Carrara and Ferretti, 2013). The Mode-I interfacial fracture energy, corresponding to the area of the σzz –w curve, is considerably lower than the Mode-II fracture energy (Taljsten, 1996; Gunes, 2004), thus even a small component of the load perpendicular to the FRP sheet could potentially reduce the load-carrying capacity of the interface. A Mode-I component is always present in the direct-shear test measurements, due to the relationship between shear and moment. A limited number of experimental works reported the study of Mode-I and mixed-mode debonding (Wan et al., 2004; Davalos et al., 2006; Alam et al., 2012). Some authors (Yao et al., 2005) recognized that the effect of a small loading angle (offset) was insignificant for relatively long bonded lengths. The presence of a Mode-I condition in beams can be explained by considering the opening of a flexural/shear crack as illustrated in Fig. 3.10 (Garden and Hollaway, 1998). As the crack opens, the two faces of the crack will undergo a relative vertical displacement that will cause a mixed-mode condition for the FRP–concrete interface. Rabinovitch (2008, 2012) used a fracture mechanics approach that considered the Mode-I and Mode-II cohesive material laws and their coupling. A set of nonlinear differential equations was derived by considering a multi-layer description of the strengthened beam. A different length of the STZ for Mode-I and Mode-II can be observed in these studies. Mazzucco et al. (2012) used a similar approach to capture the coupling of the shear and peeling stresses, but introduced a contact-damage model for the adhesion between layers. Gunes et al. (2009) reported that if the strengthened beam was sufficiently strong in shear, the flexural/shear crack mouth displacement would be limited and consequently the mixed-mode nature of debonding fracture would quickly merge into a Mode-II condition. It is interesting to notice that the results published by Alam et al. (2012) showed that the effective bond length increases if the Mode-I component is significant.

Alternative approaches within the framework of fracture mechanics are available in the literature. Achintha and Burgoyne (2008, 2011), for example, studied the debonding phenomenon as a Mode-I problem, by considering that the debonding often occurs in the concrete just above the interface. The Mode-I fracture energy of concrete was used in their approach. The authors observed that none of the existing studies available in the literature provided a reliable estimate of the interfacial fracture energy GF. Gunes et al. (2009) proposed a global energy balance model to predict FRP debonding failure. The amount of energy dissipated in the system during debonding was determined by calculating the change in the potential energy of the system. The component of the energy dissipation due to the debonding process was calculated by means of the interfacial fracture energy. An expression of GF was provided that included the geometric factor kb to take into account the influence of the width of the FRP sheet.
3.4 Numerical analysis of the fiber-reinforced polymer (FRP)–concrete interface
A one-dimensional model, developed by Ali-Ahmad et al. (2007), was used in Carloni and Subramaniam (2012b) to carry out a numerical analysis of the FRP–concrete interfacial crack initiation and propagation. The main goal of this simplistic numerical model was to confirm that the interfacial stress transfer is not a one-dimensional problem. Moreover, the results of the numerical analysis showed that even though the load-carrying capacity is only related to the fracture energy GF, as expressed in Equation [3.11], the shape of the τzy –s curve affects the interfacial response and in particular could entail for a load corresponding to crack initiation that is significantly lower than the load-carrying capacity. The FRP sheet was described by using one-dimensional axial elements. The bond between FRP and substrate was modeled using spring elements with a simplified bilinear response, which took into account the interfacial cohesive material law (Subramaniam et al., 2007, 2011). A linear ascending shear stress vs relative slip response was assumed up to the peak shear stress, τmax, and relative slip equal to so; following this, a linear softening was considered up to a value of the slip sf, beyond which complete separation of the FRP from concrete occurred. The value of so was determined by considering the peak shear stress and the initial slope of the cohesive law (Carloni and Subramaniam, 2012a). The slip sf was obtained by enforcing the value of GF. The value of GF was assumed to be equal to the mean fracture energy of test W_6 in Subramaniam et al. (2007). The numerical model is shown in Fig. 3.11. The approximation of the τzy–s curve with a bilinear response is discussed in Lu et al. (2005).

In the numerical representation, the concrete substrate was assumed to be rigid, based on the observed experimental results (Carloni and Subramaniam, 2010). The material response of the carbon FRP (CFRP) was considered to be linear elastic up to rupture. The engineering properties of the composite were based on the thickness of the fibers contained in the composite sheet and not on the gross composite area. The properties of the axial elements were determined based on the nominal width of the CFRP composite sheet. Details about the numerical model can be found in Ali-Ahmad et al. (2007).
Three different numerical simulations were performed to study the influence of the fracture parameters on the load response of the FRP–concrete interface (Fig. 3.11). The fracture parameters used in the simulations are summarized in Table 3.2. The parameters (τmax, GF, τmax/so) used in DS_1 corresponded to the mean values computed from the τzy –s curves associated with the aforementioned ten points of the load response of test W_6 (Subramaniam et al., 2007). In DS_2, the slope of the ascending response was decreased with respect to DS_1 without varying τmax and GF. Finally, in DS_3 τmax was reduced while so and sf were computed in order to maintain the slope of the ascending response and the fracture energy equal to DS_1.
Table 3.2
Fracture parameters of the numerical simulations
| Simulation | τmax (MPa) | So (mm) | Sf (mm) | GF (MPa mm) |
| DS_1 | 6.65 | 0.026 | 0.164 | 0.546 |
| DS_2 | 6.65 | 0.060 | 0.164 | 0.546 |
| DS_3 | 4.00 | 0.016 | 0.273 | 0.546 |

In Fig. 3.12, the load responses of the numerical simulations are compared with the load response of Fig. 3.2. Since the model is one-dimensional, it is implicitly assumed that the cohesive material law determined from the center of the FRP sheet applies to the entire width of the FRP. Therefore, the load-carrying capacity Pnumu of DS_1, DS_2, and DS_3 is the same but should be lower than the experimental value (Pcrit), because the model neglects the width effect. The value of Pnumu computed from Equation [3.11] utilizing the mean fracture energy of test W_6 (Subramaniam et al., 2007), provided in Tables 3.1 and 3.2, is:
[3.13]
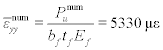
Pnumu matches the numerical results but is lower than the experimental load-carrying capacity as observed above. The maximum strain, corresponding to debonding, can be obtained from Equation [3.13]:
[3.14]
 [3.14]
The strain value calculated in Equation [3.14] is in good agreement with the mean value of the maximum strain ![]() of test W_6, which is equal to 5560 με (Fig. 3.4 and Table 3.1). However, it should be observed that the experimental value of the strain is slightly higher than that obtained in Equation [3.14], because the applied load is affected by the presence of the edge regions and by the restraining effect of the adjacent concrete. Furthermore, the value of GF used in Equation [3.13] is calculated as the mean value from ten images corresponding to ten different points of the load response.
of test W_6, which is equal to 5560 με (Fig. 3.4 and Table 3.1). However, it should be observed that the experimental value of the strain is slightly higher than that obtained in Equation [3.14], because the applied load is affected by the presence of the edge regions and by the restraining effect of the adjacent concrete. Furthermore, the value of GF used in Equation [3.13] is calculated as the mean value from ten images corresponding to ten different points of the load response.
A comparison between the numerical simulations shows that even though the load-carrying capacity is only related to the area under the curve of the cohesive material law, the fracture parameters and therefore the shape of the curve influence the linear and nonlinear part of the load response. If the slope of the ascending branch decreases (DS_2), then the slope of the linear portion of the load response decreases. A decrease of the slope corresponds to a decrease of the stiffness of the interface and determines an upward shift of the end of the linear portion of the load response, which in turn delays the formation of microcracking in concrete. The strain value corresponding to the formation of the STZ in concrete for DS_2 is higher than DS_1. A decrease of the maximum shear stress without varying the fracture energy entails for an increase of the LSTZ, which produces a downward shift of the end of the linear portion of the load response. The strain value corresponding to the formation of the STZ in concrete for DS_3 is lower than DS_1.
3.5 Design aspects related to debonding
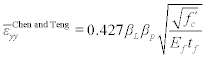
In Section 10.1.1 of the ACI 440.2R-08 (2008) document, the flexural failure modes of an RC strengthened beam are described. In order to prevent ICD, in the same section the effective strain εfd in the FRP reinforcement is limited to the strain level at which debonding may occur. The formula used in the ACI 440.2R-08 document is a modification of the original formula proposed by Chen and Teng (2001):
[3.15]
 [3.15]
where βL = 1 if the bonded length of FRP is greater than the effective bond length. βp takes into account the effect of the width ratio bf/b. f′c is the specified compressive strength of concrete.
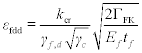
A similar approach is proposed in the Italian guidelines (CRN-DT 200/2004), in which a limit for the strain in the FRP is provided in order to prevent debonding:
[3.16]
 [3.16]
where kcr can be taken equal to 3.0, ΓFK is the fracture energy GF, γc is the partial safety factor for concrete that can be obtained from the Italian design code for RC structures, and γf,d is the partial safety factor for FRP materials (CRN-DT 200/2004). A formula to compute the fracture energy is provided in the Italian document (CRN-DT 200/2004) and was used in Fig. 3.8:
[3.17]
In Equation [3.17] the fracture energy is related to the mechanical properties of concrete but it is also recognized to be dependent on the ratio bf/b through the coefficient kb. fck is the characteristic compressive strength of concrete and fctm is the mean value of the tensile strength of concrete. In this chapter, since the tensile strength was not measured in the experimental work herein presented, it was assumed (Gunes et al., 2009):
[3.18]
The strain at debonding for test W_6 in Subramaniam et al. (2007) determined from Equations [3.15] and [3.16] is equal to 6600 and 6700 με, respectively. The term ![]() was not applied in Equation [3.16] because it contains safety factors. The width factors βp and kb were equal to 1.22 and 1.30, respectively. The experimental mean value of
was not applied in Equation [3.16] because it contains safety factors. The width factors βp and kb were equal to 1.22 and 1.30, respectively. The experimental mean value of ![]() , equal to 5560 με, is lower than the values of the strain obtained from Equations [3.15] and [3.16]. This can be justified in part by taking into account that most of the formulas provided in the past were calibrated by using the approach of Equation [3.12].
, equal to 5560 με, is lower than the values of the strain obtained from Equations [3.15] and [3.16]. This can be justified in part by taking into account that most of the formulas provided in the past were calibrated by using the approach of Equation [3.12].
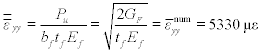
The strain at debonding could be calculated from Equation [3.11]:
[3.19]
 [3.19]
The value of the strain obtained from Equation [3.11] is indicated with a double-bar sign. The fracture energy used in Equation [3.19] is the mean value from test W_6 (Subramaniam et al., 2007). The value obtained in Equation [3.19] equals the one in Equation [3.14] because the load-carrying capacity depends on the fracture energy and not on the shape of the cohesive material law.
It is important to discuss the applicability of a strain limit. Wu and Niu (2007) noticed that the strain compatibility-based approach cannot be applied at those cross-sections where debonding occurs. In fact, the cross-sectional analysis entails a perfect bond between FRP and concrete. Gunes et al. (2009) applied the global energy approach and observed that the ACI strain limit does not take into account the interaction between the shear and flexural external reinforcements. The numerical analysis previously presented indicated that crack initiation could occur at a load level in the FRP much lower than the one corresponding to the strain in Equations [3.15] or [3.16]. Hence, the applicability of the cross-sectional analysis is questionable even before the debonding failure is reached. In order to partially overcome this issue, a maximum shear stress limit could be added to the strain limits of Equations [3.15] and [3.16]. Several expressions are available in the literature to evaluate the maximum shear stress τmax in the cohesive material law (Han, 2009; Ueno et al., 2013). The inclusion in guidelines and codes of formulas to calculate and limit the maximum shear stress at the interface could help the designer evaluate at what load level microcracking of concrete occurs and eventually decide whether an additional reduction factor should be applied to the strain limit in order to prevent brittle failure of the interface.
The issue related to the strain limit can be considered from another point of view. In this chapter, only the debonding mechanism initiating from a single crack was considered. The presence of a multi-crack pattern corresponds to the possibility of crack-induced debonding at different cross-sections (Pan et al., 2010). If one considers that the FRP sheet between two flexural cracks is subject to two tensile forces in opposite directions, two STZs form between two cracks that could potentially overlap if the sum of the lengths of the STZs is smaller than the crack spacing.
3.6 Future trends
There are still unresolved issues that need to be addressed in the near future to improve international guidelines and codes. In this last section, some of those issues will be briefly presented. Finally, a newly-developed type of fiber-reinforced composites will be introduced.
3.6.1 Unresolved issues
Durability studies of the FRP strengthening technique are still limited, and additional data are necessary. Among the others, the effect of environmental conditions on the interfacial fracture properties was studied in Green et al. (2000), Ching and Buyukozturk (2006), and Subramaniam et al. (2008). It was recognized that freeze–thaw cycles determined a reduction of the load-carrying capacity. Conversely, a recent study by Dash et al. (2013) showed that the combined effect of moisture, temperature, and sustained loading could be beneficial for the ultimate load-carrying capacity of the interface.
The fatigue behavior of the FRP interface has still not been fully investigated (Kim and Heffernan, 2008; Carloni et al., 2012; Carloni and Subramaniam, 2013). The limited studies available in the literature are contradictory; however, it appears that fatigue loading even at low ranges could be detrimental for the stress transfer between FRP and concrete (Aidoo et al., 2004). The influence of the frequency (Diab et al., 2009) and the explicit dependence of the fatigue life on the load range and its mean value are not fully understood. Carloni and Subramaniam (2013) observed that fatigue-induced debonding could occur at the epoxy–fiber interface rather than in a thin layer of concrete. The shift of the debonding interface entails reduction of the effective bond length.
The relationship between the results of direct-shear tests and the actual performance of FRP strips bonded to RC beams is still an open issue. The effect of the curvature of the beam and the relative vertical displacement at flexural/shear cracks on the interface behavior is not easily captured by direct-shear tests. Sebastian (2001) observed that a strain distribution is present in the FRP strip prior to initiation of debonding, which is not taken into account in direct-shear tests. He also observed that measuring the strain on the FRP surface could be misleading in beams because of the presence of curvature. Rosenboom and Rizkalla (2008) pointed out that the strain limit provided in codes might not be sufficient to prevent debonding and noticed that the width effect in beams and direct-shear tests could be different. The relationship between the debonding mechanism in direct-shear tests and beams is also complicated by the fact that several direct-shear test set-ups are available and a standardized test is not available.
3.6.2 Fiber-reinforced cementitious matrix (FRCM) composites
Newly-developed composites that represent a sustainable alternative to FRPs are the so-called FRCM composites. In FRCM composites, fibers are typically bundled, and modified cement-based mortar is used instead of epoxy as matrix. The limited available literature (D’Ambrisi and Focacci, 2009; Ombres, 2012) suggests that FRCM composites can be used effectively for strengthening of RC structures. However, in FRCM composites debonding is typically observed at the matrix–fiber interface rather than in the substrate or at the matrix–concrete interface, which is typically observed in FRP composites. A complete understanding of the interfacial stress-transfer mechanism in FRCM composites is not available yet, although researchers have applied the concept of cohesive crack to describe the matrix–fiber interfacial behavior (D’Ambrisi et al., 2012; D’Antino et al., 2013). The studies available in the literature indicate that the effective bond length of FRCMs is much longer than that typically observed for the FRP–concrete interface. Moreover, friction between fibers, and between fibers and matrix, during the debonding process complicate the phenomenon. If these observations are confirmed, the debonding would not be governed by the properties of the concrete but rather by the combination of fibers and mortar used in the application.
3.7 Acknowledgments
The author would like to thank Prof. Kolluru V. Subramaniam (Indian Institute of Technology, Hyderabad) for the fruitful collaboration over the last 10 years and for giving him the opportunity to perform the experimental work at The City College of New York where Prof. Subramaniam worked from 2000 until 2010. The writer gratefully acknowledges Prof. Angelo Di Tommaso (University of Bologna), for giving him the opportunity of working on this subject during his Master’s thesis and for being a constant guide over the years. Finally, the author would like to thank Prof. Lesley H. Sneed (Missouri S&T) for the ongoing extensive research collaboration on FRCM composites.