
Identifying damage in honeycomb fiber-reinforced polymer (FRP) composite sandwich bridge decks
P.Z. Qiao and W. Fan, Washington State University, USA
Abstract:
A strain energy-based damage identification method for plate-type structures is presented. The damage identification method employs a damage location factor matrix and a damage severity correction factor (DSCF) matrix for damage localization and quantification. An experimental modal test of an as-manufactured fiber-reinforced polymer sandwich deck panel is conducted in the laboratory to demonstrate the applicability and effectiveness of the proposed DSCF-based damage identification method. The composite deck panel at healthy and three damaged stages is tested using a surface-bonded polyvinylidene fluoride sensor array and impact hammer system. The present damage identification method can be used as a viable and effective technique for damage localization and quantification of plate-type structures.
Key words
damage identification; fiber-reinforced polymer; composites; bridge decks; plates; structural health monitoring; damage quantification; dynamics; sandwich structures
4.1 Introduction
Most non-destructive damage identification methods can be categorized as either local or global damage identification techniques (Fan and Qiao, 2011). Local damage identification techniques, such as ultrasonic methods and X-ray methods, require that the vicinity of damage is known a priori and is readily accessible for testing, which cannot be guaranteed for most cases in civil or aerospace engineering. The vibration-based damage identification method as a global damage identification technique is developed to overcome these difficulties. The basic idea of vibration response-based damage detection is that the damage will induce changes in the physical properties (mass, damping, stiffness, etc.), which will in turn cause detectable changes in dynamic properties of the structure (natural frequencies, modal damping, mode shapes, etc.) (Doebling et al., 1996). Therefore, it is intuitive that damage can be identified by analyzing the changes in vibration features of the structure.
Many damage identification methods have been proposed utilizing mode shapes (Ratcliffe, 1997; Hadjileontiadis et al., 2005), frequencies (Cawley and Adams, 1979; Salawu, 1997), or modal parameters derived from mode shapes and frequencies, such as modal strain energy (Stubbs et al., 1995; Stubbs and Kim, 1996), modal compliance (Choi et al., 2005), modal flexibility, and uniform load surface (Zhang and Aktan, 1998; Wang and Qiao, 2007). Even though many methods have been developed, no single method is completely effective in all situations. A comparative study by Farrar and Jauregui (1996) based on experimental data shows that the strain energy-based damage index performed best among some popular existing damage identification methods.
The modal strain energy-based method is a widely used category of damage identification methods. This method uses the fractional modal strain energy change (MSEC) for damage detection. For beam-type or plate-type structures, the modal strain energy can be directly related to (and is usually derived from) the strain mode shape. Stubbs et al. (1995) and Stubbs and Kim (1996) developed a damage index (DI) method based on the modal strain energy. This method assumes that if the damage is primarily located at a single sub-region, then the fractional strain energy will remain relatively constant in sub-regions. For beam-type structures, the bending stiffness EI is assumed to be essentially constant over the length of the beam for both the undamaged and damaged modes. Shi and Law (1998) and Shi et al. (2000) presented a damage localization method for beam, truss, or frame type structures based on the MSEC. The MSEC at the element level is suggested as an indicator for damage localization. Law et al. (1998) applied this strain energy method to detect the damage location in a structure with incomplete and noisy measured modal data. The method consists of three stages: expansion of the measured mode shapes, localization of the damage domain using the elemental energy quotient difference, and damage quantification based on sensitivity of the modal frequency.
In this study, a modal strain energy-based damage severity correction factor (DSCF) method recently proposed for damage localization and quantification of plate-type structures (Fan, 2011; Fan and Qiao, 2012) is experimentally verified using a fiber-reinforced polymer (FRP) sandwich deck panel with a surface-boned piezoelectric sensor array. The method can be easily implemented in experimental testing and can be used to both locate and quantify damage. The proposed method has been thoroughly investigated based on a series of numerically simulated data. However, the damage identification method may fail sometimes due to the effects of noise, measurement errors, and sensor placement, even though this method has been verified with numerically simulated data. Therefore, the damage identification method should further be verified by experimental data on a real structure.
The objective of this chapter is to present an experimental verification of the DSCF-based damage identification method on an FRP sandwich deck panel with a polyvinylidene fluoride (PVDF) sensor array. The method is applied to both the experimental data from modal testing and numerical data from a detailed finite element model. The theoretical background of the proposed DSCF method is first introduced, followed by the experimental modal testing of an FRP sandwich panel using a PVDF sensor array. The DSCF-based damage identification method is then applied to the experimental data for damage localization and quantification. The numerical simulation of the FRP sandwich panel is then presented to verify the experimental test and the damage identification method. Finally, concluding remarks are provided.
4.2 The damage severity correction factor (DSCF) method for damage identification: theory
The equation of motion for free vibration of an undamped healthy structural dynamic system leads to the following eigenvalue problem:
[4.1]
where: K is the stiffness matrix; M is the mass matrix; λi is the eigenvalue of the ith mode, which is the square of the ith modal frequency; and ɸi is the vibration mode shape vector of the ith mode. Note that both K and M are symmetric matrices.
For damaged structure, assuming the mass loss is negligible, the eigenvalue problem of a damaged structure can be expressed as
[4.2]
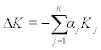
Structural damage, such as cracks, delamination, debonding, and barely visible impact damage (BVID) in composite materials, usually causes a loss in stiffness but not a loss in mass. The change of structural stiffness matrix ΔK introduced by structural damage can be modeled by a proportional damage model, i.e., ΔK can be expressed as a function of the undamaged element stiffness by the equation
[4.3]
 [4.3]
[4.3]where n is the total element number, Kj is the stiffness matrix of the jth element, and αj is the damage severity of the jth element. The damage severity is defined as the fractional change in elemental stiffness (αj = 0 for a healthy element).
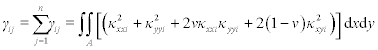
For a plate-type structure, the elemental modal potential energy can be expressed by the elemental modal strain energy. The potential energy of the jth element in the ith mode of the healthy plate can be expressed as
[4.4]
where kj = (EI)j is the bending stiffness of the jth element in the healthy plate, which is a constant k over the plate, and γij is defined as
[4.5]
where the curvature mode shapes κxx, κyy, and κxy can be derived from the displacement mode shape data using the finite difference approximation, or they can be directly measured as the strain mode shape using piezoelectric sensors such as lead zirconate titanate (PZT) and PVDF. Deriving the curvature mode shape from the displacement mode shape data using the finite difference approximation may significantly magnify the effects of noise and measurement error. Therefore, using the directly measured strain mode shape data is advantageous (Fan and Qiao, 2011).
Combining Equations [4.3] and [4.4], we have
[4.6]
Similarly, the total potential energy of all elements in the ith mode of healthy plate is
[4.7]
where γi is defined as
[4.8]
 [4.8]
[4.8]
The potential energy of the jth element in the ith mode of damaged plate can be expressed as
[4.9]
where the superscript * denotes the damaged state.
Neglecting the high-order terms of Δφi in Equation [4.9] and using Equations [4.3], [4.4], and [4.6], we have
[4.10]
 [4.10]
So we can derive
[4.11]
It can be further derived from Equation [4.11] that
[4.12]
[4.13]
Substituting Equations [4.6], [4.7], [4.12], and [4.13] into Equation [4.2] and simplifying the equation, we obtain
[4.14]
 [4.14]
where Δλi/λi is the ith eigenvalue change ratio, which reflects the global effect of the damage on the ith mode. Here, γij/γi is defined as a damage location factor (DLF), which reflects the sensitivity of the ith vibration mode to the damage at the jth element. The DLF is an important factor for damage localization and quantification. While a DSCF is defined as
[4.15]
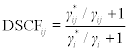 [4.15]
DSCF represents the nonlinear effect of damage severity αj at the jth element on the ith modal frequency change ratio. It is a function of damage location and severity and can be easily calculated from the modal strain energy in the healthy and damaged state. In the case of minimum damage, DSCF ≈ 1 and the eigenvalue change ratio is a linear function of damage severity.
It should be noted that if the curvature mode shape data from the healthy and damaged state are not normalized on the same basis (e.g., mass-normalized), the value of DSCF may differ depending on the normalization. In order to keep the DSCF consistent for unnormalized curvature mode shape, the healthy and damaged curvature mode shapes are normalized so that their total modal strain energies are the same. In this case, the DSCF can be approximated from the unnormalized curvature mode shape by
[4.16]
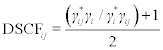 [4.16]
The DSCF is a good damage location indicator, as well as an important factor in damage quantification.
4.3 DSCF-based damage identification method: key steps
The proposed DSCF-based damage identification method (Fan, 2011; Fan and Qiao, 2012) consists of three steps: mode selection, damage localization, and damage quantification.
4.3.1 Step 1: Selection of sensitive modes
The vibration modes for damage identification are selected based on the eigenvalue change ratio Δλi/λi. Before applying any damage identification algorithm to modal parameters obtained in modal testing, the sensitivity of the vibration modes to the existing damage should be evaluated to ensure the effectiveness and accuracy of damage localization and damage quantification. The eigenvalue change ratio Δλi/λi is adopted as a mode sensitivity indicator.
4.3.2 Step 2: Localization of damage
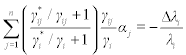
Damage is then localized using the DSCF and DLF. A DI based on the DSCF is proposed as a good indicator for damage location. The DI β*ij at the jth element in the ith mode can be defined as:
[4.17]
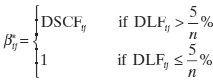 [4.17]
where n is the total element number. Since DLFij is a damage location factor that reflects the sensitivity of the ith vibration mode to the damage at the jth element, a vibration mode is insensitive to damage at an element with extremely low DLF in this mode. Therefore, this mode is inadequate to detect damage at this element, even if the damage exists. The DI with extremely low DLFij is directly set to 1 correspondingly to avoid the potential numerical error. In this study, the criterion for extremely low DLFij is set at 5% of the average of DLFij in the ith mode.
Then, assuming that the damage indices β* at different elements is a normally distributed random variable, the DI β*ij can be normalized as
[4.18]
 [4.18]
where ![]() and σβi represent the mean and standard deviation of the damage indices in the ith mode, respectively. A damage detection criterion can be set as the normalized DI Z*ij larger than 2, to filter out small damage indices induced by measurement noise.
and σβi represent the mean and standard deviation of the damage indices in the ith mode, respectively. A damage detection criterion can be set as the normalized DI Z*ij larger than 2, to filter out small damage indices induced by measurement noise.
[4.19]
Furthermore, in order to eliminate false positive indications of damaged element induced by the measurement and numerical errors at those elements with low strain energy, a modified damage indices βj at the jth element can be derived from DLFij and Z*ij as
[4.20]
Finally, a normalized DI Zj can be generated from βj to indicate the damaged elements,
[4.21]
 [4.21]
and a similar damage detection criterion can be set as in Equation [4.19].
[4.22]
4.3.3 Step 3: Quantification of damage
Damage severity is finally quantified using the eigenvalue change ratio, DLF, and DSCF. Once the damaged element is detected in Step 2, the DSCF can be further used to calculate the severity of damage. If multiple modes are available, Equation [4.14] can be written in the matrix form as
[4.23]
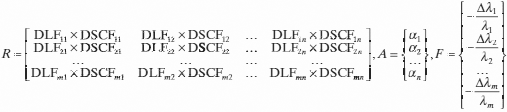
where m is the total number of vibration modes, n is the total damaged element number, and DLF is the damage location factor γij/γi.
For a unique solution, the number of the used vibration modes should be equal to the total number of unknown parameters (elemental damage severities). However, for the laboratory test or in situ application, the number of accessible vibration modes that are suitable for damage identification is very limited (typically the first few modes), and it is usually much less than the number of unknown parameters required. Furthermore, due to the existence of measurement errors, more measured modes than unknown parameters are required to construct a system of overdetermined equations to improve the accuracy of damage severities estimation. Therefore, to avoid non-uniqueness, appropriate assumptions on damage location or the damage severity distribution pattern have to be made to reduce the number of unknown parameters. For example, in damage identification with large sensor spacing, it is usually assumed that the damage only happens in a single element. For example, in the delamination identification case, it is reasonable to assume that the damage severity is the same for one delaminated area since delamination usually propagates between the same layers inside a composite plate.
When the number of measured modes is larger than the total number of unknown parameters, the least square fitting method is used to obtain the best solution.
[4.24]
4.4 Experimental verification of the DSCF-based damage identification method
To verify the proposed DSCF-based damage identification method, a full-size as-manufactured FRP sandwich deck panel was experimentally tested in Smart Structural Laboratory at Washington State University.
4.4.1 Description of the fiber-reinforced polymer (FRP) sandwich deck panel
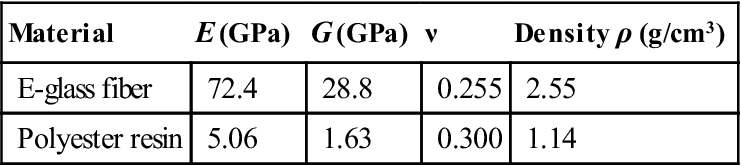
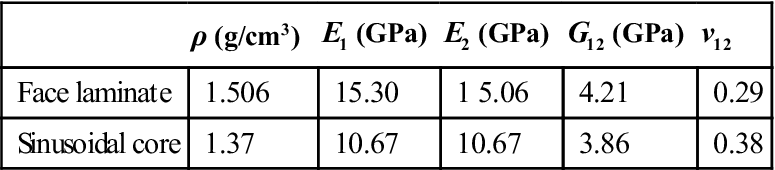
The FRP sandwich deck panel is a plate-type structure with a length of 1.981 m and a width of 1.495 m. The sandwich panel was connected to two underlying concrete supports using steel bolted connectors, which are considered to provide a simply supported boundary condition. The FRP sandwich panel consists of two face laminates and a sinusoidal honeycomb core, as shown in Fig. 4.1. The thickness of face laminates and honeycomb core are tf = 13.5 mm and tc = 128 mm, respectively. The constituent materials used for the composite sandwich panel (both face laminates and core) consist of E-glass fibers and polyester resin, and their mechanical properties are listed in Table 4.1.
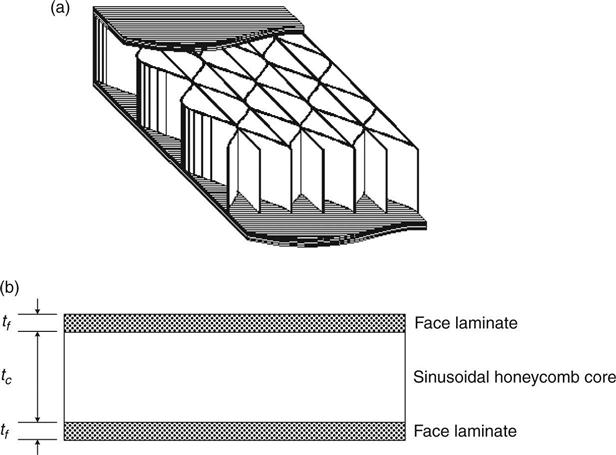
Table 4.1
Mechanical properties of the constituent materials
| Material | E (GPa) | G (GPa) | ν | Density ρ (g/cm3) |
| E-glass fiber | 72.4 | 28.8 | 0.255 | 2.55 |
| Polyester resin | 5.06 | 1.63 | 0.300 | 1.14 |
The geometry of the sinusoidal core is shown in Fig. 4.2. The wave function of corrugated core wall can be defined as
[4.25]

The dimensions of the sinusoidal core are a = 50.8 mm, b = 50.8 mm, and t1 = t2 = 3.34 mm (as shown in Fig. 4.2).
4.4.2 Experimental setup
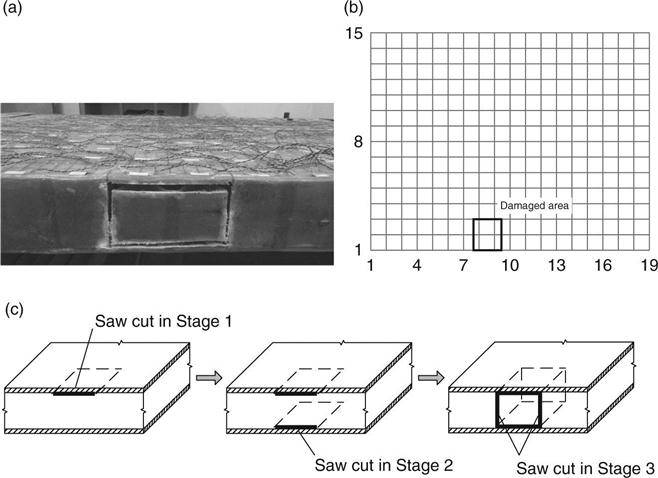
The modal testing of the FRP sandwich plate was conducted using a polyvinylidene fluoride (PVDF) sensor network bonded to the top surface in the longitudinal direction. The PVDF sensors used in the experiment are Model DT1–028K/L from the Measurement Specialties Company. A total of 285 nodes of PVDF sensors are uniformly distributed into 19 rows and 15 columns on the surface of the panel to build a sensor array. The plate is divided into 18 × 14 elements by the 19 × 15 sensors.
The panel is subjected to a dynamic pulse load applied at the central point using a modally tuned hammer (PCB 086C20). The response measurements are captured by the 19 × 15 sensor network to record the response of the structure subjected to the fixed point force excitation. A total of 19 × 15 node points are monitored corresponding to an actual spatial sampling distance of 101.6 mm. The coherent signals of the excitation and the responses are digitized and collected by the data acquisition system dSPACE CP1103 at a sampling frequency of 4000 Hz. Due to the fact that only 20 channels are available, only one column of nodes with 19 sensors is measured in each experiment. In this way, the 285 transfer functions between the hammer excitation and different PVDF sensors can still be measured for modal analysis in 15 experiments. The experimental setup using the distributed PVDF sensor array is shown in Fig. 4.3.

After the healthy FRP sandwich panel is tested, three stages of damage with increasing severity are artificially induced into the sandwich panel. In the first stage of induced damage (Damage Stage 1), a saw cut is induced between the top face sheet and the honeycomb core, to simulate debonding between the top face sheet and honeycomb core. A 203.2 mm × 203.2 mm area of face sheet-core debonding (cut) is shown in Fig. 4.4. In the second stage of increasing damage (Damage Stage 2), another saw cut is further induced between the bottom face sheet and the honeycomb core in the same area of the top face sheet-core debonding, to simulate debonding between the bottom face sheet and honeycomb core. Finally, in the third stage of the largest damage in this study (Damage Stage 3), the two vertical sides of the core between the two face sheet-core debonding areas are cut to simulate the core crashing scenario, as shown in Fig. 4.4.
4.4.3 Modal testing results
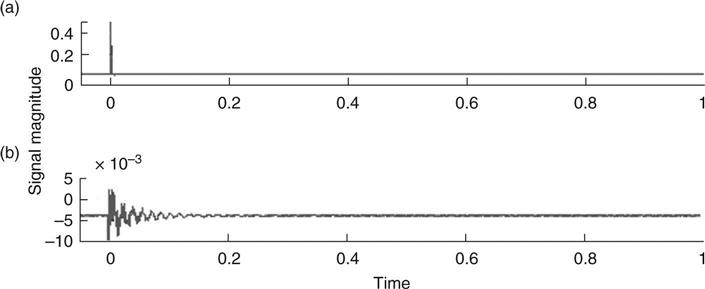
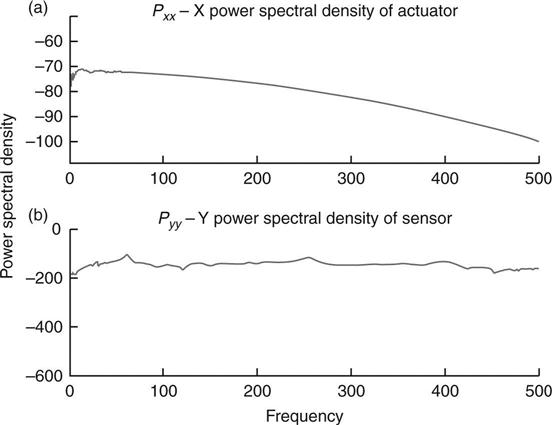
The measurements for each sensor node are repeated 16 times, and a pretrigger of 0.05 seconds at the level of 0.01 volt is set to synchronize the time-domain signal. The synchronized time history data from the excitation and response measurements are averaged to enhance the signal-to-noise ratio (SNR), as shown in Fig. 4.5. Then, the frequency-domain power spectral densities are generated from the excitation and response time-domain data using fast Fourier transform (FFT), as shown in Fig. 4.6. The frequency-response functions (FRFs) of these tested points are calculated from the excitation and response frequency-domain data. The FRF curve and its coherence curve, corresponding to time-domain data in Fig. 4.5 and frequency-domain data in Fig. 4.6, are illustrated in Fig. 4.7. Finally, these FRF curves are imported to the modal analysis program ME’Scope for curve fitting and modal extraction. The modal testing is conducted using a fixed point force excitation and a distributed PVDF sensor network, so the extracted mode shape should be the strain/curvature mode shape of the plate (Wang, 1998).

Since the plate is tested using a PVDF sensor network in the longitudinal direction (y-direction), only the curvature mode shapes in the longitudinal direction (κyy) are captured. Therefore, only the longitudinal bending modes, in which κyy is dominant, are suitable for damage identification. In the excitation frequency range of the modally tuned hammer, the first and third bending modes are captured. However, the second bending mode cannot be captured, because the fixed point force excitation is applied at the central point of the plate, which is at the nodal line of the second bending mode. Hence, the first and third bending modes in the longitudinal direction are investigated for damage identification. It should be noted that the modal frequency of the first bending mode lies closely around 60 Hz. Because the unshielded PVDF sensors are prone to electro-magnetic interference (EMI), their responses around 60 Hz could be noisy due to EMI from power system.
In the healthy stage and the three damage stages, the modal testing is conducted to extract the modal frequencies and curvature mode shapes of the FRP sandwich deck panel. The extracted curvature mode shapes and modal frequencies of the FRP sandwich deck panel for the first and third bending modes are shown in Plates I and II (in the color section between pages 172 and 173), respectively.
4.5 Implementing the DSCF-based damage identification method with the experimental data
The proposed three-step DSCF-based damage identification method is applied to the experimental data, and their results are presented and discussed in the following subsections.
4.5.1 Step 1: Mode sensitivity
For the first longitudinal bending mode, the modal eigenvalue change ratios at three damage stages are 0.57%, 0.91%, and 3.59%, respectively. While for the third longitudinal bending mode, the modal eigenvalue change ratios at three damage stages are 0.71%, 1.55%, and 4.07%, respectively. It can be seen from the eigenvalue change ratio that both the modes are sensitive to the damage evolution (severity). Thus, both are used for damage identification.
4.5.2 Step 2: Damage localization
The modal strain energy of a plate can be derived from the curvature mode shapes of κxx, κyy, and κxy. However, one PVDF sensor can only be used to measure the strain response in one direction. Therefore, a sensor array positioned in one direction can only capture the strain/curvature mode shape in that direction at one time. Hence, for a longitudinal bending mode, the modal strain energy is approximated by its partial modal strain energy in the dominant direction. Assuming κxx = κxy = 0, the partial modal strain energy in the y-direction can be derived from Equation [4.5] as
[4.26]
The DLF and DSCF matrices for damage identification can be generated as follows. First, a bivariate cubic spline interpolation function is constructed for the curvature mode shape. The bivariate cubic spline is constructed as the tensor product of two univariate cubic splines. It can be expressed as the weighted sum of products of two cubic spline functions:
[4.27]
where gi(x) and hj(y) are the cubic spline functions in x- and y-directions, respectively. Then, using the bivariate cubic spline function, γij and γ*ij can be calculated from Equation [4.26]. Finally, the DLF and DSCF matrix can be calculated from γij and γ*ij.
The DSCF-based damage indices using the modal strain energy from the first and third longitudinal bending modes are shown in Plate III (in the color section between pages 172 and 173). Although the damaged area does not exactly match the sensor grids, the DSCF damage localization method correctly approximates the location and area of the damage. It can be noticed that in Damage Stage 3 a false positive indication is given near the damaged area. There might be two reasons: (a) the effect of damage might have spread out to surrounding elements (Choi et al., 2006); and (b) when cutting the two sides of the damaged area, the saw cut might have damaged the sinusoidal core of the neighboring element.
4.5.3 Step 3: Damage quantification
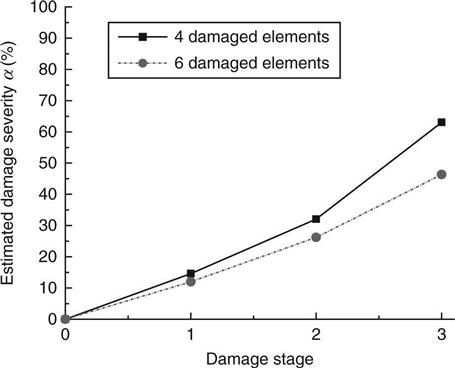
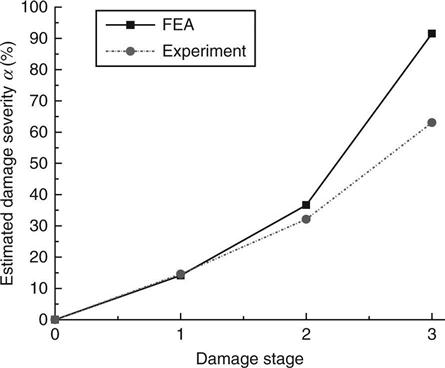
Assuming that each damaged element has the same damage severity, the DSCF method can be further applied for damage quantification using the DLF and DSCF derived in Step 2. The damage quantification results of the DSCF-based damage identification method are presented in Fig. 4.8. The damage quantification results, based on the four damaged elements indicated in Damage Stages 1 and 2, are marked in black in Fig. 4.8. The damage quantification result, based on the six damaged elements indicated in Damage Stage 3, is also shown in gray for comparison in Fig. 4.8. As shown in Fig. 4.8, the damage severity increases consistently with the Damage Stages 1 to 3.
4.6 Using numerical modal analysis to identify damage
After the experimental modal testing of the full-size FRP sandwich panel, a numerical modal analysis of the FRP sandwich panel is conducted to verify the experimental results. The DSCF-based damage identification method is also applied to the numerical data for damage localization and quantification.
4.6.1 Modeling of face sheets and the sinusoidal core
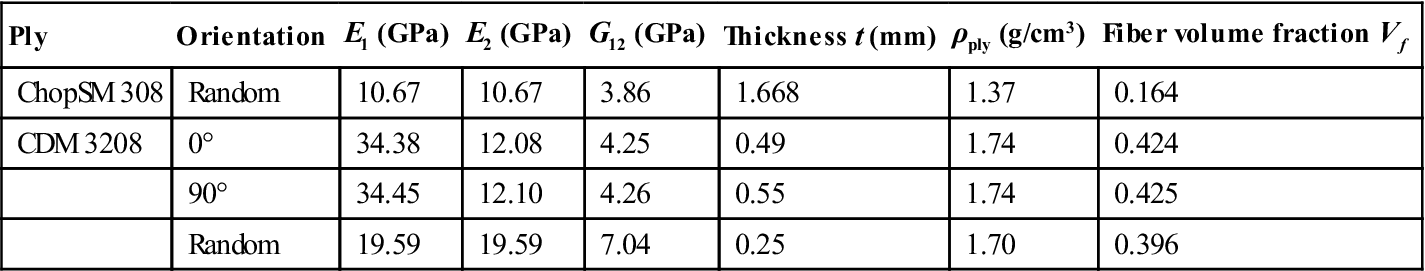
The lay-up of the face sheets and sinusoidal core is shown in Fig. 4.9, and corresponding layer material properties are listed in Table 4.2. The face laminate includes five ChopSM bonding layers (ChopSM308) and four bi-directional combination mat layers (CDM3208), while the microstructure of core walls consists of two layers of ChopSM (ChopSM308).
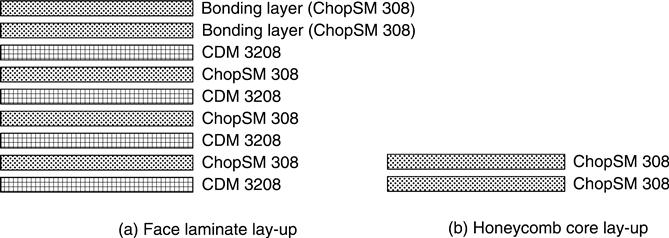
Table 4.2
Layer material properties from micromechanics models
| Ply | Orientation | E1 (GPa) | E2 (GPa) | G12 (GPa) | Thickness t (mm) | ρply (g/cm3) | Fiber volume fraction Vf |
| ChopSM 308 | Random | 10.67 | 10.67 | 3.86 | 1.668 | 1.37 | 0.164 |
| CDM 3208 | 0° | 34.38 | 12.08 | 4.25 | 0.49 | 1.74 | 0.424 |
| 90° | 34.45 | 12.10 | 4.26 | 0.55 | 1.74 | 0.425 | |
| Random | 19.59 | 19.59 | 7.04 | 0.25 | 1.70 | 0.396 |
To predict the equivalent properties of the face laminates from the fiber and matrix material properties, a micro–macro mechanics approach (Davalos et al., 2001; Qiao and Wang, 2005) is adopted. First, the properties of each layer in the face sheet can be computed using periodic microstructure (PM) approaches (micromechanics) (Barbero, 1999). Then, based on ply properties and lay-up, the apparent stiffnesses of the face laminate can be predicted using classical lamination theory (macromechanics). The equivalent analysis of core is performed using the methods of homogenization and mechanics of materials approaches (Davalos et al., 2001; Qiao and Wang, 2005). The derived equivalent stiffness properties of face laminates and core walls are listed in Table 4.3.
4.6.2 Finite element modal analysis of FRP sandwich panel
The commercial finite element analysis package ABAQUS is used to conduct an eigenvalue analysis of the FRP sandwich deck panel. A detailed model of the full-size sandwich panel is constructed in ABAQUS, as shown in Plate IV (in the color section between pages 172 and 173). The face sheets and the sinusoidal core walls are modeled as four-node first-order plate elements S4 and three-node first-order plate elements S3. The corresponding stiffness properties of face sheets and core walls are given in Table 4.3. The boundary conditions are considered to be simply supported at both the transverse edges.
The FEA is conducted on both the health and damaged sandwich panel. Three damaged sandwich panel models are set up to simulate the FRP sandwich deck panels with artificially induced damage in the three damage stages (see Fig. 4.4c). The debonding between the face sheets and core is simulated by detaching the node/element connection between the face sheets and core elements. The cuts in the sinusoidal core are similarly simulated. The simulated mode shapes of the FRP sandwich panel are shown in Plate IV. The displacement mode shapes of the healthy and damaged panel are very close to each other; thus, only the displacement mode shapes of the healthy one are shown in Plate IV. The strain mode shape can be then extracted from the 19 × 15 nodes corresponding and identical to the 19 × 15 PVDF sensors in the experimental test, as shown in Plates V and VI (see in the color section between pages 172 and 173), respectively, for the first and third bending modes.
4.7 Damage identification using numerical data
Similarly, the proposed three-step DSCF-based damage identification method is applied to the numerical finite element modal analysis data, and their results and comparison to the damage identification outcomes with experimental data are presented and discussed in the following subsections.
4.7.1 Step 1: Mode sensitivity
The modal frequencies of the healthy sandwich panel from the FEA are 62.983 and 418.6 Hz, which shows close agreement with the experimental test data of 61.08 and 403.00 Hz for the first and third bending modes, respectively. The result confirms that the boundary conditions at the two transverse supporting ends should be modeled as simply supported, and the free vibration modes of the FRP sandwich panel can be accurately predicted by the detailed finite element (FE) model. The modal eigenvalue change ratios at three damage stages from the FEA and experimental test are compared in Table 4.4. The FEA results also show that both the modes (first and third) are sensitive to the damage, so both can be used for damage identification. It can also be noticed that the FEA tends to underestimate the modal eigenvalue change ratios for the first mode but over-predict the ratios for the third mode.

4.7.2 Step 2: Damage localization
The DSCF-based damage identification method is applied to the curvature mode shapes for damage localization. The damage indices using the modal strain energy from the first and third longitudinal bending modes are shown in Plate VII (in the color section between pages 172 and 173). The results show the same indication of damaged elements in the first and second stages as the results from experimental test data (see Plates IIIa and IIIb). In the third stage, the FE results indicate damaged elements at the two sides of the damaged core, which corresponds to the saw cut in the third damage stage.
4.7.3 Step 3: Damage quantification
Assuming that the damaged elements have the same damage severity, the DSCF method can be further applied for damage quantification using the FEA data. The damage quantification results, based on the damaged elements indicated in Step 2, is shown in Fig. 4.10. As shown in Fig. 4.10, the damage quantification results from both the FEA and experimental data show the same trend, i.e., the damage severity increase consistently with the Damage Stages 1 to 3. The damage quantification results based on the experimental data are also shown for comparison. It can be seen that in Damage Stages 1 and 2, both the experimental and numerical damage quantification results show close agreement with each other; while in Damage Stage 3 the results show considerable discrepancy due to their differences in the damaged element indication and modal eigenvalue change ratios. Based on the FEA data, the core crashing can induce over 90% stiffness reduction in the damaged elements.
4.8 Conclusions
In this chapter, a DSCF-based damage identification method is proposed, and it is then applied to the experimental and numerical modal analysis data for damage localization and quantification of an as-manufactured FRP sandwich deck panel. Both the experimental and numerical finite element modal analyses are adopted to examine the dynamic vibration modes of the FRP sandwich deck panel. The concluding remarks on this study are summarized as follows:
1. The DSCF-based damage identification method can be easily and effectively applied to the experimental and numerical FE modal analysis data for both damage localization and quantification.
2. It is also shown that using the partial strain energy in the dominant direction of a pure bending mode can be used with the DSCF-based damage identification. It thus makes the implementation of surface-based piezoelectric sensors and their strain mode shape measurement along only one direction more feasible.
3. The surface-bonded PVDF sensor network and impact hammer system can be effectively used to capture modal frequencies and curvature mode shapes for the DSCF-based damage identification method.
4. The detailed FE model can be used to accurately predict the free vibration of the FRP sandwich deck panel with sinusoidal core. The shear bolt connections at two transverse supporting ends can be simplified as simply supported boundary conditions.
5. In damage quantification, to avoid non-uniqueness, the assumption of uniform distribution of damage severity on damaged elements is made to reduce the number of unknown parameters in this study. Further study is needed for the damage severity distribution pattern.
6. Studies toward the development of a real-time structural damage identification system using the DSCF-based damage identification method and piezoelectric sensor array for in situ application are promising, and they should be the subjects of future research.
4.9 Acknowledgments
This study is partially supported by Alaska University Transportation Center (AUTC) and US Department of Transportation (Contract/Grant Number: DTRT06-G-0011). The authors also want to acknowledge the support from Dr Jerry Plunkett of Kansas Structural Composites, Inc., who fabricated the FRP sandwich deck panels used in this study.