
If you’ve read the chapter on buffers, you know that they can be a benefit or bane, depending on a lot of factors. When buffers in a switch become a problem, it can be very difficult to isolate the problem, since there usually aren’t detailed counters that show the buffer contents. When running QoS on routers, there are all kinds of commands to run that will show you the status of your buffers, but those buffers are software constructs that take memory from the system. The buffers I’m referring to here are hardware switch interface buffers. Let’s dig in and I’ll show you what I mean.
Here’s the output from the show
interface command on an Arista 7124SX. As you can see, there is no
mention of buffers:
Arista#sho int e5
Ethernet5 is up, line protocol is up (connected)
  Hardware is Ethernet, address is 001c.7308.80ae
  Internet address is 10.10.10.5/24
  Broadcast address is 255.255.255.255
  Address determined by manual configuration
  MTU 1500 bytes, BW 100000 Kbit
  Full-duplex, 100Mb/s, auto negotiation: on
  Up 1 days, 20 hours, 57 minutes, 59 seconds
  Last clearing of "show interface" counters never
  5 minutes input rate 183 bps (0.0% with framing), 0 packets/sec
  5 minutes output rate 45 bps (0.0% with framing), 0 packets/sec
     828028 packets input, 1130495492 bytes
     Received 6 broadcasts, 8355 multicast
     0 runts, 0 giants
     0 input errors, 0 CRC, 0 alignment, 0 symbol
     0 PAUSE input
     855277 packets output, 1187043452 bytes
     Sent 3 broadcasts, 8729 multicast
     0 output errors, 0 collisions
     0 late collision, 0 deferred
     0 PAUSE output
Why is there no mention of buffers? I didn’t write the code, but I can
guess that the status of the interface buffers changes at the microsecond
level, so between the time you start to hit the Enter key, and the time you
finish, the status of the buffers likely changed. Any information put into
the output of the show interface command
would be woefully outdated by the time it gets presented.
That’s all well and good, but having lived through microburst events that caused performance problems, I can tell you that I would have given my right arm for useful tools. OK, maybe not my entire right arm, but believe me when I say that the lack of visibility into these buffers is extremely frustrating. I’ve been through enough of these problems that I can smell them, but being unable to prove them makes it hard to get management to spend money to fix them. If only someone would make a switch that had real troubleshooting tools at the interface buffer level!
Latency analyzer (LANZ) is Arista’s solution to this problem. On the 7100 series of Arista switches, the ASICs allow visibility into the interface buffers at a heretofore unheard of reporting granularity of less than one millisecond. For those of you who can’t keep the whole micro/nano/pico thing straight, a millisecond is one thousandth of a second. That’s right, we can now get reports that show the status of our interface buffers one thousand times per second. Cool, huh? Sounds like too much information to me, but I’m a cranky old nerd. Let’s take a look and see how it works.
For my first example, I have a very simple network setup as shown in Figure 20-1. This network is comprised of an Arista switch hooked up to another vendor’s switch. The other switch is almost irrelevant for this test; it just happens to be a device I had available for testing.
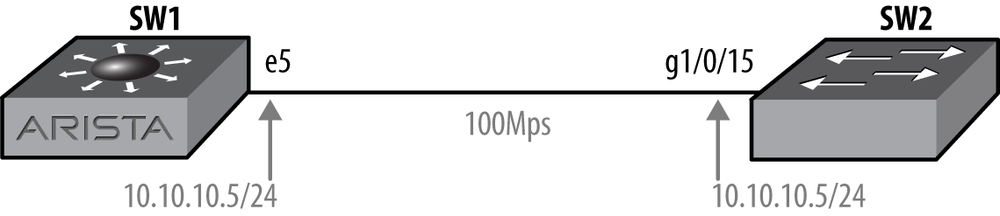
I’ve connected these two switches using copper. To accomplish this on
my 10 Gbps SFP-based Arista switch, I’m using a copper SFP. I’ve lowered the
speed of this interface down to 100 Mbps and assigned it an IP address. The
speed sfp-1000baset auto 100full command
tells the switch to only negotiate up to 100 Mbps full duplex when using the
1000 Base-T SFP I have installed:
Arista(config)#interface Ethernet5Arista(config-if-Et5)#speed sfp-1000baset auto 100fullArista(config-if-Et5)#no switchportArista(config-if-Et5)#ip address 10.10.10.5/24
For the sake of completeness, here is the configuration for the g1/0/15 port on the other switch (a Cisco 3750):
SW-3750#sho run int g1/0/15
Building configuration...

Current configuration : 103 bytes
!
interface GigabitEthernet1/0/15
 no switchport
 ip address 10.10.10.15 255.255.255.0
 speed 100
end
With my link set up, I dropped down to bash to initiate some traffic. This command sends one thousand 15,000-byte ping packets to the IP address 10.10.10.15. Note that I actually ran the ping command shown about 90 times. Since this is Linux, I used the ampersand at the end of each line so that each command ran in the background. This allowed me to run many of them at once, thus generating more traffic than I could with a single command. I call this technique the lazy man’s traffic generator. Sure, it’s crude, and it’s a bit slow to get going, but I didn’t have to download anything, install anything, configure anything, or otherwise waste precious time better spent yelling at clouds:
Arista#bashArista Networks EOS shell [admin@Arista ~]$ping -s 15000 -c 1000 10.10.10.15 > /dev/null &[1] 9054 [admin@Arista ~]$ping -s 15000 -c 1000 10.10.10.15 > /dev/null &[2] 9057 [admin@Arista ~]$ping -s 15000 -c 1000 10.10.10.15 > /dev/null &[3] 9060
While that spins up (it takes a while for all those streams to get
up to speed), let’s go in and configure LANZ. First, we need to enable the
feature globally. This is done with the queue-monitor length command:
Arista#queue-monitor lengthAt this point, LANZ is running and will record information when the proper thresholds are met. Next, we’ll configure LANZ on the interface connected to the other switch. This is done with a similar command that needs to include two threshold values, the lower threshold and the upper threshold:
Arista(config-if-Et5)#queue-monitor length thresholds 2 1This command can be a little baffling until you understand what the thresholds are referencing. The trick is to remember that your thresholds are being allocated in 512-byte segments (on this switch at least). The high threshold is the point at which LANZ will start recording. The low threshold is where LANZ will stop recording after the high threshold has been met.
To see the details of how big your buffer segments are, use the
show queue-monitor length status command.
This command will also show you the port thresholds for each interface. We
can see that the default high threshold is 512 segments, while the default
low threshold is 256 segments. We can also see that we’ve altered the
defaults on interface e5:
Arista#sho queue-monitor length status
queue-monitor length enabled
Segment size in bytes            :   512
Maximum queue length in segments :  3268
Port thresholds in segments:
 Port High threshold  Low threshold
  Et1            512            256
  Et2            512            256
  Et3            512            256
  Et4            512            256
  Et5              2              1
  Et6            512            256
  Et7            512            256
  Et8            512            256
  Et9            512            256
 Et10            512            256
[--- output truncated ----]
I set the thresholds very low so that we could see what they look like with very little traffic. In fact, I had to set the interface speed so low because these switches are so fast that I couldn’t get it to buffer sourcing packets at all from bash on a 10 Gbps interface. Actually, I never tried. I was too lazy to wait and figured that I’d get results more quickly with a slow 100 Mbps interface.
Back to our thresholds. The command I’ve entered will trigger reporting when two or more buffer segments are utilized, and logging will stop when one or fewer buffer segments are used on interface e5.
Now that my numerous, fat pings have had a chance to get up to speed, let’s take a look at the interface and see what sort of trouble I’ve caused:
Arista#sho int e5 | grep rate
  5 minutes input rate 8.06 Mbps (8.2% with framing), 718 packets/sec
  5 minutes output rate 8.70 Mbps (8.8% with framing), 777 packets/sec
My multiple background ping processes have generated over 8 Mbps of traffic. Note that if you try this on your own switch (please don’t do this in a production environment), it will take a few minutes for the traffic to ramp up to this level.
Note
One of my favorite features of Arista’s EOS is the way in which it
displays traffic rates with the show
interface command. I am so tired of looking at numbers like
8374625374 and trying to figure out if that’s megabits, or gigabits, or
tens of gigabits. I mean, would it kill them to put in some commas? Also,
how cool is it that the output shows us the percent utilization in simple
English? This is one of the many things that Arista just gets
right.
With some respectable traffic flowing, let’s see what LANZ can do
for us. To see the status of the buffer on interface e5, use the show queue-monitor length
interface command:
Arista#sho queue-monitor length e5 | more

Report generated at 2012-05-08 23:34:52
Time                          Interface   Queue length
                                          (segments, 1 to 512 bytes)
--------------------------------------------------------------------
0:00:00.01414 ago             Et5         18
0:00:00.01480 ago             Et5         35
0:00:00.01546 ago             Et5         22
0:00:00.02987 ago             Et5         6
0:00:00.03060 ago             Et5         22
0:00:00.03370 ago             Et5         3
0:00:00.03436 ago             Et5         19
0:00:00.03513 ago             Et5         4
0:00:00.03537 ago             Et5         21
0:00:00.05032 ago             Et5         4
0:00:00.05098 ago             Et5         22
0:00:00.06885 ago             Et5         16
0:00:00.06955 ago             Et5         35
0:00:00.07025 ago             Et5         52
0:00:00.07156 ago             Et5         22
0:00:00.08607 ago             Et5         19
0:00:00.09646 ago             Et5         6
0:00:00.09713 ago             Et5         22
This output shows the timestamp for each measured interval, the interface, and the number of buffer segments used at that point in time. Take a look at the intervals on the left. The delta (difference) between the first two lines (0:00:00.01414 ago and 0:00:00.01480 ago) is 00.00066 seconds. That’s 0.66 milliseconds. Not too shabby!
To give a better indication of how granular this data is, have some
fun with the limit keyword to this command. On my switch, issuing the
sho queue-monitor length e5 limit 1
  seconds
command yields 243 lines of data. For those of you who
like to do math in your head, remember that LANZ is only recording buffer
levels when the upper threshold (2) has been met, and has not fallen below
the low threshold (1). If the buffers were to remain empty for half of a
second, then there would be many fewer lines. Similarly, if I were trying to
pump 10 Gbps through my 100 Mbps link, the buffers would likely be higher
more consistently:
Arista#sho queue-monitor length e5 limit 1 seconds

Report generated at 2012-05-09 00:10:21
Time                          Interface      Queue length
                                             (segments, 1 to 512 bytes)
-----------------------------------------------------------------------
0:00:00.00480 ago             Et5            16
0:00:00.00508 ago             Et5            22
0:00:00.00974 ago             Et5            6
0:00:00.01041 ago             Et5            22
0:00:00.01628 ago             Et5            3

[--- many pages of buffer detail removed ---]

0:00:00.97528 ago             Et5            22
0:00:00.98436 ago             Et5            6
0:00:00.98509 ago             Et5            22
0:00:00.99172 ago             Et5            16
0:00:00.99189 ago             Et5            22
The output can also be limited to a set number of samples using the
samples modifier:
Arista#sho queue-monitor length e5 limit 10 samples

Report generated at 2012-05-09 00:12:20
Time                          Interface      Queue length
                                             (segments, 1 to 512 bytes)
-----------------------------------------------------------------------
0:00:00.00063 ago             Et5            6
0:00:00.00148 ago             Et5            22
0:00:00.02014 ago             Et5            6
0:00:00.02081 ago             Et5            22
0:00:00.02239 ago             Et5            6
0:00:00.02306 ago             Et5            22
0:00:00.02466 ago             Et5            6
0:00:00.02532 ago             Et5            22
0:00:00.05041 ago             Et5            6
0:00:00.05107 ago             Et5            22
After having some fun with LANZ, I decided to really kick things up a notch. I decided to initiate about 100 more ping commands, this time increasing the count to 10,000:
[admin@Arista ~]$ping -s 15000 -c 10000 10.10.10.15 > /dev/null &[2] 14382 [admin@Arista ~]$ping -s 15000 -c 10000 10.10.10.15 > /dev/null &[3] 14385 [admin@Arista ~]$ping -s 15000 -c 10000 10.10.10.15 > /dev/null &[4] 14388
Something interesting began to happen after I did this. Take a look at the Arista interface’s rate information:
Arista#sho int e5 | inc rate
  5 minutes input rate 9.36 Mbps (9.5% with framing), 834 packets/sec
  5 minutes output rate 15.7 Mbps (15.9% with framing), 1400 packets/sec
My Arista switch is sending almost 16 Mbps of nasty, huge ping packets, but I’m only receiving just over 9 Mbps of them back. What gives? Curious, I dug in to try and figure it out. LANZ reports that the buffers are filling, but are nowhere near capacity:
Arista#sho queue-monitor length e5 limit 10 samples

Report generated at 2012-05-09 00:23:16
Time                          Interface      Queue length
                                            (segments, 1 to
                                             512 bytes)
----------------------------------------------------------------------
0:00:00.01379 ago             Et5            13
0:00:00.01449 ago             Et5            31
0:00:00.01531 ago             Et5            21
0:00:00.02071 ago             Et5            10
0:00:00.02142 ago             Et5            27
0:00:00.02211 ago             Et5            44
0:00:00.02605 ago             Et5            19
0:00:00.02675 ago             Et5            37
0:00:00.02745 ago             Et5            22
0:00:00.03823 ago             Et5            1
There’s nothing unusual there. The entire show interface output doesn’t show anything either, other than the fact that I’m sending 1,407 packets per second and only receiving 855 packets per second. So where are all the packets going?
Arista#sho int e5
Ethernet5 is up, line protocol is up (connected)
  Hardware is Ethernet, address is 001c.7308.80b3 (bia 001c.7308.80b3)
  MTU 9212 bytes, BW 100000 Kbit
  Full-duplex, 100Mb/s, auto negotiation: on
  Up 1 days, 22 hours, 23 minutes, 17 seconds
  Last clearing of "show interface" counters never
  5 minutes input rate 9.59 Mbps (9.7% with framing), 855 packets/sec
  5 minutes output rate 15.8 Mbps (16.0% with framing), 1407 packets/sec
     3119601 packets input, 4343127595 bytes
     Received 6 broadcasts, 8609 multicast
     0 runts, 0 giants
     0 input errors, 0 CRC, 0 alignment, 0 symbol
     0 PAUSE input
     3723524 packets output, 5200954972 bytes
     Sent 5 broadcasts, 10820 multicast
     0 output errors, 0 collisions
     0 late collision, 0 deferred
     0 PAUSE output
I decided to look at the Cisco switch, since the Arista reported that it was sending fine, but not receiving all the replies. I discovered something interesting when I looked at the CPU histograms:
SW-3750#sho proc cpu hist
      11111
    9900000999999999999999999999999999999999999999999999999999
    9900000999999999999999999999999999999999999999999999999999
100 **********************************************************
 90 **********************************************************
 80 **********************************************************
 70 **********************************************************
 60 **********************************************************
 50 **********************************************************
 40 **********************************************************
 30 **********************************************************
 20 **********************************************************
 10 **********************************************************
   0....5....1....1....2....2....3....3....4....4....5....5....
             0    5    0    5    0    5    0    5    0    5
               CPU% per second (last 60 seconds)
Whoa! The Cisco 3750 is running hot with a continued CPU utilization of 99% to 100%. Why? Let’s look at the processes:
SW-3750#sho proc cpu sort
CPU utilization for five secs: 99%/5%; one mins: 99%; five mins: 98%
 PID Runtime(ms) Invoked uSecs   5Sec   1Min   5Min TTY Process
 177     2643245  286049  9240 68.15% 66.85% 65.61%  0 IP Input
 122    32341224 3901110  8290 14.07% 15.28% 15.41%  0 Hulc LED Proces
  55      328746 8866216    37  3.67%  3.09%  3.02%  0 Fifo Error Dete
  90     1616229  190855  8468  1.11%  0.95%  1.00%  0 hpm counter pro
  52       89821 4484423    20  0.63%  0.45%  0.41%  0 RedEarth Tx Man
  86       73310 1659407    44  0.31%  0.23%  0.25%  0 hpm main proces
 130      664725   38654 17196  0.31%  0.35%  0.37%  0 HQM Stack Proce
 123        1361  141810     9  0.15%  0.01%  0.00%  0 HL3U bkgrd proc
  39        1878 3840483     0  0.15%  0.01%  0.00%  0 DownWhenLooped
The top process is IP Input, which on a Cisco
switch means that many packets are being punted out of Cisco Express Forwarding (CEF) or Fast Switching and are being
handled by the processor. This is happening because I’m pinging an IP
address on the switch itself with a frightening amount of huge packets. To
be fair, this is not a valid test of switch performance because had I sent
these packets through the switch, instead of to it, they would have passed
through with ease.
Although it may be unfair to point out that the Cisco switch couldn’t
keep up with my ping onslaught, consider this: the Arista switch not only
delivered that onslaught with ease, it also generated it. Not only that, but
check out the output from the show proc top command
while all these pings were running:
top - 20:32:32 up 2 days, 6:04, 1 user,load average: 0.09, 0.04, 0.01Tasks: 275 total, 1 running, 274 sleeping, 0 stopped, 0 zombieCpu(s): 14.4%us, 2.5%sy, 0.0%ni, 81.0%id, 0.0%wa, 0.2%hi, 2.0%si Mem: 2043416k total, 1315056k used, 728360k free, 108020k buffers Swap: 0k total, 0k used, 0k free, 803792k cached PID USER PR NI VIRT RES SHR S %CPU %MEM TIME+ COMMAND 1994 root 20 0 187m 42m 19m S 8.0 2.1 242:34.22 PhyAeluros 1930 root 20 0 179m 34m 14m S 6.3 1.7 193:00.17 Mdio 1931 root 20 0 596m 55m 21m S 6.3 2.8 178:44.90 FocalPoint 1581 root 20 0 204m 80m 47m S 3.3 4.0 88:55.00 Sysdb 8286 root 20 0 174m 29m 13m S 2.3 1.5 1:28.56 FPLanz 8077 admin 20 0 206m 66m 32m S 1.7 3.3 38:26.16 Cli 1583 root 20 0 200m 63m 38m S 1.0 3.2 25:30.58 Fru 1624 root 20 0 172m 26m 10m S 1.0 1.3 24:37.63 AgentMonitor 1636 root 20 0 183m 31m 10m S 0.7 1.6 17:21.13 Lag+LacpAgen 1647 root 20 0 98.4m 58m 46m S 0.7 2.9 2:25.30 ribd 1955 root 20 0 178m 26m 7076 S 0.7 1.3 23:10.17 PhyEthtool 1580 root 20 0 177m 20m 2388 S 0.3 1.0 13:03.47 ProcMgr-work 1934 root 20 0 179m 33m 14m S 0.3 1.7 13:35.47 Smbus 1954 root 20 0 179m 33m 14m S 0.3 1.7 9:21.97 Adt7462Agent 1959 root 20 0 174m 30m 14m S 0.3 1.5 4:02.52 FanDetector 14042 admin 20 0 2296 616 492 S 1.5 0.0 0:00.29 ping 14296 admin 20 0 2296 620 492 S 1.5 0.0 0:00.21 ping
If you’re familiar with the Linux top command, then you’ll see that not only is the
Arista switch barely breathing hard, but ping isn’t even one of the top 10 processes!
Meanwhile it continues to shovel out so many packets that the 3750 can’t
keep up with them all:
Arista#sho int e5 | inc rate
  5 minutes input rate 9.85 Mbps (10% with framing), 878 packets/sec
  5 minutes output rate 15.9 Mbps (16% with framing), 1416 packets/sec
Back to the buffers on the Arista, all those numbers are cool, but I’d
sure like to see all that data in a graph. Luckily, the output can be
presented in CSV format with the csv
keyword on the show queue-monitor length
command. Note that with the csv keyword,
the oldest samples are displayed first, which is the opposite of what we’ve
seen previously:
Arista#sho queue-monitor length csv e5

Report generated at 2012-05-07 02:26:15
2012-05-07 02:06:09.48718,Et5,3
2012-05-07 02:06:09.50783,Et5,22
2012-05-07 02:06:09.50851,Et5,6
2012-05-07 02:06:09.52265,Et5,22
2012-05-07 02:06:09.52334,Et5,6
2012-05-07 02:06:09.54107,Et5,22
2012-05-07 02:06:09.54176,Et5,6
2012-05-07 02:06:09.57933,Et5,22
2012-05-07 02:06:09.58000,Et5,6
2012-05-07 02:06:09.58795,Et5,43
[--- output truncated ---]
I suggest that if you use this command, you either pipe it to more or redirect it to file. I suggest this
because using the csv keyword will report
the last 100,000 over-threshold events, which is a lot
of data to watch on the console. To redirect the output to a file, use the
>> operator just like you would in
Linux:
Arista#sho queue-monitor length csv >> file:/home/admin/CSV-GAD.txtA quick look into bash reveals that my file is now in the directory specified:
Arista#bashArista Networks EOS shell [admin@Arista ~]$ls -lhtotal 3.2M -rw-rw-rw- 1 admin eosadmin 3.2M May 8 21:29 CSV-GAD.txt
Note
If you want this file to survive a reboot, you’ll need to place it somewhere on /mnt/flash/.
That’s a 3.2 MB .txt file. Aren’t you glad I didn’t paste the whole thing into this book? Taking a look at the first few lines, we can see that it looks similar to the previous output:
[admin@Arista ~]$ head CSV-GAD.txt
Report generated at 2012-05-09 01:29:14
2012-05-09 01:22:47.60513,Et5,4
2012-05-09 01:22:47.61294,Et5,22
2012-05-09 01:22:47.61405,Et5,25
2012-05-09 01:22:47.61474,Et5,7
2012-05-09 01:22:47.62090,Et5,22
2012-05-09 01:22:47.62110,Et5,18
2012-05-09 01:22:47.62594,Et5,22
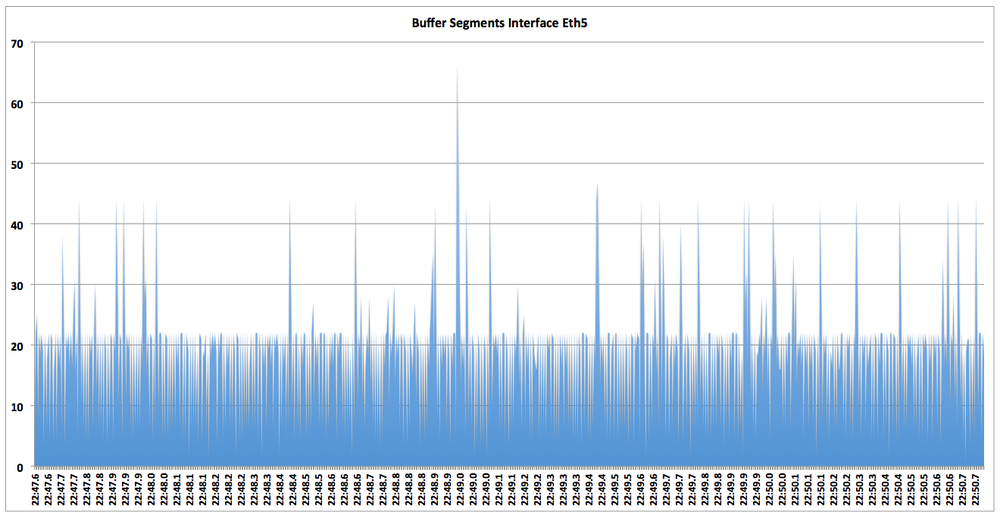
2012-05-09 01:22:47.62603,Et5,19Using a small chunk of this data, I copied it, imported it into Excel, and created the quick and dirty chart in Figure 20-2. While this is a rudimentary example of what can be done, it shows what CSV can be used for.
Creating Excel charts from data gathered at the CLI is fun, but it is limited in its usefulness. If your network is massively congested, the last 100,000 samples might be a small amount of time. Remember that this file may contain the buffer information for every interface on the switch and, as we’ve seen, in a congested network these entries add up quickly. What would be more useful would be the ability to stream all this data elsewhere. Luckily, the folks at Arista had this in mind when they built this feature.
As you’ve seen, LANZ can output a lot of data in a short amount of time. Because of this, the people at Arista decided that typical logging solutions like Syslog couldn’t keep up with the data flow. Instead, LANZ is streamed using something called Google Protocol Buffers (GPB). Configuration of a GPB client is beyond the scope of this book, but setting up LANZ to send to such a client is not.
To enable LANZ streaming, enter queue monitor streaming mode with
the queue-monitor streaming
command:
Arista(config)#queue-monitor streamingThere’s really not much else that needs to be done, and not much else that can be done. Here are all the options for this mode:
Arista(config-qm-streaming)#?
  comment          Up to 240 characters, comment for this mode
  default          Set a command to its defaults
  exit             Exit from Queue-monitor streaming configuration mode
  help             Description of the interactive help system
  max-connections  Set maximum number of client connections
  no               Negate a command or set its defaults
  show             Show running system information
  shutdown         Disable queue-monitor streaming
  !                Append to comment
In a nutshell, by enabling this mode, a server runs on the switch that
listens on port 50001. GPB clients connect to the switch, after which LANZ
streaming publishes buffer events to the client. You can limit the number of
clients that can connect at any given time with the max-connections command (the default is
100):
Arista(config-qm-streaming)#max-connections 10Finally, to enable LANZ streaming, issue the no shutdown command from within the mode, and then
exit:
Arista(config-qm-streaming)#no shutdownArista(config-qm-streaming)#exitArista(config)#
At this point, the LANZ streaming server is active. You can see if the
streaming service is listening by using the bash netstat command to see if the switch is listening
on port 50001. Here’s the output with LANZ streaming configured and
active:
Arista(config)#bash netstat -na | grep 50001
tcp        0      0 0.0.0.0:50001          0.0.0.0:*            LISTEN
Now, I’ll shut the service off and issue the same command:
Arista(config-qm-streaming)#shutArista(config-qm-streaming)#bash netstat -na | grep 50001'netstat -na | grep 50001' returned error code:1
Though this test is not fool-proof, it will show if the switch is
listening on port 50001. Unless you’ve configured another service to listen
on that port, the test should work as advertised. Of course, you can always
use the show active command from within
the queue monitor streaming configuration mode, too:
Arista(config-qm-streaming)#sho active
queue-monitor streaming
   no shutdown
Personally, I like to see what Unix thinks.
Though LANZ is only available on the 7100 series of Arista switches, a new feature called LANZ Lite will be available on the 7058 and 7500 series switches at the end of 2012. It was not available at the time of this writing. LANZ Lite will not have the same microsecond granularity as LANZ, but it will offer visibility into buffer utilization, which is still a massive improvement over other vendors who don’t offer anything.
Lastly, LANZ is a licensed feature, so make sure your license fees are paid up before you reap its benefits.