
sFlow is an open source sampling tool that provides constant traffic flow information on all enabled interfaces simultaneously. sFlow data is sent from the switch by a process called an agent in sFlow parlance. The sFlow data is sent to a collector that usually formats the data into cool-looking charts and graphs while recording and reporting trends for use in diagnostics, troubleshooting, and analysis. sFlow is defined in RFC 3176, and because it’s an open source tool, there are many agents and collectors out there, some of which are free, and some of which cost tens of thousands of dollars. If you’re thinking that this all sounds like Cisco’s NetFlow, you’re right, but sFlow is open source, while NetFlow is Cisco proprietary.
The agent within the switch samples packets from the data flows, and then forwards the headers of those sampled packets to the collector at regular intervals. The sampling is just that, a sample packet from the data flows and not a copy of every packet. The number of packets sampled from the total packets seen is called the sample rate, which can be configured with the default being about 1 in every 65,000 packets. These packets are stored and then sent to the collector at a configurable interval called the polling interval. The default polling interval is two seconds.
Not all packets or flow types are sampled. Packets that are sampled include frames sent to the interfaces or CPU of the switch, routed packets (with certain exceptions), flooded packets, and multicast packets. The following packet types are not sampled by sFlow:
LACP frames
LLDP frames
STP BPDUs
IGMP packets
Ethernet PAUSE frames
PIM_HELLO packets
Frames that have CRC errors
Packets dropped by ACLs
Packets dropped due to VLAN violations
Routed packets with IP options or MTU violations
In order to see sFlow in action, you’ll need a collector. If you’re just messing with one in a lab, any of them will do. For his chapter, I downloaded sFlowTrend, which is a free tool that can be found at http://www.immon.com. Of the four or so that I tried, this was the easiest to set up and get working, and it’s actually free (not just a time-limited demo). As I like to say, free is better than not free.
I set up my lab with the following IP addresses:
Arista switch: 192.168.1.188
sFlow collector: 192.168.1.100
The first step in configuring sFlow on the switch is to tell
the switch where the collector is located. This is done with the sflow destination ip-address
port# global configuration command. The port number is
optional, and defaults to 6343. Since I’m fine with that port, I’ll just
include the IP address:
SW1(config)#sflow destination 192.168.1.188Next, I’ll configure the agent source. This can be either an IP address
or an interface (but not both). To configure a source IP address, use the
sflow source
ip-address command. To specify a source
interface instead, use the sflow
source-interface interface-name
command. I’ll be using the source interface options and
specifying the Management1 interface:
SW1(config)#sflow source-interface Management1To get sFlow running, we’ll need to use the sflow run command:
SW1(config)#sflow runAt this point, the collector should be receiving sFlow packets from
the switch. There are two more items that can be configured globally, but
you probably won’t mess with them unless you need to. The first is the sflow
polling-interval seconds command. The
polling interval is how often the switch sends its collection data to the
collector. The default value is two seconds and can be configured for
anywhere from 1 to 3,600 seconds. This can be useful if your collector
becomes overwhelmed when hundreds of devices are sending sFlow data to it.
Here I’ll set my switch to a polling interval of five seconds:
SW1(config)#sflow polling-interval 5The next option that can be configured is the sample rate. By default, the switch samples (on average) one out of every 65,526 packets. If you’d like to lighten the load on the switch and provide less granular data to the collector, you can raise that number so that it samples less often. Or, you could lower the value to get more granular data. The values that you can use are anywhere in the range of 16,384 to 16,777,216. Here I’ll set the sample rate to 1 in every 16,384 packets:
SW1(config)#sflow sample 16384If you really want to throw caution to the wind, you can set it to
any value you’d like by including the dangerous keyword, followed by the value of your
choosing (well, from 1 to 4,294,967,295 anyway). I’m feeling especially
dangerous today, so I’ll set my sample to a very dangerous level of 1 in
100 packets:
SW1(config)#sflow sample dangerous 100Warning
Configuring sFlow with such a low value is, in fact, dangerous, especially in a production environment. sFlow is a process that runs on the switch, and if the sample rate is set too low, that process can monopolize system resources. I can play with any value I want because my network consists of a few routers and an Arista switch with a collector attached. I could say something like, “Don’t try this at home!”, but in this case, home is about the only place that I would recommend you try this.
Though sFlow is enabled globally, it can be disabled on individual
interfaces. To do so, issue the no sflow
enable command in interface configuration mode. Here, I’ve
disabled sFlow on interface Ethernet10:
SW1(config)#int e10SW1(config-if-Et10)#no sflow enable
To re-enable sFlow on the interface, use the sflow enable command (which is the default):
SW1(config-if-Et10)#sflow enableTo see what interfaces have sFlow enabled, use the show sflow interfaces command:
SW1#sho sflow interfaces
sFlow Interface (s):
--------------------
Ethernet1 - running
Ethernet2 - running
Ethernet3 - running
Ethernet10 - running
Ethernet11 - running
Note that only active interfaces are shown, and if you’ve disabled
sFlow on an interface with the no sflow
enable command, it will not show up in the list.
After letting my switch send sFlow data for about an hour, I
issued the show sflow command, which
produced the following output:
SW1#sho sflow
sFlow Configuration
-------------------
Destination(s):
  192.168.1.100:6343
Source IP: 192.168.1.188 from Management1
Sample Rate: 100
Polling Interval (sec): 5.0

Status
------
Running: Yes
Polling On: Yes
Sampling On: Yes ( default )
Send Datagrams: Yes
Hardware Sample Rate: 128

Statistics
----------
Total Packets: 1548560
Number of Samples: 1891
Sample Pool: 1290496
Hardware Trigger: 1891
Number of Datagrams: 8770
The first paragraph of output shows all of the configuration changes we made, including the destination, the UDP port in use (port 6343 is the default), the sampling rate, and the polling interval. The rest of the output shows status and statistics, which can be useful when troubleshooting to make sure that the switch is actually sending packets.
There is also a show sflow
detail command, which shows exactly two more lines of
information, both of which I’ve highlighted in bold:
SW1#sho sflow detail
sFlow Configuration
-------------------
Destination(s):
  192.168.1.100:6343
Source IP: 192.168.1.188 from Management1
Sample Rate: 100
Polling Interval (sec): 2.0 ( default )

Status
------
Running: Yes
Polling On: Yes
Sampling On: Yes ( default )
Send Datagrams: Yes
Hardware Sample Rate: 128
Hardware Sampling On: Yes

Statistics
----------
Total Packets: 1555303
Number of Samples: 1893
Sample Pool: 1290752
Hardware Trigger: 1893
Number of Datagrams: 13198
Number of Samples Discarded: 0
With sFlow configured, I proceeded to generate some traffic in order to see how my collector was working. Figure 21-1 is the sFlowTrend dashboard that shows the top interfaces by utilization and total frames.
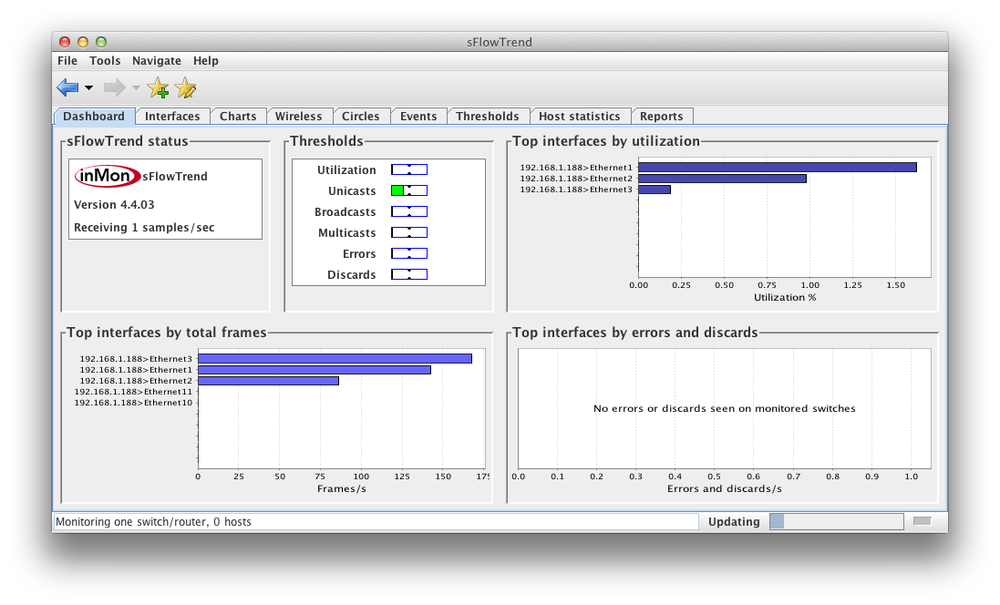
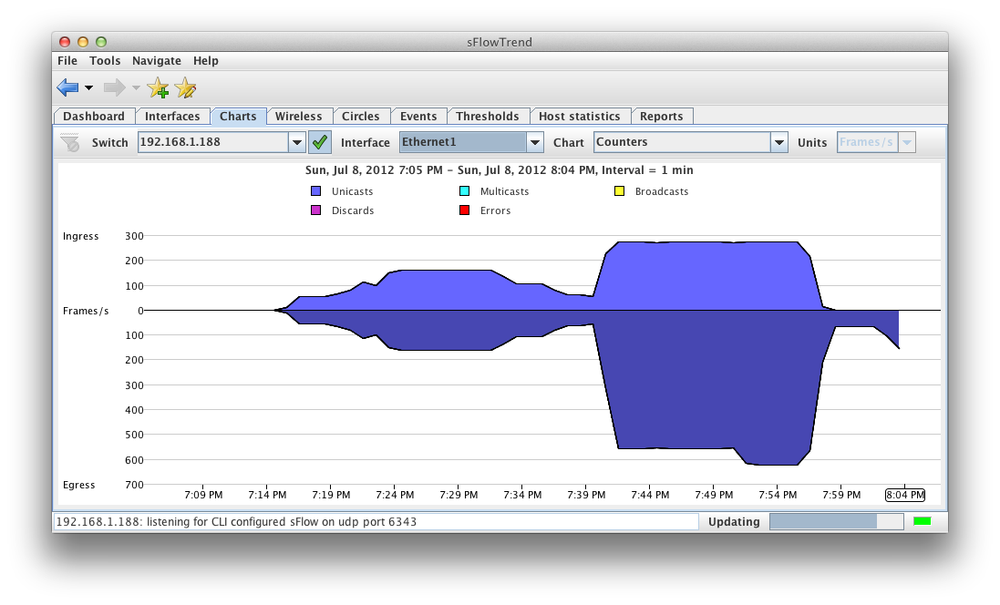
Figure 21-2 shows the counters chart from sFlowTrend for interface Ethernet1. In a production environment, there would also be very interesting charts and graphs showing communication pairs, top talkers, and a variety of other useful stats. Sadly, my underground lair only has a small number of hosts, and the resulting graphs were too embarrassing to include.
sFlow is a powerful tool that allows third-party tools to display useful data about the traffic moving through your switches. In the future, sFlow may play an important roll in concepts like Software Defined Networking (SDN) when used in conjunction with other open protocols such as OpenFlow. Knowing how to get the sFlow data to a collector will allow you to get better visibility into the traffic patterns that exist on your network today.