
Once, a leader was the person who could convince others to act in the absence of data. Today, the leader is the person who can ask the right questions.
You have data and you have metrics based on this data. But neither will help you to get the value of data if you do not have the right question. Let’s look at a typical example of a metric: “views on YouTube.” What do millions of views on one YouTube video mean?
It could mean a hit music song at the top of the charts. For example, Justin Bieber’s “Baby” was the most-watched video on YouTube as of late 2012, with over 800 million views, and was a triple-platinum hit, selling over 3 million digital downloads.
It could mean a successful product. After Utah dentist Dr. Bob Wagstaff tried and failed to market his Orabrush tongue brush through traditional advertising, a series of quirky YouTube videos about how it cured bad breath helped it launch as a successful online product and later gain national distribution in chain stores. Today Orabrush has sold over two and a half million units, and its videos have been watched more than 50 million times.[155]
But it could also mean very little. The music video “United Breaks Guitars,” a song detailing Canadian musician Dave Carroll’s failed attempts to get compensation from United Airlines when baggage handlers damaged his expensive guitar, was a runaway viral hit with over 10 million views and a major public relations disaster for United, which we discussed in more detail in Chapter 4. However, neither the song itself nor a subsequent book by the same name reached bestseller status.
In each of these cases, the question, “How many views did we get on YouTube?” would not necessarily have been the right question to ask. Views on YouTube is a metric that might lead to invalid conclusions if you are trying to understand the underlying business question. What do you want to achieve? Justin Bieber wanted to create awareness during the launch of his new album. Thus the viewership data reflected a broader launch strategy to promote his music. The created awareness could be harvested by the channel strategy of his music label. OraBrush, on the other hand, needed more than just awareness. Dr. Bob Wagstaff needed to first educate his potential customers about the reasons bad breath exists. Thus the purpose of the video was educational and not just for it to go viral.[156] He kept the same approach through all different media channels.[157] And Carroll’s video, while it certainly boosted both his music and speaking career, serves as evidence that social media popularity does not automatically equate to commercial success.
This underscores the most important task in any analysis: you need to be clear about the question to ask. Often a measurement such as the number of views on YouTube is a number that will not mean anything if there is not a relevant underlying business need or business question associated with it.
During the 2010 World Economic Forum in Davos, Switzerland, the director Adrian Monck (@AMonck) looked over some daily reporting and said, “1,300 tweets in one day? So what? What does this mean for me?” A single number did not make any sense to Monck and it surely failed the “so-what” test; social media exposure or being talked about is not an end in itself. Too often we have seen that technology is leading a data investigation. New technology seems to generate new insights, with people analyzing something just because it’s possible. However, it should be the way around, that the question determines the measurement.
In The Right Question, we will discuss what makes a question the right question. In short, there are two types of questions: benchmarks (how did we do compared to…) or predictions (what will happen…).
Thus for Adrian Monck from the World Economic Forum, it would be more useful to put this number of 1,300 tweets in the context of benchmark. Has a given idea, topic, or argument discussed during a World Economic Forum been placed sufficiently within the media? And if not, why not? To begin to answer this benchmark question, you would need to compare those 1,300 tweets with the number of tweets on another subject or with the number the same subject received last year and so on. Only then would you get an insightful answer.
To formulate the objective, aim, or question, as we will call it from now on, is the most fundamental challenge for any data-mining project. That also makes it the subject of the first chapter in this book. We will begin to explore that challenge by examining a case study.
In May 2010, the CEO’s office of a major company in Europe approached us. They wanted to measure social media. Short of a real question of what they wanted to measure, we gave them just numbers like how the CEO got 450 mentions within the last two weeks. But that was surely not helpful. The fact that he got 450 mentions would have failed any “so-what” test. Potential questions could be:
- Benchmark
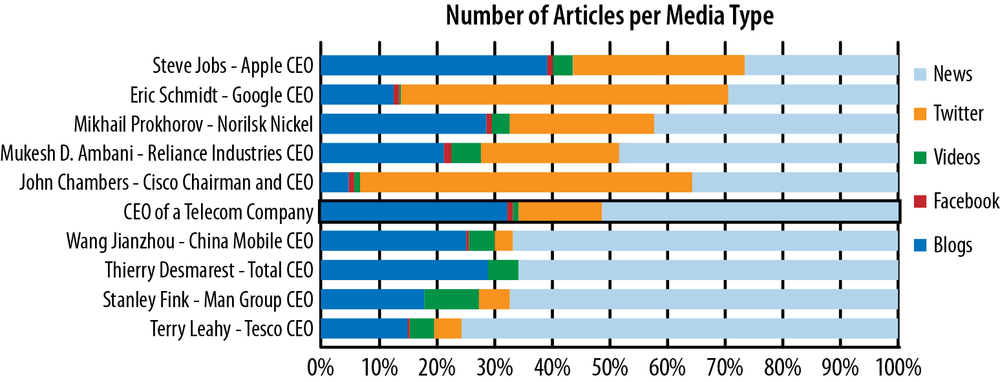
Is the CEO a laggard in social media compared to other CEOs? The answer to this question would have been “no.” You can see in Figure 8-1 the comparison of the top 50 CEOs as defined by Harvard Business Review[158] and their presence in news and social media.[159] The more the CEOs are publicly discussed overall, the higher their social media split is. Steve Jobs, for example, was at that time the most discussed person, with about 90,000 articles during the two weeks surrounding HBR’s 2010 study. The majority of those articles were within social media. The average split between user-generated content and news was about 51% for all top CEOs. The CEO in question had a social media profile that fit right in with 50%, so he was likely not lagging.
- Predictive
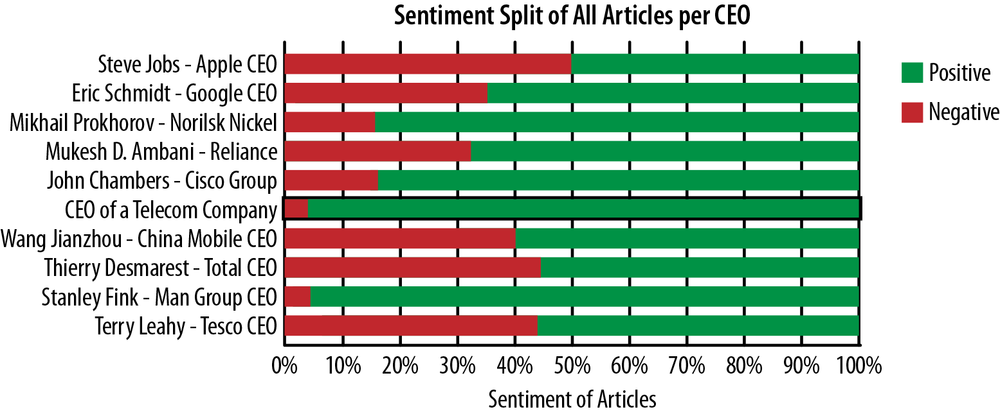
Is there a PR issue in the making? This is a question about the future and, as we saw in Chapter 7, those predictions are very hard to make. We can, however, try to analyze the amount of negative sentiment. Most of the sentiment algorithms in the market are not worth their money and are often misleading, as we observed in Chapter 4. For our CEO, we used a standard algorithm to get a first indication whether there was enough negative sentiment in the discussion that we could conclude that there was an issue. The answer to this question seemed to be “no,” as one can see in Figure 8-2.[160]
Without any substantial analytical findings, the data analysts started to read social media content. Reading and judging human-created content does not seem scalable, nor does it seem objective and so it would be surely a bad measurement, but it supplies ideas about some things that might be interesting to look at.
There were a few nasty social media actions taken against this CEO. There were very negative fake Facebook identities and Twitter parodies. The number of messages, as well as the reach of those messages, was small in the overall reach of the CEO’s brand, but the messages themselves were highly aggressive.
What had happened? All the negative commentary had started to gain traction in February. The CEO had just given a talk at a business school, where he had supported the idea to charge more for some kind of traffic:
Internet search engines use our networks without paying us anything (…) This can not continue (…) This will change (…).
—CEO
Over the subsequent quarters, the CEO had seen that the stock price of his telecom company was outperformed by Google and other Internet giants, using the capabilities of the infrastructure they and other network operator had built. There was an imminent risk for any network operators to just become the commodity bit pipe. The aim of the CEO was therefore to change the tariff system to participate in the value of the data channeled through networks. This approach is not without controversy. It has become known as the discussion about net neutrality.
A change in price structure can’t be done without support in the market from other competitors. Thus he tried to reach out to potential allies in his quest to regain a better position in the value chain. During his university speech, he started to call out for change. Similar statements on other occasions such as the Mobile World Congress followed.
The opponents of his idea saw freedom of speech as being in danger. Many started to rally against his idea, prompted either by professional opinion or personal conviction. The fake Facebook identities and Twitter parodies were a consequence of his initial talk and the rally against his ideas.
Only now and with this background knowledge in mind could we start to ask useful questions such as the following:
Was his message to change the tariff structure heard and supported? Who picked it up? Who supported it? Who opposed it?
Are the negative comments he is getting from his opponents a threat to his quest?
Let’s focus on the first question. To analyze this situation further, you need to make it measurable beyond anecdotal evidence. You either have to redefine the data (as we discuss in Chapter 9) or redefine the sentiment measure (as we discuss in Chapter 10). Looking at the origin of the negative comments and the satirical parodies, we decided to change our data set to only look at discussions evolving around net neutrality.
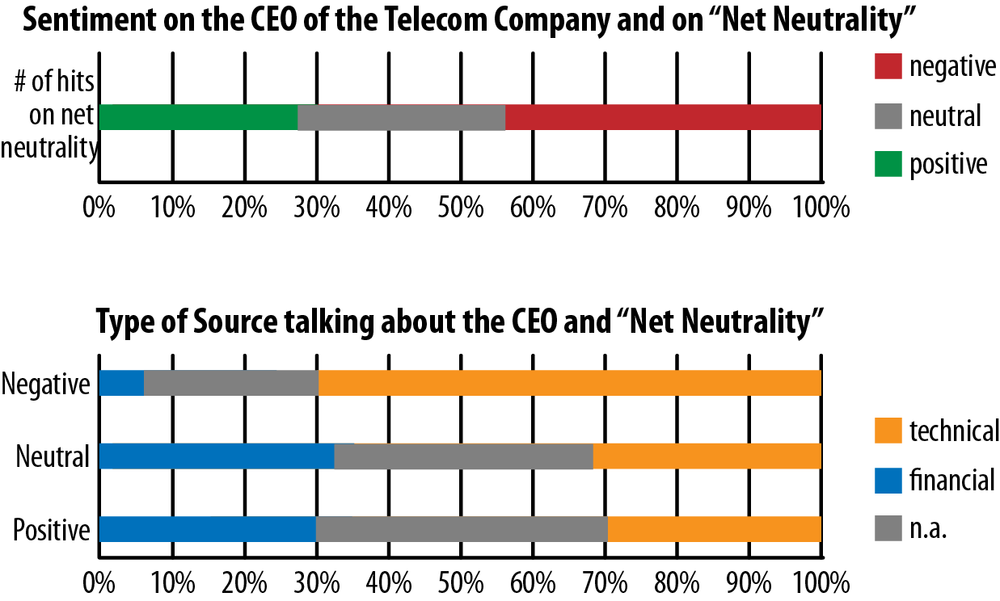
We created a subsection within the data on our CEO and reduced it to only those discussions. By doing so, it became quite clear that there was a highly negative debate going on. Did this mean that his attempt to end net neutrality failed? Not necessarily. Let’s introduce a metric classifying the source. We will talk more about the role of measurement in Chapter 10. The classification analyzes what the sources say, tweet, or write when they do not talk about the CEO. The source comments clearly revealed two types of sources: one group was financially focused, and the other group was tech-focused.
You can probably already guess without looking at Figure 8-3 that the financial sources were mostly positively disposed toward his idea because a change in tariff structure would mean an improved share price and share outlook for the telecom company. We can thus conclude that the CEO had made a good impression with the business media. If we reduced the sources even further and only looked at top news sources that would most likely get read by other CEOs, we would see an overwhelming number of positive to neutral reactions. Also, many in the business news media had recognized his approach, and thus we can assume as well that the people he wanted to reach heard his call to challenge the status quo of net neutrality.
And indeed, many other CEOs from telecom companies followed his example and took a position against net neutrality. For example, Vittorio Colao, at that time the president of Vodafone, called publicly for all “to revise the value chain” of the Internet. Politicians also got involved. Spain’s minister of industry, Miguel Sebastian, prepared a statement for the European Commission. He explained that content providers such as Google’s YouTube should contribute some of the investment in network infrastructure. Those statements got support not only from Jacques Toubon, former French culture minister, but also from French president Nicolas Sarkozy, who called for a “Google rate.”
In sum, we could say that the CEO’s outreach on net neutrality had reached its target. The negative reaction had been a kind of “collateral” to this discussion. A second benchmarking question could be how bad this collateral was. We discussed how to measure this in Chapter 3. In this case, however, volume and intensity were within expected norms.
As could be seen in the case of this telecom company, it is not always easy to formulate a question, but without a question, an answer will almost never be useful. Even worse, we can be lulled into thinking that social media metrics themselves form the answer, in much the same way that in Douglas Adams’ bestselling book, The Hitchhiker’s Guide to the Galaxy, the computer Deep Thought calculated the answer to the ultimate question to “life, the universe and everything” as being 42.
That is not a question. Only when you know the question will you know what the answer means.
So how to formulate the question? There are two major approaches to finding the question. Either you look at the data and try to find something interesting, using a process known as creative discovery, or you formulate the question using your business sense, also often called domain expertise.
Creative discovery is an effort to find something which was not known before. In a simple way, reading through selected tweets and Facebook posts to find something interesting, as we did in the preceding example, counts as creative discovery.
This process, however, is often done in a more structured way, as described by statistics. The aim of statistics is to describe data with a few numbers such as the mean or median. As we saw in the example with our telecom company, the simple metrics such as average number of articles per period or number of negative articles per period did not tell us much. One of the more complex ways to describe data is to describe the different features, or variables, of a given data set.[161] These variables are then examined in relationship to one another to see whether there is a dependency. However, these metrics do not necessarily reveal any insights, as shown by the statistician F.J. Anscombe. He demonstrated that data as diverse as that in Figure 8-4 can still share the same statistical properties; therefore, it can have the same mean, variance, correlation, and regression line.
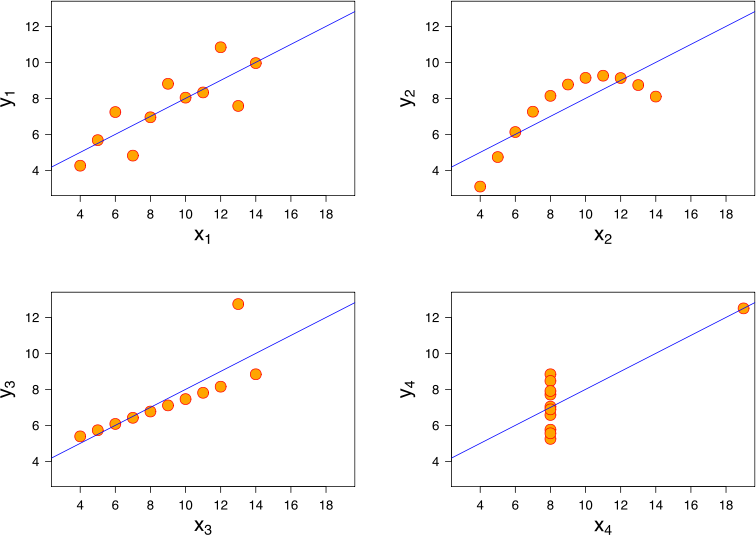
Figure 8-4. Data with the same usual statistical properties—mean, variance, correlation, and regression line (Courtesy of Wikipedia.)
If statistical measures and metrics do not reveal anything of interest, the process of creative discovery can turn to charting data. The human eye is often more helpful in discovering dependencies than elaborate data-modeling techniques. Thus data scientists use visualization tools to display the data in two- or three-dimensional spaces. By now there are many ways of doing such a visualization: you can use simple tools like the data-mining user interface for Rattle from R or good full-blown visualization tools like Tableau Software.
Creative discovery seems to carry a very strong and powerful promise: that by working with data, you will find something new and interesting. The way you will approach it is by taking your data and cutting and slicing it into different segments. Within each segment, you will compare and group different data points.
One of our clients actually planned to give the data team a target of three interesting findings every month. This is wishful thinking and probably as useless as to expect Christopher Columbus to find one America every decade. As the word “discovery” implies, not every search will result in something interesting. Very often the outcome is just a lot of hairballs, which is the term you use for a totally uninspiring image of dots and lines.
Our client thought that three findings a month might be feasible due to the widely publicized success stories on creative discovery. One of these newer stories was the newly created model from a leading camera manufacturer. The company introduced a waterproof pocket video camera. The idea for this product came as the company’s marketing teams studied the social media conversations around their brand. They found that people were often not daring to take the expensive models on sports trips. Thus the idea to create a waterproof pocket camera was born.
Please do not become lulled into thinking that you simply click a button on a black box and a new product idea emerges. From this story alone, you can tell that there were no metrics or statistical formulas involved. The process required reading all of those tweets, and it was a very manual process. This camera brand most likely was discussed hundreds if not thousands of times. You can use technology to group and sort those discussions, but to find the few discussions of people stating publicly that they would love to take the more expensive camera on a sports trip but did not dare to do so is like finding a needle in a haystack. It takes luck and many hours.
Especially in the area of social media content, new services and startups have surfaced that have promised to automate this, so far, manual process of creative discovery. The promise of their software is to automate the finding of unknown areas of customer needs or concerns and thus to spot new ideas easily.
We believe that those promises will fall short because the complexity of human language renders this approach very difficult, if not impossible, most of the time. It might work if the area of discussion is highly predictable and specialized and there are not too many different ways to talk about it. In the case of the usage of a camera, creative discovery, as we discussed earlier, cannot be automated, at least not with today’s technology and resources.
A good metaphor for creative discovery, particularly with online social media, is the analysis of computer network behavior. Creative discovery would be to spot network communication that can’t be considered normal or standard. And research agrees that the best way to spot an intruder into a computer system would be to look for the not normal behavior. However, as Robin Sommer from the Berkeley Lab described, this approach has remained theoretical and is seldom used in real-life applications. Unfortunately, network transactions are so complex and individual that it is very difficult to differentiate between legitimate or criminal use. In much the same way, the dream of automated creative discovery from social media data often faces a difficult reality in the real world.
Domain knowledge is a second means of formulating the right question. Overall, it helps to have the right background knowledge. The CEO’s office from our telecom company could have formulated the question at stake more easily than Fisheye Analytics could due to specific domain knowledge about the industry, the company’s goals, and the CEO’s history of intentions and actions.
The value of domain knowledge might best be described by the following example of email marketing. Within email marketing, the marketeer’s aim is to reach as many people as possible and create the highest buying conversion. A simple question to ask would be “What kind of content and what kind of mail addresses will create the highest opening rates?” While the question in this case is valid, the actual way of measuring the question might prove way more complex, as one might think. A domain expert will know that the measurement of opening is skewed by the actual email client. Different email clients will open an email at different points in time. Outlook™ will call an email open if it was loaded into a small preview window for a certain time, while for Gmail™ the user needs to actively click the email to open it.
Setting opening as an outcome metric and optimizing the system for the greatest number of openings would clearly create an incorrect result because it would most likely optimize the email to appeal to Outlook™ users.
While such an example clearly shows the advantage of domain knowledge, use of that knowledge is as difficult as it is with creative discovery. The massive data of unstructured social media content has created new opportunities for businesses. It has changed the way we do marketing (Chapter 1), the way we find new sales prospects (Chapter 2), and the way we communicate with our customers (Chapter 3). In such a new environment, past experience might not always be as helpful. It might even be distracting. You might overlook what has become possible, and you might not be ready to challenge the status quo.
There has been quite a lot of discussion about which is more helpful, creative discovery or domain knowledge. Those discussions often center around, “Who should I hire for my analytics?” There is no right or wrong answer; we believe the right mix will always contain both elements.
No matter whether you use creative discovery or your own domain knowledge, at the end, there should be a question which satisfies the following requirements:
A good question needs to be measurable.
A good question yields answers or outcomes that are actionable.
Thus the questions (or aims or objectives) formulated for data sets should be in no way different to goals and objectives formulated for humans or projects. For such situations, George T. Doran coined the mnemonic device S.M.A.R.T when setting objectives.[162] Thus the right question asked about data is a question that is specific, measurable, actionable, relevant, and time bound.
As discussed in the beginning of this chapter, those S.M.A.R.T. questions typically fall into two categories: benchmarking questions, “how did we do compared to…” and predictive questions, “what will happen…” And prediction questions are the ones more important for business success. A recent study by the Economist Intelligence Unit asked which types of data insights were considered critical by C-level executives. A total of 70% of the respondents indicated that the predictive insights were critical, while only 43% thought that trends (or benchmarks) were critical for them.[163]
But we all know from our daily work at companies that benchmarking questions are the main ones we use. We often look at historical trends or compare ourselves to the competitor. Those metrics are not ambiguous or soft, but specific. That essentially means you can describe the answer to the question through a set of numbers. Transported into the world of social media data, benchmarking questions could mean, for example:
- Reach versus reach
Which of two tweeps (people tweeting) has more reach?
- Reach over time
How far-reaching was a given event versus the last one?
- Reach absolute
Will the reach of this campaign be over two million eyeballs as per our internal reach metric?
Predictive questions are used way less in our day-to-day work, even when C-level executives see them as more important. We discussed prediction algorithms more in Chapters 2 and 7. After formulating the right question, the next biggest difficulty is often having the appropriate data to make a prediction. To create a prediction, the question should not only contain a “hard measurement,” but also define what a positive answer or outcome would look like. Let’s look at a few more examples, and as you read each one, decide whether those questions contain a clearly defined successful outcome:
A positive outcome is when the user clicks the product displayed.
A positive outcome is if we distribute our message to 10,000 people or more using our internal reach metric.
A positive outcome is when there is no negative public relations issue happening.
A positive outcome is when our product is well received by the general public.
A positive outcome is when we get more fans on our Facebook page.
All of them are correct except 4. That is not specific enough because one does not know what “well received” means in numbers. The outcome criterion would need some rewriting like: “Success is when 60% of the public reviews are neutral to positive, as indicated by our internal sentiment algorithm.”
Example 5 is generally correct, but sloppy in the way that it was written. Success would occur in this case even if only one new fan was gained. As this was probably not the initial intention, it would be better to state an exact number that defines the level that qualifies as “more.”
Item 3 is correctly formulated; however, we will see later that this question will not result in any insights, as we will have difficulties defining contributing variables.
Once a hard measurement is defined, the “so-what” question from the beginning can be asked. If the outcome is negative, what would we do? Would this trigger any change? A question is useful only if it leads to action.
Perhaps an appropriate final case study of the importance of forming the right question is the nascent social media industry itself. The social media revolution brought on the launch of many companies devoted to the measurement of social media data. They collected all kind of data, measuring quantities ranging from the number of articles to consumer sentiment. However, many of these companies soon vanished from the landscape, often because they had one of the following two issues:
- Sales costs were too high.
These companies needed to do too much free consulting until they could sell their measurements.
- Retention of clients was an issue.
Clients could easily sign up for these tools online; however, they would rarely use these tools for the long run.
Both of these issues could be seen as a case of not being able to formulate the right questions for customers. If it is not clear what kind of question the client wants answered, and if it is not clear what kind of action the client wants to take, the measurement company will not be able to answer anything of substance. Thus many companies employed the marketing slogan “Listen to the conversation,” indicating that the client should use them as a tool for a kind of creative discovery.
The survivors in this industry often built up consulting support to first define the question and the potential actions behind it, to inform the creation of relevant answers. To do this, you have to understand business needs as well as the available data influencing these needs. Nevertheless, many of those companies sold out or vanished.
The hardest and most complex part in any data work is the formulation of the right question. The right questions regarding data follow the same principle as a well formulated business goal or aim. They are S.M.A.R.T.
The complexity in the correct formulation of questions can be seen in the issues faced with social media metrics. Those metrics are often presented as the answer to a question. However, it is often a question you have never asked: if you attract enough fans on Facebook, or if enough people follow or mention you on Twitter, or if your view count is high enough on YouTube, then you are perceived to be successful. In reality, however, successful use of social media data requires understanding your strategic objectives at the front end of the process. The right questions revolve around business goals first, which then inform your use of this data. Social media data itself can be only loosely related to business needs, or even orthogonal to them, without careful planning and analysis.
To formulate the right question, you can either use the data itself and conduct the process of creative discovery or use your expert knowledge about the business. The more the data industry matures, the more we will see that the latter is used.
A good example here is again the use of social media. As it continues to mature, we are seeing more specific and actionable questions being asked and more targeted metrics created. This situation is very similar to the earlier growth of the World Wide Web in the 1990s. In the heady early days of the Web, simply having a website or implementing ecommerce was thought to be a competitive advantage for early adopters. Today, these tools are routine and commoditized for nearly everyone, and only the ones with a clear business goal in mind will profit from them. In much the same way, social media data is now maturing to the point where it is no longer sufficient to simply “join the conversation”; you must now ask good questions based on business outcomes, and then form a data measurement strategy around these objectives.
Each and every business is different. Thus each business will have different questions. Continue the discussion with us and your peers:
What are the objectives of your business?
Based on those objectives, what are your key questions? Write them down and revisit them throughout the book.
Are those questions good questions? Be tough on yourself. Are those questions really S.M.A.R.T.? Focus especially on the S (specific) and the A (actionable). Since we will use a lot of social media examples throughout the book to create the “fourth V” of the data, let’s look at this area specifically: is your company using social media? What kind of question would you like to ask about social media data on your brand, your customers, and your company?
Again, focus on being S.M.A.R.T. Questions are asked easily. The art is in being S.M.A.R.T. Short of questions? You might get a better angle if you try the preceding steps with someone who does not have the same domain knowledge as you do. Do you want to know more? Reach out to us in Twitter, @askmeasurelearn, or write on our LinkedIn or Facebook page.
[155] Lane Shackleton, “The Orabrush story: How a Utah man used YouTube to build a multimillion dollar business,” Google Official Blog, Nov. 2011, http://bit.ly/1gBx6R1.
[156] The word “viral” is actually misleading. We rather like to use the term “contagious,” as we explained in Virality versus Contagiousness.
[157] Grant Crowell, “Screw Viral Videos! The Orabrush YouTube Marketing Strategy,” ReelSEO blog, 2012, http://bit.ly/1k84Q8g.
[158] Morten T. Hansen et al., Harvard Business Review, Jan 2010, http://bit.ly/19NhKkv.
[159] Two weeks in May 2010.
[160] Same two week time-window applied.
[161] Statisticians and physicists will call them variables. In machine learning and within the new discipline of data science, they are called features. However, both mean the same: if we measure something, features or variables are the columns in our table with data.
[162] G.T. Doran, “There’s a S.M.A.R.T. way to write management’s goals and objectives,” Management Review, 1981.
[163] “In search of insight and foresight: Getting more out of data,” Economist Intelligence Unit, 2013, http://bit.ly/1e5hFQA.