
Prediction is very difficult, especially if it’s about the future.
If there is one common denominator across the many applications of social media and data analytics we have explored in this book, it is gaining the ability to predict the future: who will buy, who will win, and perhaps even who will fall in love with us. Successful predictions, seen through the eyes of science, not hype, make the hard work of data analytics worthwhile. Therefore, it is fitting that we close this section of the book with a look at how data is used to make predictions in several key areas, ranging from elections to the stock market.
No matter which department you serve within your organization, whether it is marketing, public relations, sales, business intelligence, or any other function, data will play a big part in the future. Data will change the way you do business. Let’s look at a few examples we have discussed so far:
If you are in marketing, you may be predicting what people want. Or you may be predicting the likelihood of someone to react to your marketing, like the case of retailer Target knowing when someone is pregnant. Or like the case of semasio, predicting when someone will place an ad to increase targeting (Behavioral Targeting).
If you work in public relations, you may hope to predict the next PR disaster, as discussed in Chapter 3. Or you may hope to predict how dangerous a certain situation is, such as when a racist hoax was posted online about McDonald’s (Case: McDonald’s). You may want to predict which journalist is best to talk to in order to create the most impact. Or you may want to predict when a situation has reached the tipping point, like the case of the Women2Drive campaign in Saudi Arabia (Warning Signals).
If you are in sales, you are most certainly predicting what to offer customers or prospects so as to induce their next purchase, such as Netflix or Amazon’s product recommendations. Or you may be predicting what would be the best price point to make people go out and buy your product.
What do these points all have in common? They are predictions. As we will see in Chapter 8, most questions can be classified in benchmarks as well as predictions. Asked what is the most important question to be asked for the business, 70% of C-level executives said that these should be prediction questions.[136] So prediction is a superpower everyone wants to have. And most of the time, those predictions will be powered by data—big or small, structured or unstructured. And once you have found an ability to predict certain things, you might want to discuss whether this ability can be productized, i.e., whether we can create a product out of it. Such information products can become important predictive tools for the future.
Predicting the future from data is the strongest form of the fourth “V” of data: value (as noted in the Introduction). In order to uncover this value, you have by now mastered the two main challenges:
Almost all other aspects of predictive analytics are based on technology, which is by no means trivial, but which often can be more easily solved than those two questions. It is in solving them correctly that we find the value we seek from the analysis of big data.
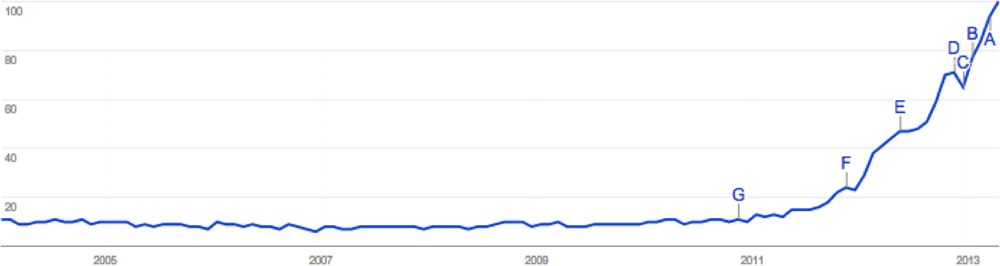
Predictive analytics is as fashionable a phrase as big data. As you can see in Figure 7-1, starting in mid 2011, people all over the world started to search for “predictions.” This is a bubble in the making. An even better sign of an upcoming bubble is when Hollywood makes a movie about it. In the case of predictive analytics, Moneyball is a perfect example: this 2003 book by Michael Lewis showed how a small-market Major League Baseball team used sophisticated analytical models to predict baseball talent and field a competitive team, despite a small payroll, by predicting future talent accurately. Its analytical approach has since been used successfully by other teams that have won the World Series championship, permanently changing the competitive landscape in baseball.
Despite all of this hype, the goal of making predictions in business is nothing new: for decades, stock traders have tried to predict the market, insurance companies have tried to identify lower risk individuals, and many more have tried to come up with a system for predicting what will benefit their enterprise. The human race always wanted to have predictive superpowers, so everyone from soothsayers to statistical mathematicians has tried to satisfy this need.
In the coming sections, we will look at four areas to show how data products work (or do not work), all based on predictions. But while it is easy to understand that predicting the future can make great business sense, it is more difficult to get them up and running:
- Predictions in the learning and education industry
How algorithms change what we learn
- Predictions of box office results in the movie industry
How predictions fail to detect the unexpected
- Predictions in politics
Why social media is useful for steering campaign efforts, but doesn’t help make predictions
- Predictions of the stock market
Data has started to have an impact, and the journey will go beyond what we imagine. The story of big data analytics started with simple web traffic. The data made our human online behavior more visible. We tracked every move and every click. Using machine learning (Figure 2-2), our next click became predictable. With Web 2.0 and social media, we suddenly had unstructured content data on top of this structured click data. This unstructured data was harder to interpret, but it offered an even more in-depth view of our human behavior. Now we saw that in not only our purchasing and reading behavior, but also how we interacted with others. Next was the tracking of our phones and our moving profile. Suddenly more and more parts of our personal lives were coming online or starting to be digitized. Whereas in the beginning we only predicted which ad banner to show, we started to predict which subject someone should study to be happy or successful.
Far-fetched? No, not really! Big data has started to have enormous effects on the educational process. Learning is turning out to lend itself surprisingly well to data analytics, and it is changing the face of post-secondary education. It all happened with the onset of massive open online courses, or MOOCs (see MOOCs). MOOCs are now taken by as many as 200,000 students. Hundreds of teaching assistants facilitate, creating a great database of possible questions and answers on the course topics. This crowdsourced wisdom helps to find mistakes or the most important questions by the number of people reading something or the number of exchanges on a given topic in the related discussion forum. The data is showing how we learn things and will help us to improve our learning style, and since it is all stored, it will be easily accessible for everyone. This is one of the many revolutions we will see happening through data. Today you can already predict whether a participant of a MOOC will be successfull or not after just the first few lectures. The algorithm uses metrics such as:
How often did the participant watch a given video and when?
Which questions did she answer right and which ones did she get wrong?
Did she participate in discussion forums?
Big data has entered our classroom. At Arizona State University, automated tools tracking student performance go so far as to require advising or even a change in major if students go “off track” for too long, as the New York Times reported.[138] In order to improve the success rate of students, the university trends toward front-loading requirements that ultimately determine success: for example, requiring psychology majors to take the hated statistics course first, as this is often one of the stepping stones to being able to succeed in the major. Engines start to help predict success and failure. When automated, they can change examination requirements to get the students on the right track. Is this education and career development in autopilot mode?
The system in place at Arizona State University is a good example of how to use data within a product. The college education is the product that can be dramatically improved by better prediction. Data thus enhances the potential of the very product. In this case, it is not the marketing department that needs this data, nor public relations, sales, or customer care. No, the product as such needs the data. Thus, data has become an essential part of the product: a data product.
People often ask for predictions during elections. On one side, this satisfies a human interest in who will win; on the other, this has a clear business relevancy. Any change in political power might have impacts on critical business decisions, and stock markets will often shift depending on political discussions. This leads to the first way of predicting election outcomes: using the crowdsourced opinions of the stock market.
The more traditional way surely would be polls, conducted by paper or telephone. As a modern supplement to those polls though, we often see more and more use of social media analytics. However, as we learned in the earlier chapters, social media is hard to interpret because the data is often unstructured, noisy, and very hard to read. If you check on social media-based predictions, you will easily find a few fulminant failures to predict reality.
Let’s take as an example the United States Republican presidential primary race in Iowa between Mitt Romney, the eventual Republican nominee, versus upstart candidate Rick Santorum. The race was so close—29,839 votes for Santorum versus 29,805 for Romney, with results from eight precincts uncertified due to technical issues—that Iowa did not award delegates to any candidate. The real story, however, lies in the use of social media.
If you were basing your predictions on candidate mentions on Facebook, a third candidate, physician and Congressman Ron Paul, should have easily won this race. On the basis of search volume and relevant mentions, Paul’s numbers were far ahead of his competitors. The same was true with measures of positive sentiment. Paul had a devoted legion of followers who knew how to “work” social media, but this did not translate into votes.
So why such a disconnect between social media and results? We will explore this issue in the following sections. Social media did not completely lack predictive value: Figure 7-2 shows that relative mentions on Facebook rose and fell with the fortunes of candidates. But even the newly formed alliance between Politico and Facebook, which was supposed to give great new insights into predictive polling, ultimately failed.
Paul was very strong and visible on Facebook, as Rachel Van Dongen showed in her post. Yet he won neither the Iowa nor the New Hampshire primary elections. This is just another example showing that the pure count of social media mentions does not contain the needed information. While one person can create a strong social media impact, he or she still has only one vote to cast.[139]
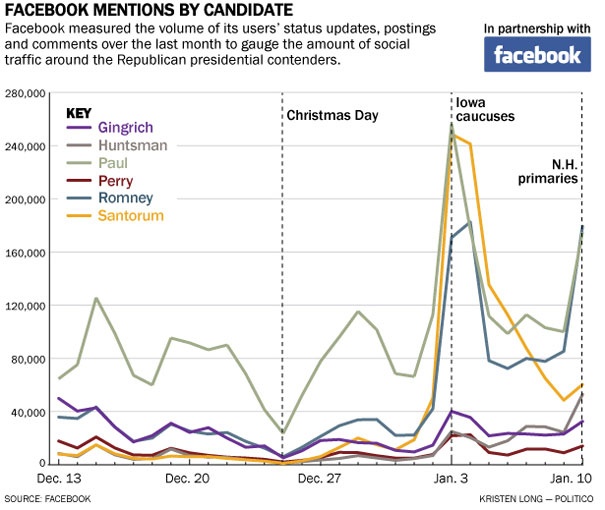
Figure 7-2. Candidate mentions on Facebook measured by Politico (Courtesy of Kristen Long from Politico.)
To dig into the content, as well as into the who posted the messages, is more challenging as we deal with the complexity of unstructured data. Another crowdsourced method would be to predict the outcome using the Google API that offers data on the most important search terms and their quantity, like which candidates were searched for more often online. But that isn’t the right metric. While it seems that there might be a correlation, we will have difficulty doing a statistical test on that. Predictions on social media alone are difficult. Why? Out of the many reasons, the two best explanations are probably that there is a selection bias and a bad PR bias.
One of the most difficult things about social media is that not every person who is talking is actually able to act. In the case of the Iowa election, it might be that not each of the Tweets or Facebook articles that were analyzed actually belonged to people who could have cast a vote.
This discrepancy between who you see and what the actual complete group is is a common issue. In discussions like usenet it is a common understanding that 90% of the online community members never contribute at all. Only 10% contribute, and actually most of the actions are done by a few, accounting for as little as 1%.
Those numbers might have changed since “sharing” became easier and can be done by a click on a like or retweet button. However, you still do not see the majority of users, which might easily lead to skewed results, like we saw in the Iowa primary forecasts.
Moreover, even if you could get data from the majority of users, there is often a large difference between what people announce publicly and do privately. This is frequently visible when elected state officials have low approval ratings—the actual number of people who announce that they have voted for them is quite low. This is the case of private polling results. You can only imagine that the skewing is even greater if you look at public announcements. What people publicly claim they want to do and what they actually do can differ quite dramatically.
In Chapter 3 we discussed why the number of news clips is often a useless measure. This insight is especially true before large elections. Each campaign tries to not only promote their ideas but also create bad PR for the other side. Bad PR would lead to more news clips and more mentions on Facebook, but it surely would not create higher turnout for the candidate in the election.
You might now argue that this is true, but you should look at sentiment ratings. As discussed in Chapter 4, sentiment algorithms are very difficult to program. To predict how a given news report would shift voters would be difficult, as those algorithms would need to be trained with data one does not have, such as what a voter would do after reading this news.
Thus, as it is in PR, many news clips does not mean more fame. It might just mean more problems.
Because of difficulties such as these, social media is not widely used as a predictive data product in political campaigns. As Chief Scientist Rayid Ghani,[140] from the campaign team Obama For America, explained, it is actually used much less then most people think. This is also a clear sign of the overestimated capabilities of social media.
Political opinions are so multifaceted that there are many possible viewpoints. Similar to the discussion in Chapter 2, the long tail will make predictions of recommendation engines more complicated; predictions of political decisions are complicated because so many different factors might play a role. The situation gets more complex if there are factors such as weather conditions or a sudden change in the public perception that have a strong effect on the results. For example, the impact of Hurricane Sandy before the reelection of President Obama was nothing anyone could have predicted. No poll, no matter how well done, would have predicted this upfront.
But what can social media be used for, if not predicting the outcomes? Social media can be extremely helpful in focusing the efforts of campaign teams. Very often in political campaigns, the real bottleneck is the people on the ground: the teams of volunteers who go from door to door to discuss the election with voters and motivate them to support one camp or the other.
The winning question for any campaign is where to best deploy those volunteers. If you send them into a neighorhood where most people are already convinced that they will vote for your candidate, then they do not shift the proportion of voters intending to vote your way. If the volunteers are sent into the opposite neighborhood where no one will vote for the candidate of choice no matter what they say to the voters, then this will not help either. On the contrary, it may even weaken the excitement of the volunteers and might create dropouts.
Volunteers need to be deployed to contact swing voters. But the question is how to find these swing voters. Similar to our discussion in Chapter 2, where we suggested that you use social media to find potential new sales opportunities, you can use social media to find undecided voters.
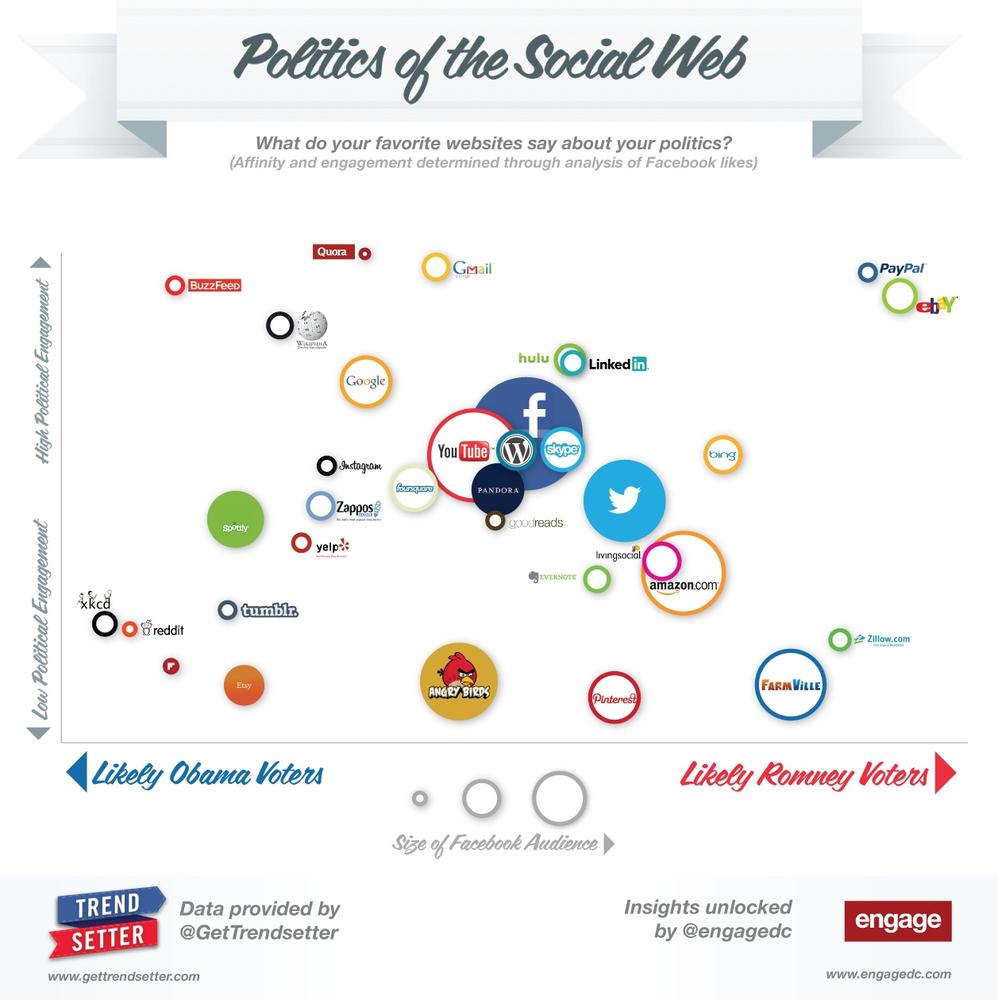
Is this the most effective way? Yes, since social media is unstructured, it probably will be best to start with census figures of traditional voting behavior. However, social media can give additional insight into which area or which person might be good to be addressed because she is still undecided. Engage, a digital agency in Washington, DC, did a nice study that showed how diverse the voting camps in the 2012 US election were in terms of social media: for example, Google users tended to trend toward President Obama, while users of the ecommerce site eBay were, as a group, more in favor of the Republican challenger[141] (see Figure 7-3). Equipped with that sort of information, you can start to address swing voters at least in those different channels. The general election in 2012 is only the second big election supported by new media; there is still much to be learned about this kind of analytics in politics.
As noted previously, the hype of social media within predictive analytics comes as we suddenly have data about human thoughts, hopes, perceptions, and emotions. Up until now, predictive analytics had been used for much more tangible, quantitative things, like predicting the likelihood of a car accident based on data your insurance company has. What we might now predict those massive comments and discussions displaying human emotions has to be of value for the very industry that is known for emotions, the movie industry.
The movie industry has a need to predict outcomes similar to the political campaign industry. Whereas in an election, the winner takes it all, the movie industry is built on a few blockbusters that create the main part of the profit. If one could predict movie success early on, before the film came to the theaters, one could:
Channel marketing budgets toward the movies more likely to be successful
Change parts of the movie’s story line, depending on viewers’ expectations
Alter the rollout of a movie to different countries to maximize box-office revenues
Once the movie is released, there are enough prediction models to forecast the success based on a weekend of box-office sales. However, by that time, it is already too late, as the movie production and marketing investments are done.
Could you use the hype that is building up for a movie to effectively predict the box-office outcome? Do the number of discussions and the amount of communication in those discussions about the movie, its sentiment, or the spread of information about it contain information that could be used to predict the box-office results? Compared to the situation of political campaigns, the movie industry has the advantage that the demographics of those who are active in social media and moviegoers overlap more.
Moreover, the selection bias might not be as strong because a comment on a movie can be taken as a serious opinion. The risk that people do not say what they think, which is strongly there in terms of political discussion, should be less pronounced within movie discussions. So could we use social media to predict box office outcomes?
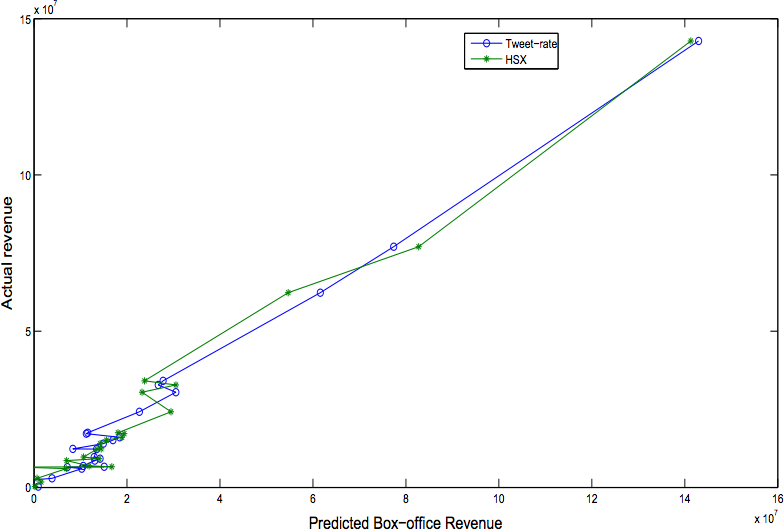
There has been ample research, and it seems to say social media can be used, but with the warning that the results are not always clear-cut or certain. In early 2010, Bernardo A. Huberman (@bhuberman) and Sitaram Asur (@sitaramasur) from HP published a paper predicting box-office outcomes.[142] Their hypothesis was that movies that are talked about will become box-office successes. They used close to three million Tweets to build a model predicting box-office revenues (see Figure 7-4). Their model had an adjusted R2 value of 0.80 (further reading on the coefficient of determination value), indicating that a good part of box-office revenues was explained by the predicted revenue. This led them to conclude that social media can be an effective indicator of real-world performance. Moreover, using a sentiment algorithm, their predictions were better than those produced by the Hollywood Stock Exchange and other information markets.
A similar movie study two years later by Felix Ming Fai Wong from Princeton University[144] found evidence that the number of tweets carried insights about the box-office results, but concluded that those results can only be indicative. This means that even if there are a lot of tweets, you cannot be sure of a box-office success. Ming Fai Wong detailed the actual metrics by looking at what he calls “hype approval.” This looks at the number of tweets before and after launch to find out whether hype within social media is sustained or not. While this metric seems to work for the sample of movies he investigated, it was not a bulletproof metric.
Overall this shows that social media can provide insight that is worthwhile to use. However, you have to be careful not to completely rely on the social media results, but combine them with other data. In the aforementioned study, Ming Fai Wong used structured data from IMDb. The combination of IMDb, together with his Twitter metrics, generated a sufficient predictor.
Facebook used a similar approach in September 2011.[145] It selected a “statistically relevant” sample of Facebook users and looked at how many of them stated that they wanted to go to the movie. This approach was similar to a classic polling mechanism where one would select a statistically representative user group. Such a selection process would not be possible based on the usage of Twitter users, as tweets do not contain as massive an amount of information as Facebook comments. Twitter data as a whole is often unstructured, while Facebook demands a certain degree of structure (where you live, what you study, etc.). In a way, this approach showed the power of Facebook to do polling without users even realizing that they were being polled.
The result of this sampling was yielding a similar high R2, which the leader of this study Jacobson mentioned during the interview with Lucas Shaw. Facebook had only used 1,500 data points and was able to predict the opening box office performance a week before launch of the movie with an R2value of 0.89.
The answer to the question of whether we can predict movie financial performance is so far an unsatisfactory “sometimes.” Yes, the movie industry hinges on emotion, and yes, our social media discussions reveal those emotions to a certain extent. However, as we saw in Chapter 1, we love the surprise of the unexpected, and emotions are extremely hard to predict. Back then we quoted Arthur S. De Vany, and since his quote is so powerful, we want to repeat it here:
There is no formula. Outcomes cannot be predicted. There is no reason for management to get in the way of the creative process. Character, creativity and good storytelling trump everything else.
—Arthur S. De Vany in “Extreme Uncertainty Shapes the Film Industry”
Nevertheless, sometimes if the norm is the expectation, we will be able to make a prediction. Out of those situations we will be able to create products either as B2B applications that that show where and when to apply marketing spending on movies or as B2C products that suggest what kind of movie to recommend next, as Netflix did.
After looking into examples of predictive analytics in learning, politics, and movies, let’s turn to financial markets. Unlike the movie industry, there are massive amounts of structured financial data available. And the financial industry is probably more advanced than any other industry in predictive analytics. For decades it has used historical behavior to predict future moves. This level of technical analytics is already a standard for many firms. Within the financial industry, we can best see that the data is not the main asset for predictions. Historical courses of data are available to everyone who is willing to pay. The main assets are the insights into how to create metrics and how fast you can put together a calculation to predict the next few seconds on the stock market.
The onset of social media promised to be another data pool for things like hedge funds that you could tap into to improve even today’s accuracy. These hopes seemed to be promising. Google’s search API, for example, was recently reported to help predict global stock trends.[150] A group of researchers using historical data from 2004 to 2010 found that changes in the search volume of specific terms such as debt, stocks, or portfolio correlated with up or down movements of the market, and a specific strategy of long or short selling in response netted hypothetical investment gains of over 300% versus the control strategy.[151]
But are those trends enough? Not really because most likely we have here an issue where we are mixing cause and relation. The more important question is can you actually decide on a buy or no-buy decision for each and every individual stock by itself upfront? Can social media be used to make this sort of decision accurately?
In Chapter 9, we discussed the BP case and showed that public opinion is not necessarily a driver for the stock market but most likely a lagging factor. Does this mean that we cannot use social media to predict how a stock will trade? You will find companies claiming that their algorithms can be used to predict stock price movements. Companies in this space include StockTwits, Chart.ly, WallStreet Scanner, and Covestor.
But how good are they? In essence a company that would be able to predict the stockprice well would rather keep this knowledge to itself to start its own hedge fund just like Derwent Capital, a London-based hedge fund. Derwent Capital started with the promise of investing based on Twitter analysis, and it undoubtedly did not publish its formula widely. However, similar to the movie or election discussions, there is a good portion of skepticism to be applied in using social media data to predict stock curves:
As in the other examples, you would need to create an algorithm to detect, from the unstructured data, whether a certain person is thinking of selling or buying a specific stock. Those algorithms would have a high error level. But Wall Street already has enormous amounts of structured data. Those data points are, by definition, better suited for computers to analyze and probably produce a more accurate signal. Or as Paul Rowady, senior analyst with consultancy Tabb Group, told Mashable, “The signal-to-noise ratio for that dataset is simply way too low.”[152] It would be useful to look at unstructured data only if all other structured data had been effectively analyzed, so you hope to gain the competitive edge from the unstructured data.
Secondly, time has always been a critical factor on Wall Street. Some funds, such as Renaissance Technologies, became renowned for moving offices to be closer to the stock exchange. Today the fight for speed is bigger then ever before. Social media, however, is slower than most other stock market trading indicators. You have to wait for information to be written, published, aggregated, and analyzed. Such a time delay might cause too much of a downside for this measurement to be useful.
The last point that would make us worry about such a prediction algorithm is that it might be easily influenced by fake social media attempts, as shown in Chapter 6.
Maybe it is due to those shortcomings that Derwent Capital is no longer active as a self-standing fund, instead becoming a platform for offering insight to others.
All in all, these promises have not come true to the extent many had hoped. The best approach we have seen so far is probably focusing and reducing the scope (see Chapter 9). Instead of looking at all social media data, analyze only highly focused data. In respect to stock predictions, Michael Liebmann explained, “When drawing inferences from stock news, it is a question of cause and effect. Most tweeps simply reuse content and discuss older news. This creates another layer of complication, where the researcher needs to first identify which topic is entirely new and indeed introducing novel facts.”
He and his team focused exactly on only such novel facts. They restricted their unstructured media data analytics to the use of company announcements. For them, company announcements could reveal an information asymmetry, meaning that the PR person in the company wrote an announcement knowing things that the market did not know.
This asymmetry can be revealed by the pure wording of press releases. This approach moves away from social media. However, it is close to social media analytics in that it relies on unstructured content. Michael’s approach has two main advantages:
It reduces the amount of data to be analyzed. Looking at all the tweets and blogs of the world might be too distracting. As often discussed in this book, more data only means more pain but not necessarily more insights.
Language is relatively uniform, since press releases are written in a certain style. You will not find slang or smear words here, and emotions are kept out. There will be no cynicism, there will be no irony, and even the words used are from a restricted vocabulary. As we learned in Chapter 4, the more focused the vocabulary is, the easier analytics will be.
Using machine learning, Michael and his team have created an algorithm suggesting whether a share price will rise or not. The curve in Figure 7-5 is based on testing using past data, and it suggests that stocks selected based on their formula have a potential 2% higher return.[153]
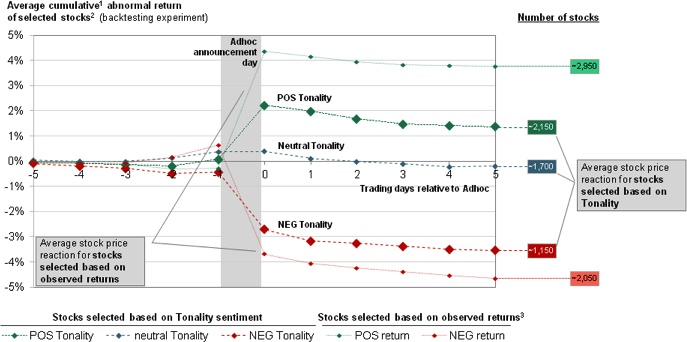
Figure 7-5. Stock correlation with unstructured data from press releases (Courtesy of Michael Hagenau, Michael Liebmann, and Dirk Neumann.)[154]
Let’s finish this chapter with some closing predictions about big data. We have the technology fundamentals, and we have started to save everything about our human behavior: the way we move (mobile phones), the way we discuss (social networks), the way we learn (MOOCs), the way we shop (online shopping), the way we talk (Apple’s Siri and others), and even the way we breathe (new ways of measuring ourselves).
Not all data is easy to mine, and often our hopes are much higher then the yield from the actual results. The three main issues here are the following:
Lack of the actual business-relevant question
The difficulty (because of noise) of working with unstructured data
Our own sensitivity about personal data
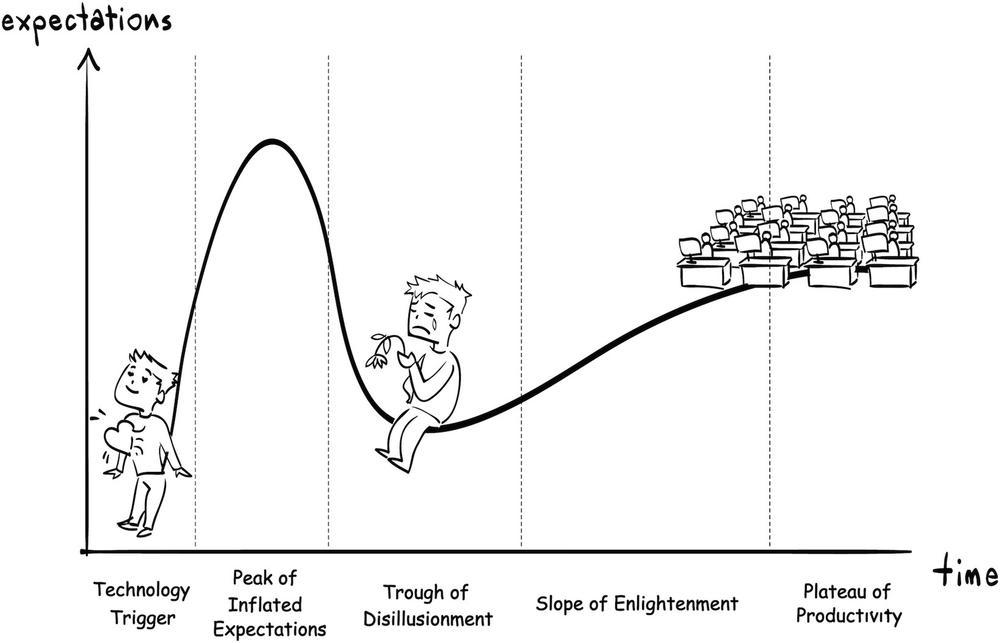
Because of this gap between hope and reality, we will see this industry follow the typical hype curves (see Figure 7-6) as many other industries before. We will start high and expect that data will give us all the answers. We then will realize in disappointment that many of those answers are answers to questions we never had and that do not even interest us. But despite this upcoming disappointment, essentially we will get to the plateau of productivity.
It is only a question of when this will happen. Do you remember the hype around online translations? It took longer then expected, and for years we needed to cope with terrible translations. Brute force and many data points made those translations more useful. We see a similar development in the way we deal with unstructured data. Just recently Google announced the bundling of voice and semantic search. As we have seen, it is hard to measure semantic context. At the moment Google is far from perfect, but over time, with more and more training samples, this approach should also start to work.
The same development will be seen in measuring and interpreting unstructured data. Moreover, as with the second issue of missing correlation, we will see more and more data points popping up as we start to measure more and more. Even when things such as creativity or fashion are still impossible to predict in the long run, we will become better and better at predicting those emotional and creative-based products successfully in the short run.
But whenever this happens, whenever a product or a service will prove useful, questions about security will come up. The data companies use are generated by their customers; therefore, there will be an upcoming discussion about who owns this data and who is allowed to use it. The public outrage and discussions that we saw around the data saved for access by the National Security Agency will only be the beginning.
Big data, social media, and data analytics are part of your life now and will become an even bigger part in the future. So what will this look like for you—more hype than reality, or an important strategic part of your business? The race is on, and the winners and losers of this next epoch of data analytics will be determined by how well and how fast each company can cross the gap from hype to strategy.
This first part of the book has given you important guidelines for being successful in the brave new era of data:
- Find the right question.
A question that is SMART: specific, measurable, actionable, realistic, and timebound.
- Find the right data.
Not all data is equally suited for your question.
- Be predictive.
The way of kinds is to predict and to create a product out of data.
- Avoid the traps.
Be mindful of attempts to skew your system by bots or other tricks.
- Start small.
Start feature by feature to build your model.
- Mind the sensitivities such as privacy.
Even if we can measure today almost everything, we should be mindful of the needs for privacy.
Whether you’re a winner or a loser will depend on how much your organization will start to live and breathe data. How effectively can it use data? And above all, how much is it able to unearth the fourth “V” of data, value? We close this chapter by bringing up the quote from the beginning of the book, from the great W. Edwards Deming:
In God we trust. All others must bring data.
—W. Edwards Deming
Think about the following with your colleagues:
Where could your organization improve most? In framing the question (ask)? In measuring the data (measure)? In putting all the insights to work (learn)? What should you do to drive this change?
For many people, the biggest value from data analytics lies in predicting the future. What kinds of predictions would most improve the future of your company? Does social media and/or other sources of big data hold the potential to make these predictions?
What kinds of data would have the most impact on your business? And are you currently making the best use of the data you have? Do you leverage this data to improve your products and services?
What would your clients and consumers think if you start using their behavior or their data to predict the future of your business? How should you deal with this? Is openness the best way?
Are there improvements you could make to your services or products using crowdsourcing? What would those look like?
Up until now, we have always asked you to share your thoughts with us publicly. While respecting confidential areas such as product strategy, you might have many ideas on what could be good data products, and how data can help to make this world a better place. Please share with us—and the world—your ideas on future products for data and/or predictions. Reach out to us in Twitter, @askmeasurelearn, or write on our LinkedIn or Facebook page.
From here, for those of you who want to drink a little deeper from the methodology of working with social media and big data analytics, the next and closing section of this book will take you on a tour of how to construct your own “ask, measure, and learn” system. We will explore in detail how to construct the right questions, use the right data, and create the right metrics to gain insights from data, particularly when this data is populated by the digital footprints of people. These sections will help you learn to think like a professional data analyst, and ultimately learn to frame this process as a teachable set of skills and expectations. From there, it will become much easier to crack open the secrets of social data, and use it to learn the things that will make us successful.
[136] “In search of insight and foresight: Getting more out of data,” Economist Intelligence Unit, 2013, http://bit.ly/1e5hFQA.
[137] Martin Harrysson et al. , “How ‘social intelligence’ can guide decisions,” McKinsey Quarterly, Nov 2012, http://bit.ly/1gBr6Yt.
[138] Marc Parry, “ Big Data on Campus,” New York Times, Jul 2012, http://nyti.ms/IPqFv4.
[139] Rachel Van Dongen, “Facebook primary: Mitt Romney, Ron Paul in the lead,” Politico, Dec 12 http://politi.co/18Lxwft.
Chris Good,“Final Iowa Results: Santorum Tops Romney, but We’ll Never Know Who Won,” ABC News, Jan 2012, http://abcn.ws/1dhrI03.
Tom Webster, “What Your Brand Needs to Know About the ‘Social Media Caucus,” Brandsavant.com, Jan 2012, http://bit.ly/1fgIo9j.
[141] Patrick Ruffini, “INFOGRAPHIC: Mapping the Politics of the Social Web,” EngageDC, Jul 2012, http://bit.ly/1k7Wv4G.
[142] Sitaram Asur and Bernardo A. Huberman, “Predicting the Future With Social Media,” Proceedings of the ACM Conference on Web Intelligence, 2010, http://bit.ly/1hdSGse.
[144] Felix Ming Fai Wong et al.,“ Why Watching Movie Tweets Won’t Tell the Whole Story?” Mar 2012, http://arxiv.org/pdf/1203.4642v1.pdf.
[145] Lucas Shaw, “Facebook’s Jacobson to Studios: Use Us to Track, Promote Movies,” The Wrap, Sep 2011, http://bit.ly/1k7Y8zd.
[146] Natasha Lomas, “Facebook’s Creepy Data-Grabbing Ways Make It The Borg Of The Digital World,” Tech Crunch, June 2013, http://tcrn.ch/Jyz7Q4.
[147] DOT Media, “The Brian of Human Civilization: keynotes from Julian Assange interview,” Dec 2012, http://bit.ly/1fgKExt.
[148] Paul Miller, “I’m Still Here: Back Online After a Year Without the Internet,” http://bit.ly/1gBuYsk.
[149] Bob Al-Green, “13 Million Facebook Users Haven’t Touched Their Privacy Settings,” Mashable.com, April 2013. http://on.mash.to/18uRm3P.
[150] Jason Palmer, “Google searches predict market moves,” BBC, April 2013, http://bbc.in/1cwvOzK.
[151] Tobias Preis et al., “Quantifying Trading Behavior in Financial Markets Using Google Trends,” Scientific Reports 3, April 2013, http://bit.ly/1dG8Bgt.
[152] Andrew Graham, “Why Wall Street Is Betting Big on Your Social Media Data,” Mashable, April 2011, http://on.mash.to/1bakjwK.
[153] Michael Hagenau, Michael Liebmann, Dirk Neumann, “Automated news reading: Stock price prediction based on financial news using context-capturing features,” Decision Support Systems 55, 2013, http://bit.ly/1k80VZg.
[154] 1) Base: 20 trading days prior to announcement. 2) Experiment based on 12,200 ad hoc announcements, ~5,000 validation events (back testing) in graph. 3) Observed returns on event day, based on close-to-close adjusted prices. Note that stock price effect is measured by abnormal returns very similar to day-to-day observed returns. Events between 1996-2010.