
Every company has many existing measurements that lead to data. In the last chapter, we discussed which data and how much of it we should use. But not all of this data might help to answer the question we defined in Chapter 8. Therefore, we need new metrics to bundle and aggregate different data sets to form new insights. This is the fundamental task of any metric.
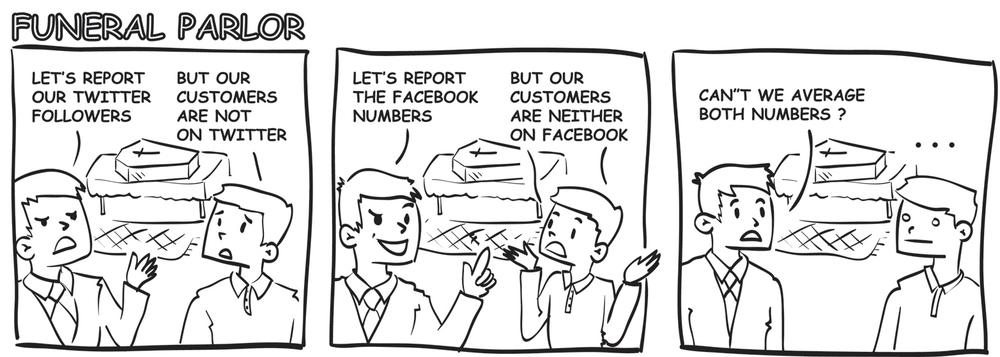
New measurements or new metrics have become important in a world that now generates more and more unstructured data. As explained in Unstructured, unstructured data is hard to correlate and difficult to implement into mathematical models, except when a metric or measurement aggregates this data down to a few data points. In this chapter, we will look at the common pitfalls in creating metrics and measurements. As Figure 10-1 depicts, it is easy to create metrics, but that does not mean they make sense.
Lets start first with a shining example of a good measurement meeting the right business question. Google was far from being the first search engine. In fact, at the time of its 1998 launch, it had many competitors, and the boom in Internet search usage was well underway. So what single factor helped propel this company, started by two Stanford students in a garage, to become a company with a marketcap of close to $350 billion?
A measurement.
What differentiated Google from its competition was its PageRank metric. This measurement was new, despite the fact that it was built on data everyone had. It analyzed the importance of a page based on how many other pages linked to it, and the importance of those pages. It was a watershed measure compared to other search-ranking approaches; it determined your position within Google search results and was hugely successful. But it was not just the measurement that made Google successful, but the right measurement for the right question.
Google was successful because it designed a measurement for a question that everyone, including competing search-engine vendors, was asking. Google focused on, “What is a search user looking for?” There was no metric yet for this question. Competing search engines used to pride themselves on having the most indexed pages. Thus Google defined a metric that measured how relevant a page was to a specified set of search keywords. Google knew that for many users, it is not important to see all the web pages on the World Wide Web, as long as Google found the one page they were looking for. Google’s value is the bridge between billions of indexed pages of unstructured content and the relevant answer to the user’s question. Moreover, the data this metric created had all the advantages of being “right,” as described in Chapter 9:
- Causation or correlation
The new way of ranking was superior because it really correlated to more relevant results than the competition.
- Error
The new metric was a “hard” metric and did not use probability. It did not rely on unstructured content to classify web page but instead used the structured data of links. Thus the measured outcome had a small error.
- Cost
The metric was a newly created metric which only Google owned and knew. It relied on public available data, but since the competition did not store the data in an easy accessible format, the metric was in itself a good example of competitive advantage.
The creation of metrics has become especially important within the realm of unstructured data. Again, let’s take social media as an example. What do all those conversations mean? How can we learn something meaningful from them?
What do Facebook posts or tweets tell you about your customer satisfaction levels, your brand image, or your potential market share? At best, individual posts will yield anecdotal evidence. It only becomes useful if you combine the information from many posts or tweets into a metric such as a keyword analysis, sentiment, statistics, or network topography. More general in any set of unstructured data. Metrics are key, as they create a single number from a large data set that, in turn, can be used as a benchmark for comparison to other metrics or within data models.
But it is hard to create the right metric. Much the same as when other search engines did not at first find the right metric to display relevance page rankings, it will equal parts skill and luck to define the right social media metric. This quest becomes even harder as social media analytics companies are not short of creative thinking when it comes to the development of new indexes or metrics without a given question. They correlate, filter, average, and then present a new index just to claim the bleeding edge in their marketing material. This can lead to an inflation of metrics. But more metrics will not necessarily mean that we have found the right metrics. It will be similar to the sentiment expressed a century ago by Lord William Lever of Lever Brothers: “I know half my advertising (replace with metrics) isn’t working, I just don’t know which half.”
In this chapter, we will show in various examples why it is difficult to define the right metrics. Moreover, we will see that even correctly defined metrics carry the risk of being misused. This means that finding the right metrics, while forming a crucial link between data and outcomes, represents a process that must be nurtured and maintained rather than serve as an end goal or destination. Let’s begin by looking at some of the considerations in creating these metrics.
A well-defined metric provides an answer to a question, and it makes it clear what to do with this answer. In the case of Google PageRank, the answers to “how popular is a web page” makes it clear that you should show the most popular pages first.
It is relatively easy to form metrics from social media data itself, such as the number of retweets or the depth of one’s social graph. Relating these to real questions and having a clear idea of what the business outcomes should be is often much more challenging. Here we will look at three examples of the issues surrounding effective social media metrics: influence, consumer preference, and return on investment (ROI).
To show the complexity involved in designing the right metric, let’s look at the measure of influence. Today, influence is a hot topic, as judged by the numbers of startups trying to measure this quantity or the number of books published in this field.
However, it is not a new topic. Research investigating what an influencer is and how he or she relates to our decision-taking process has been going on since the 1940s. Harvey Mackay described one example in his book Dig Your Well Before You’re Thirsty (Harvey Mackay), where the daughter of a friend got a summer job as a waitress because, during her interview, she showed a Rolodex containing all her friends and claimed that she would invite them all to come and eat at the restaurant. The underlying assumption that the restaurant owner made was that this young girl would have the influence to get all her friends to eat at his place.
This book was published in 1999. Today the same pitch of this young lady might have sounded completely different: “Check out my friends on Facebook, Twitter, and LinkedIn. If you hire me, I will invite them all to come.” How could the restaurant owner have validated this claim? How could he decide whom to hire if there were two applicants who were both offering to invite all their friends?
If we were to assume that this were the primary hiring criterion, in theory all this restaurant owner would need is a social media metric measuring influence by which he could rank his applicants. Is it that easy? Unfortunately not. The biggest issue is that any commercially available metric would simply be a measurement of something which, in some form, would possibly correlate with what can be called “influence.”[172]
The term influence, however, might mean different things to different people. While the restaurant owner wants a metric to predict how many new clients will come to his business, the measured influence metric might focus on people who can “shape a discussion on Italian cuisine.” The term is deceiving as long as it is not clearly defined. Thus any metric needs to fulfill the criteria as defined in Chapter 9:
What could potentially be relevant social network metrics that somehow describe influence? The following metrics spring to mind:
- Network size
How many connections a person has in his social network. The more connected he is, the more influential he is.
- Network centrality
The degree of “betweenness,” i.e., the level at which one connects others within a network. If she is very central to her network, then any information needs to be passed by her. She is influential because she can control the content flow within the network.
- Network proximity
How close someone is in terms of location, interests, or other criteria. The closer someone is to someone else, the higher the likelihood that they influence each other.
- Location
How physically close this person—and her network—is to a given location. The closer the person is to, let’s say, the restaurant, the more likely that she will be visiting.
- Engagement
The degree to which a person and her network are communicating with each other. Likewise, in the real world, a discourse shows a higher level of influence as people react to the ideas.
- Authority
How much this person is quoted or retweeted by others. If many repeat the ideas, then this person should be an authority in this field.
You probably nodded as you read this list of metrics. Yes, they all seem to somehow describe influence. However, the list could easily go on. For example, demographic factors such as age distribution could be important for specific restaurants: the operator of a fast-food chain would weigh the importance of the over-30 age group differently than the owner of a high-end dining place. While our personal experience seems to tell us that all of those metrics somehow have an effect on influence, it is by no means clear how strong this effect is. As we discussed in Chapter 1, the traditional view on influencers does not hold ground. Influence does exist, but we too often assume that someone influences someone else, while in reality it is more homophily or reach, and not influence.
Today we know that influence depends on metrics like readiness to be influenced, topic, and reach. The metrics described might especially link to the latter two.
It’s likely factors other than social media will play a more prominent role in the restaurant owner’s decision on whom to hire.
While it is not easy to create an influence metric to support hiring decisions at a restaurant, it is easier to assess consumer preferences using social media. We are looking for a metric that can predict consumer preferences of the buying public. Such a metric could benefit consumers, who could base their buying decisions on it by answering the question, “Should I go to this or to that service or shop?” It can also benefit the businesses because it will act as a kind of competitive intelligence.
Here, we will look at two real-world examples: the hospitality industry and physicians.
For the first of these, consumers and businesses alike have long searched for ways to evaluate hotels and restaurants. Is there a good way to tell whether the food and the service is good or not? This is exactly what the company NewBrandAnalytics tries to do. Launched in 2008 by Ashish Gambhir, the company uses proprietary algorithms to turn unstructured customer feedback on the Web into specific metrics for hospitality businesses.[173]
Its metric has exactly one need of the client in mind—the question, “What is a good consumer experience?” To answer the question, the service uses only one input source, the unstructured data from social media text. The algorithms from NewBrandAnalytics are looking for insights into criteria such as food presentation, food quality, and service.
The company takes the Net Promoter Score (NPS) metric initially developed by Fred Reichheld and Bain & Company to a new level. The NPS is based on customer survey data, while NewBrandAnalytics uses only unstructured data from social media comments. Its measures reflect the power of aggregating unsolicited opinions.
At the time of writing, it was not yet clear whether this approach would be sufficient. NewBrandAnalytics primarily uses unstructured data. As we have seen, structured data normally generate insights more easily and accurately, so it could be that services like Qype, which queries customers directly to give feedback in a school-like grading system, will be better suited to judge consumer preferences.
You see a similar situation when you turn your attention to the quest for good doctors. How do you locate a good physician for you and your family? People generally do one of two things: they ask the opinions of family and friends, or they simply choose one based on criteria such as location. Today, social media often also enables consumers to see what other members of the public think of these doctors. Thus, similar to the approach from NewBrandAnalytics or Qype, you could create a metric mining this commentary about the doctors. However, such a metric might not be as reliable as in the case of restaurants. While each of us is totally able to judge a given meal or a service received, we are less able to judge whether a treatment was correct or whether an examination by a physician was done well.
But what if you could see what doctors themselves think of other doctors, particularly the patterns of referral from one doctor to another? Thanks to publicly available data, we may see more of this in the future. Health data activist Fred Trotter (@fredtrotter) recently crowdsourced funding for a product called DocGraph, based on US Medicare referral data he obtained via a Freedom of Information Act (FOIA) request,[174] while startup firm HealthTap is combining this data with its own physician database to provide customers with a view of these referral networks.[175] In the future, it might be that the process of choosing a physician will become increasingly informed by referral data in the same way that link data has helped Google to rank web pages.
Again, the success of this metric will surely depend on how it performs in terms of:
- Causation
Are doctors who are referred by others actually better physicians?
- Error
Is this metric stable and helpful more of the time and more helpful than asking family and friends?
- Cost
In this case, the data is publicly available.
In both of these cases, restaurants and doctors, the key point is to what extent are metrics such as these related to the question. This relationship often does not exist despite seeming to based on our human logic. As we saw in Chapter 8, the number of views or comments on a YouTube music video are not necessarily the best predictor for music sales. The percentage of negative tweets about a politician sometimes relates to and sometimes does not relate to whether this person is ultimately elected. The creation of such a metric demands more than pure wishful thinking. The degree of causation, error, and cost of the resulting data needs to be validated by in-depth research for each situation where the metric is applied.
One special metric is the return on investment (ROI). Few metrics are more controversial than the ROI in social media. Many believe that there should be a ROI, since a link between marketing or communication spent and a financial return seems logical. However, it is not enough to simply believe in the link. Since ROI is a measurement, you need to be able to actually measure it.
Some have compared the use of social media with the use of business cards. Like business cards, social media is a must, or a kind of “hygiene factor,”[176] something that will effect you negatively if you do not have it. Arguably business cards are cheaper then an engagement within social media. However, in both cases, it is hard to correlate directly with ROI. Even if the use of social media is beneficial, it does not mean that a ROI exists.
In order to calculate ROI, you need to be able to quantify the “R”, i.e., the return on a given investment. However, you can only quantify the return in the following cases:
If there is a direct relationship between the investment with financial return. Only then ROI values can be calculated. However, all too often, other factors may have an impact on the return, and thus a return on this very investment can’t be calculated.
If there is no direct link, you can test to see if there is a correlation between the measurements and a financial return. This, however, is only possible if the measurements can be taken independently.
The easiest situation is the one in which there is a direct correlation. However, in most cases, a direct link can’t be easily established. For example, in 2005 a computer manufacturer, which sold much of its offerings online, invested in radio advertisements. The manufacturer assumed that there was a good correlation between the investment in a radio advertisement and the number of systems sold. Thus the company took the sum of all margin dollars earned on this computer bundle and subtracted the investment. The result was highly negative. Dividing it by the number of computers sold, our client lost $650 for each computer sold via this advertisement.
Would it appear to be a no-brainer to stop such a waste of expenditure? Not necessarily, as customers might have heard of the offer but decided to buy another bundle.
Situations such as these are very common for social media or broadcasting media like TV and radio. The main problem is that a decision to purchase something might be caused by many things, most of which are not easy to measure. In Chapter 1, we discussed how brand awareness and intention are linked. Before a client buys something, he might have had other interactions with the brand. Each of those interactions might have had an impact on his purchase decision. For example, he might have first visited the Facebook fan page, then seen an article in the news, and then exchanged some tweets with others before buying the product. All of those interactions might have played a role in triggering the purchase. Many analytics tools today try to map out this kind of customer journey. This works only if the customer can be tracked, not easy within a broadcasting medium like radio. One way to track a radio advertisement is to establish a link through a dedicated landing page or through a dedicated phone number to better track what those clients have done. Another way is to use multiple regression analytics to see whether each time the radio advertisement was played there was an impact on other marketing channels.
More often than not there is no ROI. This is either because the direct link to a financial number is missing or because a multivariance analysis might confirm that it is not easily possible. The analysis issue is that each test needs to be independent from others. That is, unfortunately, not the case for a lot of social media activity, similar to the situation from BP as discussed in Chapter 9. Take, for example, the impact of an active Twitter account. Unlike a promoted tweet, this cannot easily be turned on and off. Even if you were to switch the Twitter account off, the test would not be independent because the users who always listened to and engaged with the Twitter account would also see it switched off. Thus in those situations where testing is not possible, you cannot calculate a ROI.
Let’s assume we have created an accurate metric, one that addresses an appropriate question. Thus, the metric allows us to get the fourth “V” from the data. Or in more technical terms, following our three dimensions in Chapter 9, a metric that correlates with the desired question has low error and is overall not too costly. Can you simply rest easy and start using this metric? Not quite. Any given metric will trigger attempts to either influence the metric or to over-optimize the system to look good for this metric.
As one example, we will once again return to Google’s PageRank metric, which we praised so many times. It was brilliantly designed to reflect the actual popularity of a web page. However, if you do a Google search on the phrase “rank first on Google,” you will find over a quarter of a billion pages containing advice on how to change this rank. This is the art of search engine optimization (SEO) services. This means that the top page ranking sometimes may not go to the most popular site, but to the craftiest web developer. The risk that a metric is influenced or gamed applies to every metric. We call it the “measurement paradoxon.” The more successful a measurement is, the more effort is undertaken to influence it.
Even the best of metrics, with the best of intentions, create a risk of people focusing on improving the number instead of improving the desired outcome. This is particularly true when there is a financial incentive for doing so.
In general, you can say that as soon as a measurement becomes a defining factor for the measured, there are attempts to improve or influence this score. Take Klout as an example. The San Francisco-based startup claims to be the standard for influence. It looks at different patterns on Facebook or Twitter to assess one’s personal influence.
There are many who claim that the Klout score is an important criteria for being hired by someone. If this is true, what would those looking for a job do? They would try to influence it. The measurement paradoxon demands that if this claim is actually true and Klout is really an important metric, then there should be many attempts to influence the score or to game the system. For sure, there are already hundreds of sites that claim they can help you to improve your Klout score. Paradoxically, if those attempts are successful, it will reduce power of the metric, since it would be gamed and not correlate sufficiently with the desired question.
Let’s test how easily the Klout score can be influenced. We set up a Twitter robot using very simple tools.[177] This robot, called @spotthebot, admits that he is a bot. He only repeats common news sources. We bought a couple of followers to influence any metric about him. The result? Without lots of work, he managed to get to a high Klout score. This small experiment is supported by ample research showing that social media influence scores can be influenced easily. @spotthebot used fake users to build up his metric; however, with a little bit more diligence, one can actually influence those scores by using real users. One of the first to show this was the Web Ecology Project. In a competition, social robots grew their Twitter networks with real users. The bot JamesMTitus managed to get 107 followers in just three weeks just by automated means.[178] Since then, many have followed suit and shown how easily you can increase online interaction[179] not only in Twitter but also in Facebook.[180] Friends, followers, and interactions can be manipulated, but all those metrics are important for measurements such as the Klout score. We saw more of those examples in Chapter 6.
What does this mean? On one hand, the Klout score or any other similar score showing importance is very much the right metric to look at. The market demands it; otherwise, there would not be so much attention in trying to game such a metric. On the other hand, the measurement paradoxon tells us that Klout is most likely not the right metric, as it is too easy to game and thus will not have sufficient correlation with the question asked.
A good metric is one where many try to influence it but where those attempts fail. Right? Yes! However, this is not the only description of a good metric. Unfortunately, a metric—even when it is hard to be influenced—can create wrong behavior. Take financial metrics as an example. Accounting figures are hard to fake, except if you commit a crime. Also, most financial metrics have a good correlation to your question, in this case, the future enterprise value of the measured business.
Does this all sound like a clear win in terms of how to get to the fourth “V”? As we learned in the 2008 financial crisis, financial metrics are far from perfect and within each metric there is an inherent risk of creating a wrong conclusion or wrong behavior. This was unfortunately quite clear during the subprime mortage crisis. The performance metrics for many financial institutions would incentivise the upside of the risk and not the potential downside. Thus the financial institutions ended up taking too much risk.
Thus creating wrong behavior is an imminent risk for any given metric, and you may well find examples of this in your own company. One of our customers was a large online retailer that praised itself for having the lowest CPO (cost per order) in the industry. CPO is a metric in the online advertisement world. Though not impossible, it is hard to influence. Moreover, it seems to link quite well with the overall question of increasing revenue. The cost of an advertisement is only accounted for when, and only when, the consumer clicks and buys after the advertisement is shown. This metric seems to be a great one. No orders, no accounted cost within this metrics.[181] So do we just have to focus on reducing the CPO?
This is exactly what the company did, and it created wrong behavior. Working with agencies, the company launched campaign after campaign and optimized each campaign for a low CPO, until it realized that its active customer base had become smaller and smaller. What happened? The agencies or the algorithms at the agencies had learned how to identify a low CPO. The agencies showed the online advertisement only to existing customers. Those former customers knew and trusted the brand, thus they had a higher likelihood to buy again compared to users who never had been in contact with the brand. Taken to an extreme, the company only addressed current users and did not win any new customers.
In addition to the impact of people, there is the impact of the changing environment. This is especially true in high-growth fields such as social media. If the underlying content changes dramatically, the outcome of the metric will change as well, which will mean that the metrics are not easilty benchmarked or compared, unless you account for those changes.
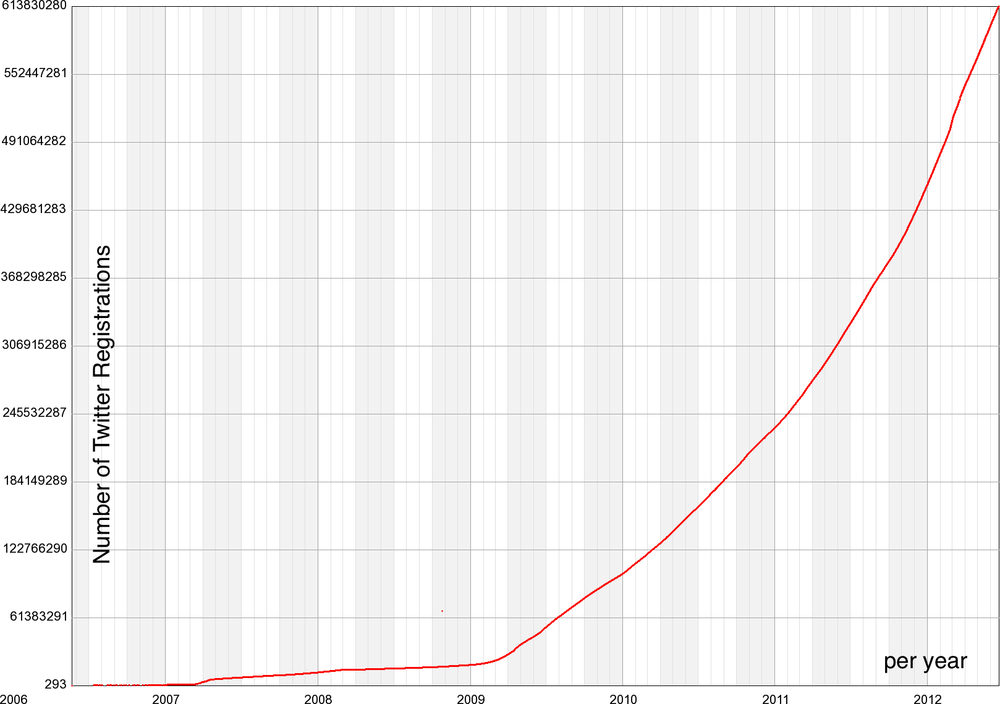
For example, the massive growth of Twitter usage (as seen in Figure 10-2) means that tweet statistics from one year may be completely meaningless relative to the following year. Tweet volumes that were once on the order of thousands of tweets per day are now on the order of half a billion per day as of late 2012, simultaneously increasing your audience while often making it harder for your message to be heard. This can make backward comparisons in time almost impossible, unless you know how this metric evolved. Similarly, click-through rates for online advertising dropped precipitously from the 1990s to the second decade of the 2000s, as usage of the Internet became ubiquitous and banner ad exposure became saturated.
Not only is the absolute usage an issue, but regional differences are important as well. Within social media, it can be hard to compare metrics across regions. Currently, the adoption of Twitter is quite different in English-speaking regions compared to the rest of the world. Not only do you need to account for regional adoption rates before you can compare across countries, but the relative rates can change quickly.
Take Twitter again as an example. From November 2010 until mid 2012, most tweets (27%) originated in the United States, followed by Brazil (23%) and then Indonesia (11%). The Netherlands, with 3%, is actually in fourth place, despite its population size, which is less than 3/10 of a percent of the world’s population.[183] However, those figures are still changing as the adoption of social media progresses, making it very difficult to compare metrics across time and space.
Despite the difficulty of comparing any metric over time or space, whether it is a Google PageRank, the volume of retweeting, or a more complex metric tied in with business outcomes, it must be benchmarked against time, space, or other similar data to reveal relevant information. In much the same way that personal income values are substantially different in most countries than they were in the 1950s due to forces such as inflation and growth, both the value and the context of these metrics will continue to evolve.
We saw that the measurement paradox, wrong behavior, and changes over time all create issues in setting up a good metric. There are no bulletproof ways around those issues, except being aware. Anyone setting up a metric should ask whether or not it’s on risk. If it is, there are ways to reduce this risk by altering the way the metric is set up:
- Closed metrics
Companies will develop individualized metrics for a specific situation or defined groups, making it difficult for the metrics to be influenced. For example, we see that TripAdvisor now uses Facebook’s Open Graph to create a closed measurement group of “recommended” hotels. Since I know (or should know) all my friends, influencing this score is more difficult.
- Secret metrics
Google is the best example. It doesn’t publish its PageRank algorithm because that would easily open the doors for any search engine optimization company to directly influence the ranking at Google. Any new measurement company, however, can’t keep its metric secret so easily. As argued earlier in this chapter, you should not trust an approach that is like a black box. To create trust, you need to be open about the metric.
- Change metrics
Changing the metrics has two positive side effects. On one hand, people trying to influence the metrics can’t follow them so easily. On the other hand, the metrics company itself can react to the underlying changing environment. Again, Google is a good role model. As Stephan Spencer (@sspencer) showed at the PubCon, Google updates its relevance algorithm more then 40 times in a given month (Figure 10-3). However, changing the metric will create the additional difficulty in comparing present-day data to past.
![Google updates its algorithm very often (Courtesy of Stephan Spencer [@sspencer].)](http://imgdetail.ebookreading.net/business/81/9781449336806/9781449336806__ask-measure-learn__9781449336806__httpatomoreillycomsourceoreillyimages1952234.png)
Metrics ultimately provide structure to the interpretation of data. Moreover, they are a necessary component of the process that links unstructured data of social media to outcomes such as customer satisfaction, brand recognition, and market share, topics we explored in more detail in previous chapters. At the same time, the definition of appropriate metrics remains a task that has both qualitative and quantitative aspects: your experience and your data both play an important role in creating the right measurements. The right metric to yield the fourth “V” will correlate the question with data and satisfy the three criteria discussed in Chapter 9: causation or correlation, error, and cost.
By using examples from restaurants to doctors, we showed that defining a metrics is both an art and a science that is hard to perfect, and at times hard to predict. We saw that social media presents a unique opportunity to quantify the relationships we have with customers and other stakeholders. We also saw that social media might not always be sufficient, as in the example of doctors and the hiring process.
Second, metrics have inherent risks that must be managed over time. They carry the potential for misuse and misinterpretation. You can overcome this paradox of measurement by using metrics in closed groups, keeping the metric secret and changing it often. Thus, metrics are not static entities, but rather dynamic measures that evolve in response to both change and human intervention. Any metric will need constant checking and reiteration and will continue to evolve.
Each business is different, therefore each business will need its own metric. There are very few “one-size-fits-all” metrics. So let’s get you started on your own metrics. But be aware that getting to the metric that creates value is partially trial and error (some call this hard work) and partially just pure luck.
Let’s look at the data sources you listed during the last exercise. What could be good metrics to form out of those? Lets start with descriptive metrics. Try to do different ratios to get your thinking started. How about the time customer care needs to solve a ticket versus the length of the ticket? Or how about the numbers of followers someone has versus the number of tweets he writes? Found something interesting that can be shared? Tweet at @askmeasurelearn or write your question on our LinkedIn or Facebook page.
Any metric is exposed to the measurement paradoxon. To detect it is super important because a wrong metric could easily risk the future of your company. Ask yourself, ask your friends, and ask your clients if any metric you use is misleading. A good indication could be any sentence that starts with “this is stupid” or “this is just not true.”
[172] In Chapter 1, we see that the power of influencer in most cases is overstated. Influence exists, but it is very hard to measure, if measurable at all, in a social network context.
[173] Irene Kim, “What’s that Buzz?” Cornell University, http://bit.ly/1bKxEfd.
[174] Fred Trotter, “DocGraph: Open social doctor data,” Strata O’Reilly, Nov 2012, http://bit.ly/1helGQA.
[175] Ki Mae Heussner, “Who are the doctors most trusted by doctors? Big data can tell you,” GigaOm, Nov 2012, http://bit.ly/JshosT.
[176] The term hygiene factor was first used Fredrick Herzberg. It refers to factors that affect an outcome negatively if they are not there (http://bit.ly/18RdbZz).
[177] Michael Wetzel, “Remote-Controlled Spin,” Sep 2013, Deutsche Well TV, http://youtu.be/TwOdxnkVP7Y.
[178] @aerofade, “Robots, Trolling & 3D Printing,” Feb 2011, http://aerofade.rk.net.nz/?p=152.
[180] Yazan Boshmaf et al., “The Socialbot Network: When Bots Socialize for Fame and Money,” ACSAC, Dec. 2011, http://bit.ly/JzlIar.
[181] We use the term “accounted” here because there might be real costs. Companies might buy large placements and pay whether there was a resulting order or not. But the CPO metric is an overlaid metric, describing only the cost associated with the ones who bought.
[182] This graph is accurate only up until mid-July 2012, when Twitter changed the way it allocates user IDs.
[183] Britney Fitzgerald, “Where Tweets Are Born: The Top Countries On Twitter (MAP),” The Huffington Post, July 2012, http://huff.to/19tgEy1.