
Public relations is what you do with what you know and what others think about what you say.
Just after Facebook went public with an IPO of over $100 billion, Mark Zuckerberg updated his status on his own Facebook page: “Mark listed FB on NASDAQ.” Is this comment a form of public relations (PR)? Yes, Zuckerberg decided to publish some information about Facebook to the wider public. However, it is not the way PR traditionally used to work. In his case, no communiqué was written, no news embargo was requested, and surely no PR agency was hired to do this update. No, Zuckerberg just updated Facebook. That’s it!
Is doing public relations work in an era of social media data as easy as updating a Facebook page? Yes and no! Many startups and smaller enterprises are profiting from this ease. Social media has created a “long tail” for PR activity similar to how online advertisements within Google or other services became more affordable for small and medium businesses. Will this in turn mean that we have reached the end of the PR profession? Not at all—in fact, the opposite is the case. Because of all of the new possible ways to communicate, PR work has become more complex. However, we now have more and better data with which to analyze the effectiveness of PR.
As James E. Gruning states it in his quote at the beginning of this chapter, public relations has two major tasks: to distribute and to warn. On the one hand, company information has to be distributed to clients, employees, stakeholders, or shareholders. On the other hand, the PR teams have to analyze how the information is spreading, in order to give warning if any unforeseen issues are arising.
PR professionals might argue that this is an oversimplified view on the world of PR. They often see relationship building with influencers as part of their work. In this book, however, we stick to measurements and social media. These two, however, restrict PR in the way Gruning described PR. Social media offers new ways to distribute information. Measuring surrounding social media helps identify early warning signs if things get out of control. In this chapter, we will look at the data and metrics supporting those two main tasks in more detail:
- To distribute
At Measuring People we will see that the act of distributing information is centered around individual relationships between people. Despite the open nature of social media, it has not changed the way PR works, and thus the famous Rolodex and trusting relationships are still PR’s biggest assets. What has changed, however, is that by the virtue of social media, there are measurements to assess those individual networks and gauge how central someone is within her own network. Further on, we discuss in Measuring Distributing which metrics are best suited to assessing the success of such a distribution.
- To warn
The use of new media has also created new possible PR issues, which we discuss in PR to Warn. We will see why no tools or predictive algorithm can provide a good early warning system. However, by using social media engagement metrics and network topology, one can anticipate critical situations beforehand.
Many of the metrics that we will discuss in this chapter have made PR work in a more transparent and reliable way. Moreover, as PR has its touchpoints with the entire pre- and post-sale cycle, it shares many of the concepts we discuss elsewhere in this book. Take reach metrics. We discussed in Chapter 1 that reach is an important prerequisite to create influence. We will revisit this definition of reach in more detail because this metric is significant for PR professionals.
We stressed that the fourth “V” in data is the value also discussed as ROI (return on investment). Traditionally, the financial impact of PR was difficult to measure for most businesses. The PR industry tried many things to become as measurable as its colleagues next door within the marketing departments. It even created the Advertising Value Equivalent (AVE), a measure which already states in its name the desire from PR, to be as measurable as advertising is. But since the AVE was not calculated in a sufficiently independent way, it fell short of solving the ROI debate. Often, “impact” numbers like the AVE are made up freely by PR and marketing agencies to impress their clients. In our day-to-day work we have heard it more than once that a client requested a “number” to look better in reviews.
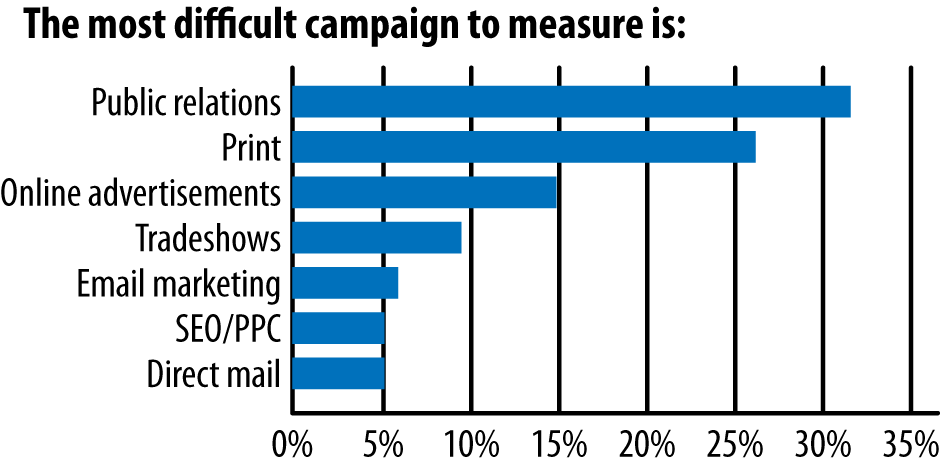
However, as discussed in previous chapters, social media comes on a wide range of new measurements. But more data does not necessarily mean better data. Will these additional social media data help to find the missing ROI in PR? In most cases, the answer seems to be “no.” As you can see in Figure 3-1, the respondents to surveys done by ifbyphone claimed that PR campaigns are still seen as the worst to measure.
We believe that this situation will not change, no matter how many new measurements the industry might invent. A ROI can be only calculated if our social media measurements can link to financial metrics either directly or inderectly. Later in this book, we will discuss the impact of metrics on ROI in more detail.
This link to financial metrics is what often is missing. If PR distributes information on the company, it is often as generic as the update from Mark Zuckerberg. It is probable that no one would have subscribed to Facebook because of this message, but it was an important one. Unlike an actionable marketing message, that information doesn’t have any action attached, therefore linking to “hard” financial numbers is not possible.
There are even many companies that refrain from any communication. Take the company Moog, which produces motion-control equipment. The company would often compare itself to parts of General Electric or Siemens. Have you never heard about them? No! That is not surprising because they have very limited PR activities. They do not distribute any information except if they have to. Does this hurt them? If you compare the financial numbers with their competitors’—who do PR—then there is no conclusion possible. We can neither say it was good to do no PR nor could we state the opposite. Another prominent example of such a “no PR”-strategy is the German food retailer Aldi. The company is one of Germany’s biggest and most successful supermarket chains. It doesn’t have a PR department, but that hasn’t hurt its overall success in the market.
Often a direct link between distributing information and succeeding financially can’t be established, and the PR industry seem to have given up on the quest to measure the ROI. But the fact that there’s no direct link doesn’t mean that PR has no value. Take the financial impact of PR failing to anticipate or warn about upcoming issues. With regard to this, Michael Buck, global executive director for online marketing at Dell, twisted the meaning of ROI of social media into “ROnI.”
It should not be called ROI, but ROnI = Risk of not investing
PR has a clear value, ranging from reduced hiring costs due to a good image as an employer to better retention rates as clients identify themselves more with the company. However, it is difficult to impossible to attach a real financial value to it. This was always the case in the finance industry, and many thought that because of the vast amounts of data within social media, this would change. But it hasn’t.
omgg, my aunt tiffany who work for whitney houston just found whitney houston dead in the tub. such ashame[d] & sad :(
—Aja Dior M (@AjaDiorNavy)
To distribute information is a people business. Neither in the real world nor in the social media world are all people equal. Their distribution power is different. Aja Dior tweeted about Whitney Houston’s death 27 minutes before the official news was released.[60] However, Aja’s message did not spread any further because she was not connected to the right networks of people. As Gilad Lotan (@gilgul) from SocialFlow showed, the initial message from Aja did not go very far. Figure 3-2 shows as nodes all the user who responded to AjaDiorNavy’s tweet. The connections indicate how the information went from one person to the next. The color indicates when someone reacted to this news. Only once the big news agencies released the information was the message distributed to a wider audience, as shown in Figure 3-3.[61]
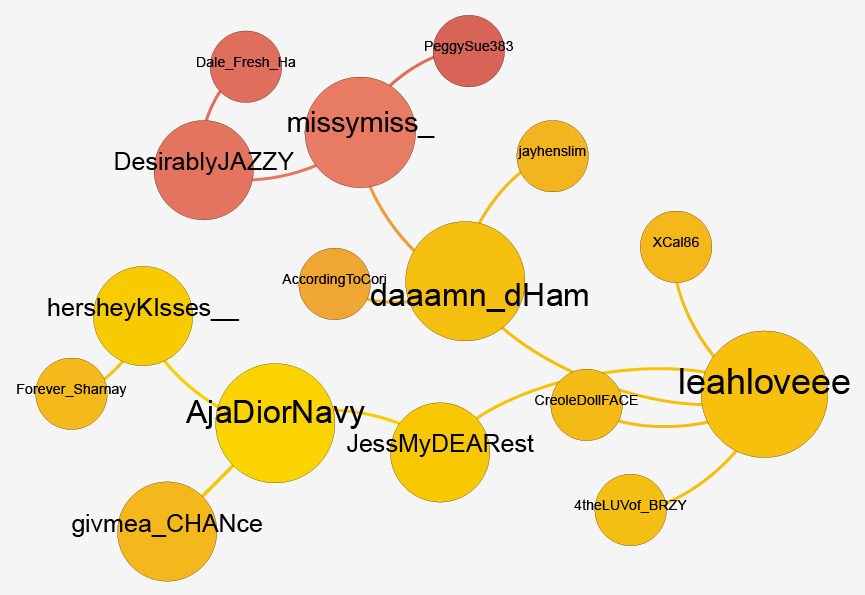
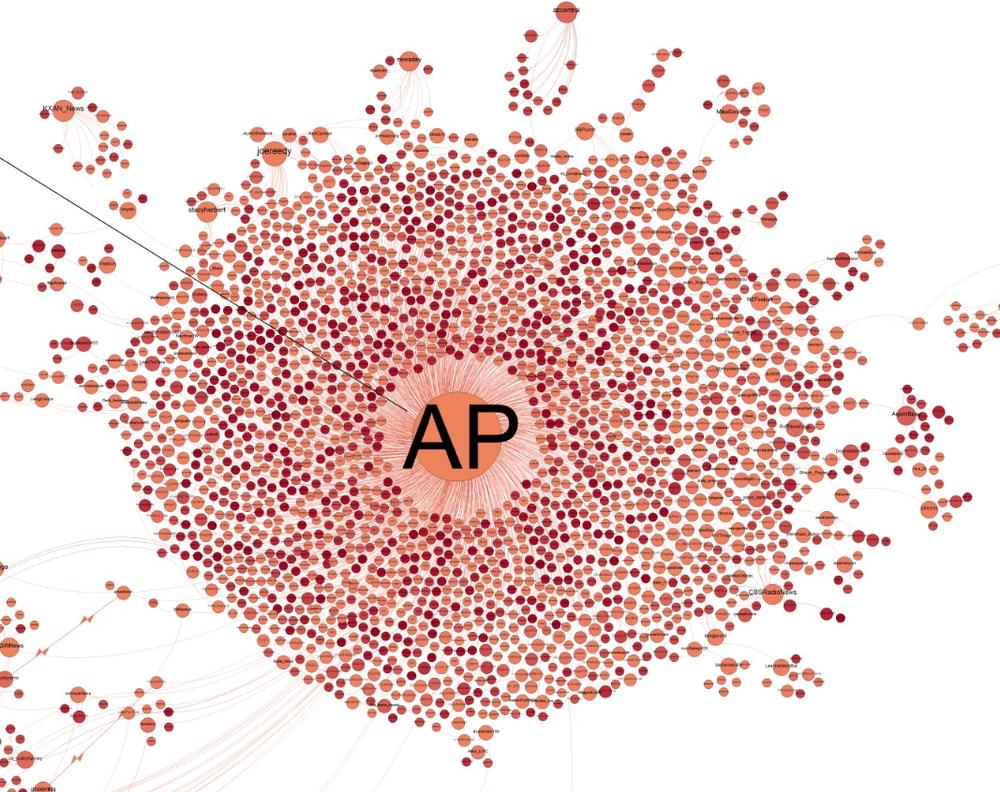
In the traditional PR world, professionals are needed because they know out of experience whom to call in order to best distribute information. Stored in some form of “Rolodex,” the PR professional would have names and contacts who allowed him to spread the message easily. Social media has the theoretical ability to connect everyone to everyone within a few clicks. Despite this, the need for the “right” connection has not changed. The information flow is free and everyone can easily participate, but as one can see in the case of Whitney Houston, not every person is equal. Some are better positioned to spread information than others.
While this idea is nothing new, the onset of social networks makes it easier to measure the flow of messages. Anyone can start measuring public discussions and identify persons central to the discussion. There are two main measurements to assess the ability to spread a message:
We will define those metrics in the following sections.
Warning
As we discussed in Chapter 1, people who can easily reach many others have often been labeled “influencers.” This term is wrong because their power to really influence has been widely overestimated. It seems that most people are not influenced directly but rather follow a predefined homophily. However, in terms of dissemination of information, or reach, the position within a network is vital for the overall speed with which information can be distributed. Thus, there are people who can reach more than others.
Reach within PR is often defined as a measure of how far certain information was distributed and how many people or “eyeballs” were reached. Unfortunately, this metric is quite different depending on whether one looks at online media, social media, or traditional media:
- Within Online Media, reach is best described by page views or how many people clicked on the site.
In theory, this should be the most accurate description of reach. But the devil is in the details, or as usual, measurements. There are several ways through which you as an owner of a web page can count page views. You could use a tagging system by which you play out a cookie to each visitor. The data derived from here will largely differ from the data you might draw up from your own log files. Why? In log files, you measure every visitor. Therefore you will measure scrapers and search engines as well as regular visitors. In the cookie-based systems, you measure only those visitors who actually accepted a cookie.
As you might have already imagined, for websites that you don’t own and therefore can’t place cookies on or analyze log files for, it’s impossible to define reach. However, there are third-party providers (such as Alexa or Compete) that try to help with external measurements.
- Within Social Networks, reach can be best described by the measure of centrality or “betweenness.”
This describes how well a person is positioned to distribute information. The more central or between a person is in regards to other people in the network, the better she can control the flow of information. For further reading, we recommend the article from Linton C. Freeman, “Centrality based on Betweenness.”[64]
The best way to measure centrality is to use software tools like Pajek. If you’re looking for prepackaged measurements, there are several tools, like klout, kred, or peer index, that wrap several measures into a single number. The downside of those prepacked measurements is that the more common they are, the more people will try to deliberately influence them, as we will see in Chapter 6.
- Within traditional media in TV or print, measures of centrality cannot be easily applied because the network topology is not easily measurable.
Instead, circulation rates describe in some form the impact of the news source. Unfortunately, circulation rates are based on TV program or a new source. A standardization body takes care of the audit. Social media outlets there are millions and millions thus stanardized and audited circulatio rates are harder (if not impossible) to set, knowing the circulation of a newspaper will not identify who the “gatekeeper” or “connector” is. Short of circulation numbers by journalists, traditional PR professionals use job titles and positions to assess the personal impact and power of a specific journalist. As you can imagine, this is a very subjective measure since different media companies use different words. A “senior editor” might not be that “senior” in another company. A big advantage of reach figures is that they are reliable. A standardization body takes care of the audit. Such an audit is not possible within social media outlets as there are many millions of them. It will be hard to get a standardized measure for them.
Those differences in the measurement make it difficult to compare the traditional media world with the social media one. Each measurement—reach or centrality—within its own world (reach within traditional media or reach within social media) will work, but it’s not possible to mix and compare those measurements. Thus, you can’t compare the reach metrix from traditional media with the reach metric from social media.
The right gatekeepers can help to distribute a message effectively; however, the context of the message is equally important. Each of us knows from experience that news like Whitney Houston’s death is met with strong emotions and will spread easily. But how about an update of, lets say, the corporate privacy policy? That’s less interesting, except when it is published in the midst of a public privacy debate, like the one surrounding the revelations by Edward Snowden.
Whether a message spreads or not also depends on the context of the message and the surrounding mood. Joseph E. Phelps and colleagues from the University of Alabama in 2004 examined which email topics get passed on. Not surprisingly, certain topics were more easily forwarded than others. While 48% of all emails containing jokes were forwarded, only 0.2% of all political messages were forwarded. Context plays a very important role.[65]
What does this mean for marketeers that jokes get forwarded so easily? Does this mean that would-be social marketeers need to start cracking jokes? In some cases, this is exactly the strategy that advertisers follow. For example, every year in the United States, humorous television advertisements are a tradition of the Super Bowl broadcast. Advertisers often create their very best work for this telecast, and the most memorable ads are subsequently seen by millions of people on YouTube and other websites. People spread links to these ads to their friends, primarily because they are funny, and the advertiser gets brand recognition in return.
Jokes aren’t the only content that spreads. People also spread emotional and important information. Thus, another key conclusion we can derive from this study: people spread information based on their level of interest in it, as both readers and senders. We refer to this as the context of the content and the context of the author, which we describe in the following sections.
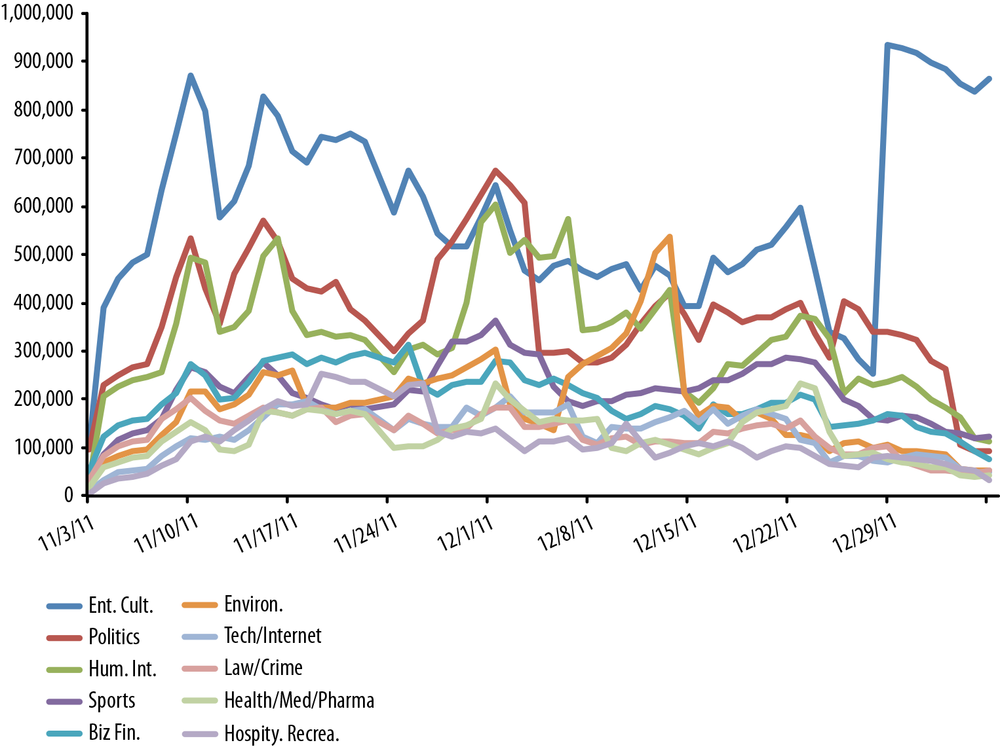
To estimate the context of content, one could use trending topics from messaging services like Twitter or Sina Weibo. Fisheye Analytics experimented with something which it called “mood of the nation,” showing which news topics created the most engagement from the audience. Figure 3-4 shows a two-month period of UK newspaper articles and the respective discussions by their audience. In the beginning of the month, there was a high interest or a high number of articles in the entertainment and culture sections. This was mainly due to Frankie Cocozza, who was kicked off a television show called X Factor. Those news stories decayed over the course of the month. At the time of this writing, articles from the entertainment and culture sections are spiking again as we move toward New Year’s Eve: many stories appear on fashion tips or what the stars will do for New Year’s Eve. The question surely is what here is a leading and what is a lagging indicator, as we will discuss in the BP example in Chapter 9. Was it that the general public showed less interest in entertainment discussions, or was it that the journalists realized that there was nothing to add to the recent discussions? It was probably a combination of both, and it showed what the general journalist community considered newsworthy.
As one can see, the news cycle isn’t cyclical and doesn’t follow a weekly pattern. During those two months, there were several political news stories of interest, each of which had its own long tail in the news cycle.
Thus it is a good measure to balance various topics. For example, one can see that the topics on environment peaked in interest. To launch a message at the right time, it is important to understand the overall “mood of the nation.” The more public interest there is already, the easier a message will be distributed. Companies like socialflow and others are offering services around those measures.
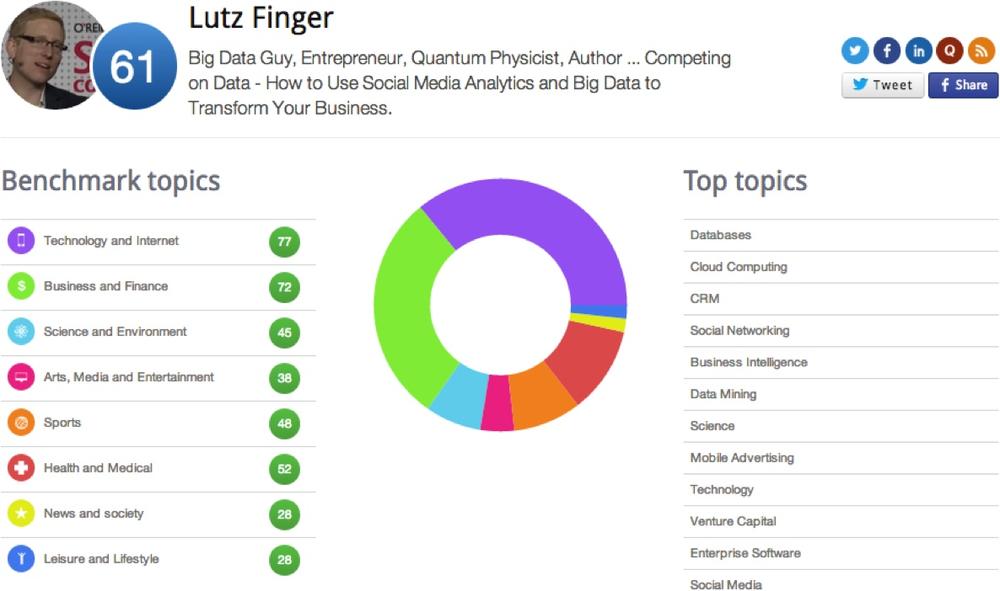
Next to this generic mood of the nation, there is also the context of the author: What does a specific journalist or blogger like to talk about? What excites him? Such background information is highly important since the pure knowledge of who is a “gatekeeper” will not help alone to distribute. The information we want to distribute needs to fit the interest of the gatekeeper. The measurement of this kind of context is best done by word clouds. There are many tools available to generate word clouds for the context of an author. See Figure 3-5 by peerindex to learn about the topics discussed by Lutz Finger. But again, be mindful when you start to compare those context charts or measures across different media types. Lutz Finger’s interests depicted as a word cloud would look quite different if you take this book as data source compared to his Twitter account. Since the latter has the constraint of 140 characters, the information will be more pointed. However, both word clouds will contain the hint that the main interest of Lutz Finer seems to be data, social media, and analytics.
All of those tools have their shortcomings. In the simplest case, the tools use only word clouds. They are created by counting words and listing the most common ones. Such basic algorithms would not be able to understand that “debt crisis” and “euro crisis” should belong to the same group. To overcome this kind of shortage, one could use predefined entity extraction, or even better, train the algorithm. Both approaches can yield very accurate results; however, this will take time and effort to set them up for the specific requirements.
The first obvious use case of metrics like centrality and word clouds is the creation of a detailed database on journalists similar to the creation of a social CRM that we will discuss more in detail in Chapter 5. There are already noteworthy attempts of using social media data to create those databases. For example, the British Gorkana Group offers insights into journalists and bloggers:
We know the journalists, what they are writing about, and where they are going next. We know who you need to know and we are here to help you get to know them too.
—from Gorkana Group
One would be wrong to conclude that context and reach within a database will solve the question of who is a “gatekeeper” and who is not. An in-depth analysis of 1.6 million Twitter users found out that for sure the largest reach is generated by the ones who are central to a network, supporting what we saw in the case of Whitney Houston. However, the team around Eytan Bakshy (@eytan) from Yahoo! research also found out that no reliable prediction could be made about which tweets would spread and which would not.[66] At the end, it comes down to the fact that communication is human.
While there are ways to measure centrality and context, it would be hasty to conclude that one can easily distribute a desired message by only measuring those two metrics. During the onset of social media in the early years of the new century, this was a common trait in the discussion. Measurement companies surfaced left and right. In essence, communication is a human interaction; and while tools can guide, execution and trust within PR work are more important than any of the preceding metrics. For journalists and bloggers, the trust of their readers is their core asset. News has become a commodity which is accessible almost freely at any time everywhere. The value of information is not the information as such, but the ability to explain, sort, and organize the news around you. Those efforts go beyond pure information and require trust on behalf of the readers.
If, for example, you just started some charity in the educational space, an influential person to connect to could be Bill Gates. With more than 7.5 million followers on Twitter, he is definitely a well-connected person. Moreover, his own foundation has a strong focus on educational matters. So that seems like a match: high level of centrality and the right context! Why not ask him to distribute the word about your own charity?
Because the likelihood of that working is low.
While it might be easier today to reach Bill Gates then it was pre-social media, it is still as difficult to build trust or form relationships. In order to get someone to support your cause, you will need to convince him to. Robert Cialdini, professor of psychology and marketing at Arizona State University, has best described the process with the six key principles of influence: reciprocity, social proof, authority, commitment, liking, and scarcity. All but the last two have gained a new twist and opportunity through social media:
- Reciprocity
People tend to return favors. Dale Carnegie described this best in his book How to Win Friends and Influence People (Ebury), published in 1936. Dave recommends thinking first about what the person you want to connect to needs and what you could offer him before reaching out. Steve Knox, CEO of Proctor & Gamble, called this reciprocal altruism and used it to describe how his company should engage with all its customers on social media. Social media has made it easier to reach out to people and give favors.
- Social proof
People are more likely to do things that that you see as “socially accepted.” Social proof through social media was best visible during the Arab Spring, as Clay Shirky, who teaches at NYU, has brilliantly described. The effect of social media during the Arab Spring was not the ability to easily connect and distribute information. It was the power to signal social proof. As Clay pointed out: “Governments aren’t afraid of informed individuals—they’re afraid of synchronized groups. In particular, they’re afraid of groups that have shared awareness.”[67]
- Authority
People tend to follow authority figures, as best shown in the Milgram experiments, where psychology researchers convinced subjects to continue shocking people who pretended to be other subjects, even when they cried out in pain. Who is an authority and who is not has become blurred within the world of social media, and it easier today to build an authority by, for example, becoming very central in your own network.
- Commitment and consistency
Cialdini proved that people who commit orally or in writing are more likely to honor that commitment. In the context of social media, these are the previously discussed measures of context. If the person who you want to connect to already has committed herself to a certain view, then it will be easier to build up a communication around this view.
However, the extent to which information is available to the public can make what people know about you border on being creepy. For example, one professor at the MBA school INSEAD who was invited to a discussion roundtable of industry leaders was shocked to discover that the organizer had distributed a thumb-thick file on her containing all her previous public pictures and discussions.
This, however, is only the beginning. As of 2010, the United States has instructed immigration agents on how to use Facebook to “friend” applicants for US citizenship, to better understand the background of these people and potentially uncover cases of fraud or misrepresentation, such as being deceptive about the state of a relationship. Do you think that most people would reject such an invasion of privacy? Don’t be so sure. According to a 2007 survey by Sophos, 41% of people would accept a friend request from a random person.[68] Even worse, people are often tricked into accepting social media connections that may be instigated for fraudulent purposes such as identity theft.[69]
In the last section we discussed how to analyze whether a blogger or journalist is well suited to distribute information. Often within organizations, however, a slightly different question is asked. How well has the PR team distributed information for the organization? Thus a measurement for the overall effectiveness of a PR team is needed. We need to split this discussion into two parts. On one side, we need to measure the distribution power; on the other side, we need to ask how much we invested in order to archive the distribution. Let’s start with measurements of distribution power.
“We will meet every morning at 5:30 a.m. On our way to the office, one of us will have sourced the newspapers down in the valley,” explained Yann Zopf, associate director of the World Economic Forum to his students. During the annual meeting in Davos (Switzerland), about five students would, each morning, “clip” important articles from the day before.
The words “to clip” stem from a way of doing media monitoring. Each morning a few students would sit around with a pile of newspapers and “clip” relevant articles with scissors. At the end of this exercise, the articles would be counted. Afterward, all articles would be photocopied and placed on the desks of various managers. Today, surely Yann’s team uses Google and screenshots and no real scissors anymore, but you would be surprised to know how many organization still have “clipping departments” that clip real articles rather than digital ones.
This process can be automated. A computer can search the Internet for the relevant keywords and clip out the parts of the document which make sense. There are several companies that offer more automated ways of doing this, including Factiva, Meltwater, and Moreover.
However, those clipping teams do one thing that the algorithms from those automated clipping companies cannot do so easily: they read the article, evaluate the relevance to their internal audience, and take only what seems really relevant.
Algorithms can can do some of this. But a computer will take everything, meaning all articles fitting the given keyword. As a result, the users often get information overflow. We found that professional PR departments are disappointed by the way those automated clipping services function. “They are inaccurate; they are giving me articles I am not interested in,” a manager once complained to us. However, since the cost difference between a complete clipping department and the purchase of an online service is considerable, many companies move to those automated services and accept the reduction in quality. Plus, there are many ways to tailor the algorithms to the specific need of each client and improve what you get. The following measures are just a few examples of what could be asked so at to get more relevant articles:
Is the keyword part of the headline? If yes, it is more likely to be a highly relevant article.
Is the article long, and is the keyword used several times throughout the article? If yes, it is more likely be a highly relevant article.
Is the article published by a source that has good reach, as described earlier in this chapter? If yes, it is more likely be an important article.
Does the article contain content next to the keyword on which you have a special focus? If yes, it is more likely be a relevant article.
The World Economic Forum has moved away from its manual clipping service to an automated one. Using an automated service, it reduced manual clipping efforts which had at peak times clipped more than 30,000 articles per day. Not even its five-student team would be able to read them all. Using an intelligent system of reading lists, they reduced the work to focus on the most interesting parts. Today the World Economic Forum only needs one or two people looking over pre-selected articles for one hour, instead of five students “clipping” for two hours.
Note
There are some legal questions to be asked about today’s automatic clipping services. Already, the traditional way of doing “clipping” was borderline illegal. After an article was “clipped,” it would often be photocopied as well and distributed within the organization. Photocopying is a copyright violation. With automated tools, however, clipping companies are copying content from the Internet and charging their clients a fee. For the media companies, this is an even worse violation of their rights. The Newspaper Licensing Agency in the UK (NLA) started to take legal actions toward those automated clipping agencies. Meltwater tried to appeal this action in court and lost.[70] The end of this discussion is yet to come. Whether using automated clipping, like that done by Meltwater, search tools like Google, or content-curation tools like Flipboard or trap.it , many companies are starting to aggregate and republish information that is not their own.
The World Economic Forum automatically aggregates every article written about it. “It is not so much about the aggregation, but more about the smart insights,” explained Yann Zopf. This focus on insights is critical to success. All too often we see how clients replace the traditional way of clipping with an automatic one. There is no additional step needed to analyze the aggregated articles. Articles are compiled and distributed throughout the organization.
Since automatic clippings create way more content than the traditional clipping method, managers often do not view individual articles anymore but focus on one single number: the number of articles “clipped.” This number seemed to bring insights that suggested actions that could be taken. If this number was high, it seemed that the PR team did well; if the number was low, then improvements from the PR team could be demanded. Is this the number we were looking for in order to measure the performance of the PR team? No, it is not.
The number of articles may have made sense at a time before the Internet, when the pace at which content was published in newspapers was limited. A newspaper had a set number of pages. The editor decided what to put onto those pages and what to leave out, depending on newsworthiness. The number of articles therefore had a value because it described how often the keyword passed this selection process by various editors. Today in the digital world, there are no space limitations. Everyone can start a blog, and each magazine can churn out articles at an ever-increasing rate. There is virtually no space limit. Without a reduced selection process, the number of articles increases. Moreover, there are publications that have no selection process at all. Those posting services offer an automatic distribution of content to any website. For example PR Newswire Europe offers, for less than $400, a so-called “Online Visibility Package” where they promise to distribute your articles as widely as possible, including to global websites, news services, and content aggregators.
Distributed in English to US and European online destinations, including media and industry websites, on-line databases and subscription-based news services. Redistributed by aggregators such as Comtex, Dialog, Infodesk and PowerAdz.
—taken from an email by PR Newswire
Just because it is easy to publish does not mean that more people are going to actually read those articles. The more is not the merrier. It is even very likely that those articles are not seen at all, as they are published to websites that do not have a lot of traffic. However, the paid distribution will drive up the number of articles found automatically.
In addition to paid distribution, there is the second issue created by so-called spam blogs. These are blogs that exist not to be read but simply to be seen by Google. As Google uses activity on a page as an indicator of how well a blog is run, a blog that frequently updates its content is ranked higher by search engines.
Google and other search engines try to fight those practices, but these services still exist. One example is the Blog Post Automator.
You can also use articles from article directories and publish them with the author’s name as a kind of “non-exclusive” guest appearance. [What is a] completely automated-content-filled blog that runs on pure auto pilot worth to you?
—from Blog Post Automator
Given that anyone can buy distribution of this article, and given that there are tools that push random messages onto blogs, how relevant is the number of articles? Not very. If it is not corrected for those factors, it is outright useless.
But how do we measure the effectiveness of a PR team then? We will need to confine in some way the number of articles clipped such that only the important ones are viewed or counted for the overall measurement. There are two possible ways do this:
Those two approaches are described further in the following sections.
Reading lists serve two aims. On one hand, we avoid being subject to spam blogs or automated news replication as just described. On the other hand, we can create a comparable number for a publisher set that is important to us. If you count articles about you in a reading list, you mimic the process of having to clip from a stack of newspapers. The sources are selected by the client and thus are as trusted as relevant publications.
Let’s look at Figure 3-6, which Fisheye Analytics made for an insurance company in Europe. The figure shows the results of measuring how often several insurance companies are mentioned by various newspaper sources.
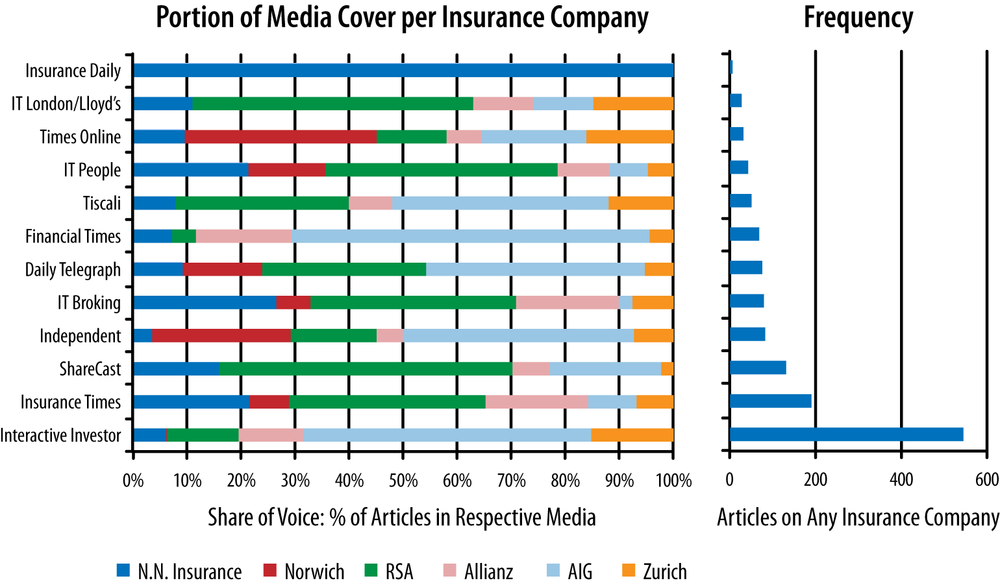
Is this useful? Yes, such an overview can be very helpful because it drives actions. Based on this overview, you can see which newspapers the client should strengthen their relationship with and which newspapers the client should ignore. This graph contains the insight into how much a given paper talks about insurance companies overall. This is a good way to show effort and impact as we will discuss later in this section.
We explained over the last few pages that the number of articles is a poor measure in analyzing the success of distribution. Reading lists are similar to panels because they give a focused view but also have to be designed manually. You might miss articles that gain attention or are important but were not published by the preselected sources.
Additionally, not every article, even from preselected sources, is equally important. We discussed earlier that editors have eased up in their selection process because there is unlimited space online in which to publish. Let’s again take the World Economic Forum at Davos as an example. Each year thousands of journalists meet participants at the annual conference and debate world affairs. Let’s look only at the world’s top-20 news publications. These are the big, reliable newspapers, and you most likely read one of those papers regularly. How many articles about the World Economic Forum do you think those sources that have great reputations in journalism will put online per day during the event? The answer is 30 articles on the World Economic Forum per day from one newspaper only.
A lower editorial selection barrier by the publisher results in more articles, which in turn means that not all of them are equally important, even when coming from the same publication. How do you select important articles and neglect unimportant ones? Let’s look at how editors at a newspaper would do this. An editor could trust her gut feeling—what does she think is important? Or she can use data and look at click rates: which article performs better—which article creates more reactions or the engages the reader?
Engagement is a combination of many different actions a reader can perform. Measuring these actions helps an editor or someone else understand whether an article was not only read, but also understood or appreciated. These metrics try to use the “democratic” powers of the readers. The more readers react to a given article, the more likely it is that the article is relevant. The metrics include the following:
There are surely other forms of engagement an editor might watch, such as the number of emails he gets on a given article from angry or happy readers, or the number of phone calls. However, those are not easy to measure from the outside of the newsroom and thus will not be discussed here.
As an example, please look at Table 3-1. The table presents the messages that were spread the most during the last quarter of 2011 in British newspapers, ranked by clicking, sharing, and commenting.
Table 3-1. Top news measured by spread in social media from October 14, 2011−October 28, 2011 (courtesy of Fisheye Analytics)[71]
| Rank | Source | Headline | Clicking | Sharing | Commenting |
|---|---|---|---|---|---|
| 1 | Guardian | The shocking truth about the crackdown on Occupy: US citizens of all political persuasions are still reeling from images of unparalleled police brutality in a coordinated crackdown | 14,448 | 189,230 | 83,288 |
| 2 | The Sun | Frankie Cocozza leaves X Factor: Frankie Cocozza has left The X Factor after “breaking competition rules,” according to the show’s producers. | 77,186 | 60,297 | 32,016 |
| 3 | BBC | Breast milk ice cream goes on sale in Covent Garden: The dessert, called Baby Gaga, is churned with donations from London mother Victoria Hiley, and served with a rusk and an optional shot of Calpol or Bonjela. | 6, 843 | 48,550 | 108,249 |
| 4 | The Sun | Tatt-poo for cheating: A FURIOUS woman is suing her ex-boyfriend after he tattooed a steaming poo on her back. | 41,157 | 53,030 | 29,307 |
| 5 | Daily Mail | Boy, 12, develops his own theory of relativity: A 12-year-old child prodigy has astounded university professors after grappling with some of the most advanced concepts in mathematics. | 30,739 | 52,468 | 31,001 |
| 6 | Guardian | Syria, Libya, and Middle East unrest—live updates: Muammar Gaddafi, who ruled Libya from 1969 until August this year, has been killed by forces loyal to the country’s new government. | 89,864 | 11,860 | 2,878 |
| 7 | Telegraph | EU bans claim that water can prevent dehydration: Brussels bureaucrats were ridiculed yesterday after banning drink manufacturers from claiming that water can prevent dehydration. | 6,870 | 51,227 | 42,018 |
| 8 | BBC | N Korean leader Kim Jong-il dies: Millions of North Koreans were “engulfed in indescribable sadness,” the KCNA state news agency said, as people wept openly in Pyongyang. | 12,952 | 57,683 | 25,106 |
| 9 | BBC | Deathly ice finger caught on film: A bizarre underwater “icicle of death” has been filmed by a BBC crew. | 12,966 | 56,909 | 24,311 |
| 10 | Daily Mail | Beyonce, Motown wedding dance mash-up by father-daughter the best ever? Rather than having a tender slow dance with her father at her wedding, one Texas bride decided to have a laugh. | 19,608 | 50,607 | 22,096 |
[71] SMI describes the spread of the article within social media. How many articles are retweeted, how many are liked on Facebook, how many are reused in blogs, etc. The most important headlines are headlines that have the greatest social media impact via social media metrics such as Facebook likes, shares, tweets, retweets. | |||||
There are many tools that track engagement. Most of the social media measurement tools utilize the first three metrics (clicking, sharing, and commenting). There are also free sites like sharedcount, yahelc, or simplereach for measuring engagement.
The copying metric is harder to find, as it is a relatively specific measurement that is often manually adapted to the specific needs of the client. The charity Media Standards Trust offers a service called Churnalism, where the user can check whether a press release was used by any of the major newspapers.
In the following sections, we will explain clicking, sharing, commenting, and copying in more detail.
Click rates are well understood. If you have 30 different articles on a topic such as the World Economic Forum from one single news site, click rates would provide clear insights into the effectiveness of each of those articles. But none of the sources would allow the public to know their traffic numbers per article. Those “true” number of visitors per article are kept internal. Some news or blogs might use the clicking number to offer a “what is hot” section on the website. Other, more tech savvy news outlets would decide how many days an article should be visible on the main page by using a mathematical formula using click rates or the decline of click rates. For example, if the decline of click rates day to day is higher than usual, the article should be removed. Certainly, most publishers use the click rates as a tool for internal employee motivation. The BBC, for example, has an automatic wall board in its editorial office displaying the most successful articles.
In general, those click-stream numbers are not public since it is rather interesting competitive intelligence information. It’s no surprise that there are services that try to estimate those figures. Companies like alexa, compete, and comscore use predefined users or panels. Technically speaking, those services install a small client on the browser of its panelists. This client notes every move the panelist does online: where he clicks, how long the window stays open, and so on. This system is fairly accurate if you look at the main websites, though it breaks down for most news sites. To drill down to individual sites, the best way is to use shortlink services. Shortlinks are often used by social networks such as Twitter to reduce the space used. Shortlinks can easily measure how often a specific link is clicked, and providers such as bit.ly offer this number through an API. Those measurements are now way more granular than a panel is, but they might not be statistically relevant.
Sharing has become as easy as clicking. In the early days of Web 2.0, to share would mean to actually write a blog post or a tweet about what you have read. Today, it can be as easy as clicking the “like” button on Facebook or curating via the various bookmark or curation services.
In Table 3-1, Fisheye Analytics calculated sharing only as the number of times people tweeted, digged, reddit, or liked the article on Facebook. Depending on your audience, you can include other sharing mechanisms, including social networks like LinkedIn or Mixi, or via other curation and bookmarking services.
Sharing is an effective way of measuring the distribution of a message, but more and more automated sharing services like IFTTT.com have entered the picture. Those companies allow an automated, robot-like process to happen. For example, using such an automated service, you can easily create a rule to find all articles online that talk about cats and share each article on Twitter via a shortlink. If another person now looks at the “sharing” metric, she would find a nice spike in the way articles about cats are shared. Her conclusion might be that people are more likely to share articles about cats than articles about other topics. In this fictional case, it’s not true, but rather due to the use of an automated tool. This can be done easily, as shown in this video of Lutz Finger. However, he has chosen German news instead of cats.
While sharing and clicking can be done through a simple click, “commenting” requires writing text, no matter how brief or lengthy. Thus, by definition, commenting will not be as widely used but will be more insightful. Be aware that so-called “comment bots” exist, particularly in unmoderated blogs; however, if a real reader goes through the “hassle” of writing a comment, she will have thought about the message.
Despite this advantage, comments, as a measurement, should also be used very carefully. You should not compare the number of comments across different sources, as each source has its own process of allowing people to comment. If users need to first register before they can comment, the number of comments will be fewer compared to a site that makes it simpler. And sometimes you cannot even compare comment numbers across a single media source. For example, the BBC allows comments on some articles, but not on all. As a news source financed by the public, it has to read and approve each comment before it lets it go live. As this process is cumbersome and time consuming, the BBC often artificially restricts comments on articles.
The last of those four engagement metrics is the hardest one to measure. The copying metric is intended to measure the spread of an idea. This can be best measured by how often people “copy” certain wordings. The more content is copied, the more influential the person who initially spread the idea. Take the headline of “Squatter, 59, holed up in No 10,” attributed to Gordon Brown, the British prime minister, after his failed reelection bid in 2010.
This phrase was received so well by the general public that it was copied/quoted in more than 700 other articles within a few days.
This kind of copy analytics will be highly valuable for analyzing press releases. No journalist will link directly to a press release. Instead he will pick up certain ideas and use certain text. This kind of copy behavior can be analysed: the PR Sensor has analysed one month’s worth of PR in the Arabic market to see how well the articles are spreading. The results are displayed in Table 3-2. The table not only contains how often parts of the press release were copied but also the summed-up spread of all those articles together.
Richard Gutjahr used those kinds of copy metrics to create LobbyPlag,[72] a service that analyzes how often law texts from the European Union contain parts of lobbyist papers.
Table 3-2. Headlines spreading the most (courtesy of Fisheye Analytics)
| Release | Date of release | Total coverage (articles) | Total social impact |
|---|---|---|---|
| [+] JVC First to Offer Full HD 3D Consumer Camcorder | 03/06/2011 | 28 | 1,273 |
| [+] Qatar Airways Announces Move into Canada | 02/26/2011 | 33 | 127 |
| [+] Kraft Foods Declares Regular Quarterly Dividend of $0.29 Per Share | 02/24/2011 | 36 | 187 |
| [+] HP Unveils Business Notebooks Designed with Precision Engineering | 02/22/2011 | 31 | 3,490 |
| [+] Etihad and Linfox Armaguard Announce Joint Venture | 02/21/2011 | 36 | 40 |
| Universal Studios Hollywood’s “King Kong 360 3D” Awarded “Outstanding Visual Effects in a Special Venue Project” by the Visual Effects Society (VES) | 02/17/2011 | 99 | 108 |
| Porsche Reaches One Million Fans on Facebook | 02/13/2011 | 27 | 306 |
| [+] BLIZZCON® 2011 ANNOUNCED | 02/06/2011 | 47 | 1,950 |
Caution
Engagement seems like an ideal tool to measure the importance of news. However, as we will see in Chapter 6, the more impact a system has, the more likely it is to be “influenced” by others. Skewing the metric might be done by clear fraudulent actions such as social media robots or it might just trigger an action to split the news article into four or five pages to create more clicks and thus show more “engagement.”
Note
In order to see whether text has been copied by others, the original text is cut into parts, and the analysis determines whether any other article has used the same text pieces.
As with any measurement, there is a caveat. Certain content just gets copied more easily. For example, a financial headline like “RadioShack’s Q1 Profit Plunges 30%” or political, satirical comments like the one about Gordon Brown are more likely to be copied than a scientific finding. In order to compare copy metrics, you need to make sure that the same genres are compared.
As we said in the beginning to this section, measurement of distribution is not only a question of how to measure the distribution with clicks, shares, and more. It is also a question of what we’ve invested—what the effort was. Take an article in one of the top newspapers. If you keep the article on the home page of the newspaper’s website for a week instead of a day you will surely create more engagement and clicks. Your investement or cost in this case is that you cannot have any other story placed on the home page. The same exmple works with social media accounts. As a publisher you can repeatedly tweet about the article. It will help you create more additional shares. There is also a cost: your followers might start to get tired of the same message and start to disregard what you write. Thus measuring success is measuring the relationship between effort and effect.This is hard but not impossible. You’ll need to keep all variables, such as “days on the homepage” or “number of times mentioned on social media” equal. Then you can compare the efforts and only then the discussed metrics will be comparable as well. One great attempt to vizualize this relationship is the New York Times website, which was done by OpenNews Fellow Brian Abelson.
Let’s take an in-depth look at how efficiently the World Economic Forum uses public data. They use focused reading lists based on an automated clipping process. On top of this process, Fon Mathuros, senior director of media relations for the World Economic Forum, and her team have created a dedicated system to mine aggregated insights. With this system, the Forum became best in class in listening to the pulse of the time and capturing new trends first.
For example, it conducts a highly successful conference every year in India called the “Indian Economic Summit.” This conference is a platform for political and economical leaders to discuss the challenges of the region and to advise on steps going forward. For the conference in November 2009, Fon and her media team selected several topics that were discussed in planetary sessions or in small workshops. After the event, the team was charged with finding out which of those topics spread the most within the public. Figure 3-7 shows that of the chosen topics, the following three had the biggest media resonance:
Will India be a superpower?
Green growth
The girl effect
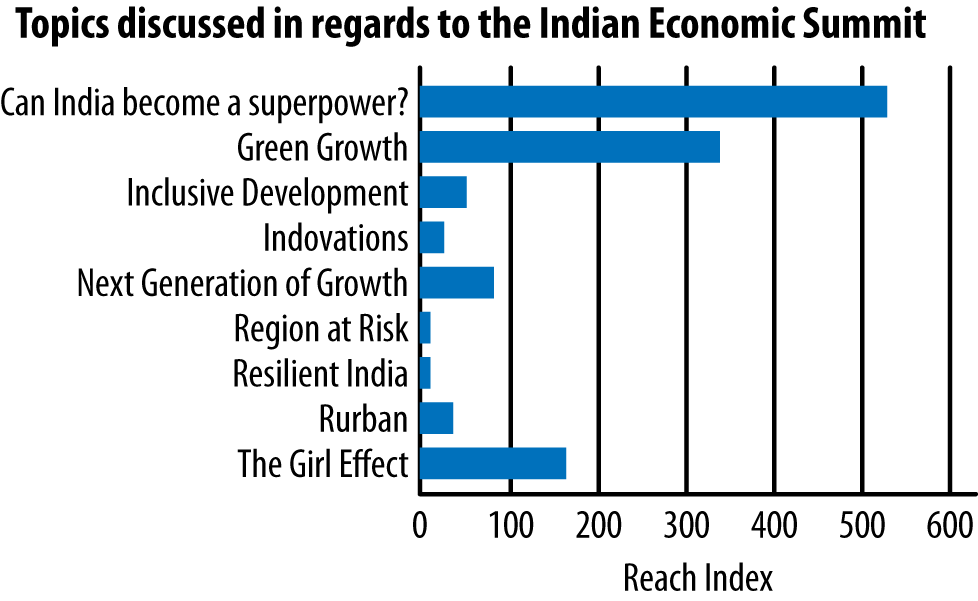
This is a worldwide view that encompasses all media types, including Twitter, blogs, Facebook, and traditional news. If you were interested in what had resonated most within the Indian press, you would need to select only that part of the data and compare it by country, as displayed in Figure 3-8.
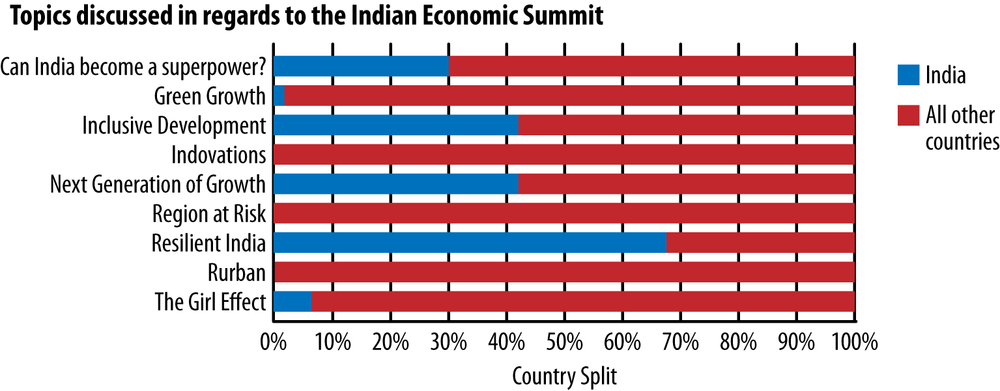
Figure 3-8. The topic “resilient India” resonated best in India (courtesy of World Economic Forum and Fisheye Analytics)
The discussions on sustainable growth for India summarized under the topic “resilient India” got the most interest within the Indian media, while discussions on “risk” or on environmentally friendly growth (“green growth”) garnered more interest from the rest of the world.
The World Economic Forum decided to continue to use the topic “resilient India” in the following years because it realized that there was strong interest in it by their local partners.
As James E. Gruning stated at the beginning of this chapter, PR is tasked with both distributing and monitoring. Monitoring is to catch any reputation issues that may arise. The onset of social media has made this even more essential, since social media not only enables easy spreading of marketing messages, but also easy spreading of negative messages which could potentially damage a brand image. There are many tools in the market that praise themselves to marketeers as the best insurance against such PR issues. We have seen many of those, and we even tried to develop our own. Our conclusion has been that none of those tools work sufficiently well enough to rely on them. In the following sections we will show you why.
In the beginning of social media communication, it was often not a bad product or a bad customer-care experience that created PR issues, but the company itself. Marketeers debuted in the space of earned media for promoting their products and found a kind of “quicksand” that could turn against them at any wrong step. In addition, others have been able to use social media as a PR weapon against businesses and individuals.
Discussions on social media are full of stories where communications went wrong. These can be categorized into four main areas:
Inappropriate selling
Underestimated virality
Self-censorship
Impersonation
An example of inappropriate selling is a tweet by clothing manufacturer Kenneth Cole, who promoted his products by piggybacking on the Arab Spring:
Millions are in uproar in #Cairo. Rumour is they heard our new spring collection is now available online at…
This kind of tasteless selling behavior created a significant negative backlash with consumers.[73] Only 12 months later, fast-food company KFC went through a similar example. Following earthquake and tsunami warnings, KFC Thailand recommended to its followers:
People should hurry home this evening to monitor the earthquake situation and don’t forget to order the KFC menu, which will be delivered direct to your hands.
—KFC
Once again, it did not take long before angry customers called in.
Another common issue that has often taken marketeers by surprise is the potential virality of many campaigns. This was unknown territory, as email campaigns (which were one of the main tools used prior to social media campaigns), rarely go strongly viral.
Our pick for this category is the offering of a free meal by KFC. To make its promotion heard, the company teamed up with Oprah and showed it to her roughly 6 million viewers. The response was so overwhelming that KFC ran out of chicken and had to leave customers unserviced. In the aftermath, the CEO of KFC apologized to outraged Twitter users and bloggers via a YouTube message and offered 6.1 million people a rain check.
Another category is self-censorship. The openess of social media has reduced the control by PR. To control or limit information about the company used to be one of the major tasks of PR professionals. When PR professionals try to do that within social media, it is perceived as censorship and often creates negative reactions by the public.
The most common mistake in this category is when PR teams have deleted comments that were seen as too negative for the company image. This has even happened to professional PR firms like Burson Marstella, which was accused of deleting posts on its Facebook page that criticized a smear campaign it had launched against Google on behalf of Facebook.[74]
Finally, activists sometimes use fake social media accounts to embarrass targets such as corporations or politicians. These accounts often purport to be from the targets themselves and send messages designed to put them in a bad light. For example, in a recent US presidential election, a fake Twitter account supposedly representing a conservative politician posted racist tweets directed at African-American President Barack Obama. Meanwhile, the actual politician had shown no evidence of being racist.
A more sophisticated example of this was an elaborate hoax directed at the energy firm Shell by the environmental group Greenpeace[75] and the activist group the Yes Men, to protest Shell’s oil exploration in Alaska. This included a fake website (www.arcticready.com) that at first glance appears to be an official Shell website, with tongue-in-cheek content such as a picture of an oil tanker with the caption, “Let’s hit the beach!” as well as a Twitter account @ShellIsPrepared that portrayed Shell as a company that ruins nature for a “better” tomorrow.
To make the hoax even more convincing, ShellIsPrepared sent tweets under the guise of being a social media response team, asking people to stop spreading embarrassing fake advertising images that were intentionally created by the pranksters:
@ShellIsPrepared: Our team is working overtime to remove inappropriate ads. Please stop sharing them.
As of this writing Shell has not chosen to sue these activists, possibly so as not to draw further attention to their activities, and the website and Twitter account still remain active. Examples like these show how social media PR tools have become a weapon of protest for many social and political causes. Other examples of fraud and fakery in social media will be discussed in detail in Chapter 6.
All of those stories have one thing in common; once they turn viral, they happen very fast, and often too fast for corporate PR to fix. As said in the intro to this chapter, there are no real tools to protect companies from this kind of virality. The reason is twofold:
We saw earlier that not everyone or every message is equal in a network. Only if the information fits the “tastes of its readers” and only if it hits the right gatekeepers or connectors within the network will it start spreading.
To hit the right connectors within the network might take a long time, and there is no good way of estimating it. We don’t know how long it took until the news will break. It took up to six months in the case of the trending double rainbow on YouTube by hungrybear9562. Uploaded in January, it wasn’t until summer that it hit someone who could reach a larger audience. In this case, the gatekeeper was Jimmy Kimmel, who tweeted about it and made people talk about it.
However, no matter how long it takes for something to be found by a gatekeeper, or what Kevin Alloca calls a “tastemaker,” once something starts to spread, it is usually a process that happens in hours rather than in days. Fisheye Analytics analyzed that roughly 50% to 60% of all articles in the UK get shared within four to six hours. Or said differently: after four to six hours, most of the articles are old news and most readers will not consider sharing them further.[77] As you can see in Figure 3-9, technology and financial news have a very short shelf life during which they get retweeted or shared in any other way, whereas religious and beliefs topics have longer engagement cycles.
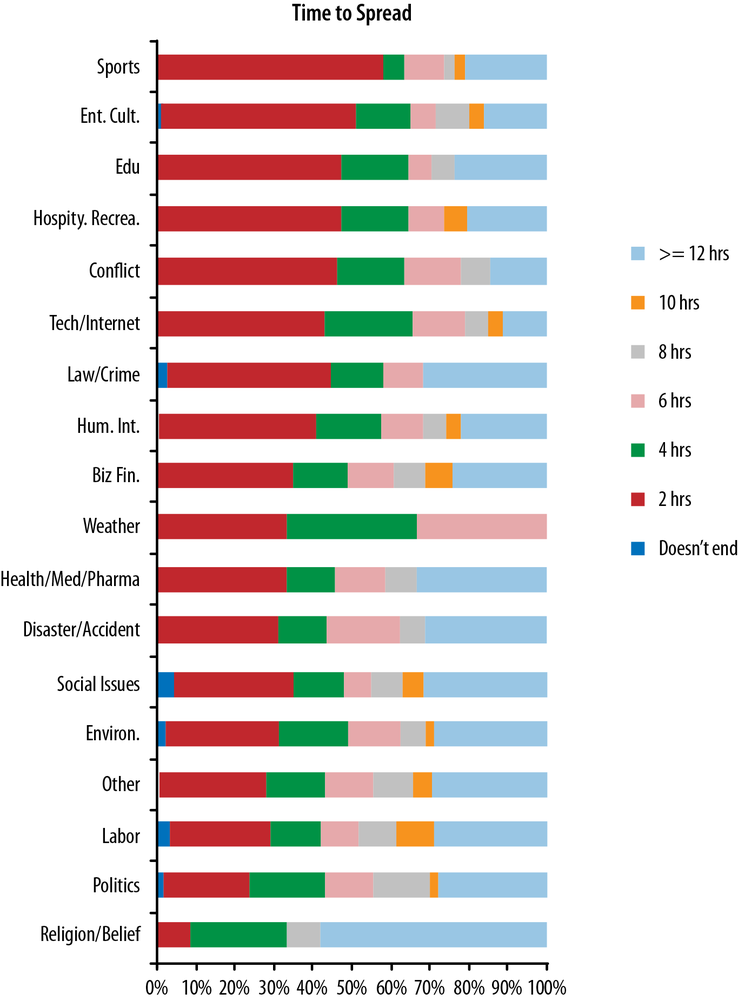
Figure 3-9. The amount of time it takes for clicking, sharing, and commenting to slow down (courtesy of Fisheye Analytics)
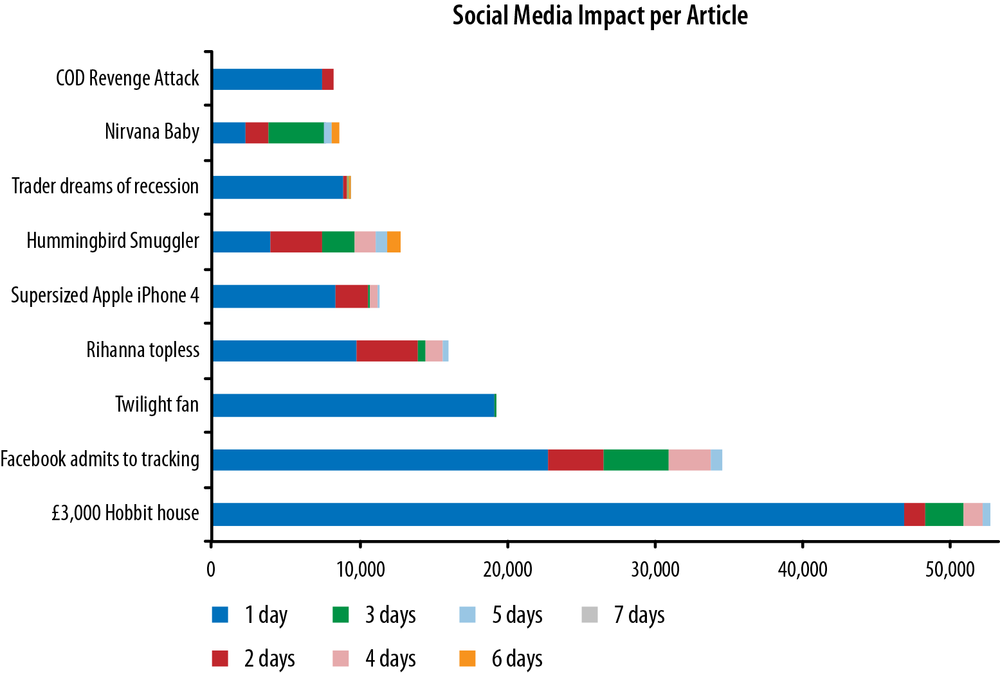
On an article level, this might sometimes be a slightly longer period. As you can see in Figure 3-10, 9 out of 10 articles reached their maximum engagement level within the first day.
Such a high rate of escalation creates technical and organizational challenges for any organization:
- Technical requirements
Any software checking the spread of a message would need to do this at a high speed, for example, every 10 minutes (or 144 times a day), to spot any signs of spreading. Within online news we see more than 1 million articles being posted every day. To see whether each article was spreading in Facebook would therefore require 144 million checks. If we add other channels such as Twitter and YouTube, we would need to add 144 million checks for each social media channel. Additionally, we would need to continue to check those 144 × 3 checks for the next 180 days, since we know that it can take six months or longer before the message turns viral. So for our system to warn us when things were going viral, we would need to check seven trillion times a day. If we assume that not only news content but YouTube, Facebook posts, and blog posts can go viral, too, the number of checks increases by a magnitude of 10. In short: it is so far not technically feasible to warn from the outside. The companies offering social networks such as Facebook and LinkedIn could build measurements from the inside to test whether a message is about to go viral. However, at the time of writing, those services are not yet offered.
- Organizational issues
Even if you had such a measurement system, given a two-hour response window, can the organization be ready to react appropriately to any communication misbehavior? Traditional PR so far has not been set up to react in “near” time.
Even when it is technically difficult, it is sometimes possible to react in near time. In such cases, people often wonder afterward why it was not done earlier.
The August 2011 riots in London, triggered by the fatal shooting of a black male at the hands of police, were an example of both the power and challenges of using social media in a crisis. On one hand, rioters used tools such as BlackBerry messenger and Twitter to organize their activities, and it is hard to proactively anticipate such quickly arranged mob actions. On the other hand, police did employ social media after incidents to investigate crimes and identify looters. They also used records from mobile phone providers. Moreover, social media also played a role in organizing cleanup efforts following the end of the riots.
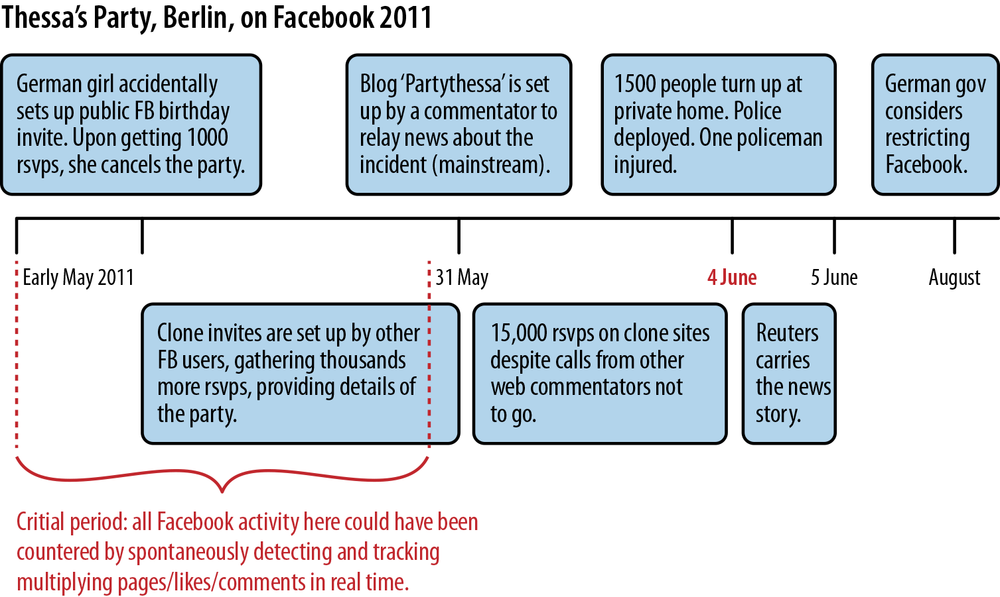
Another example of an unplanned social media “flash mob” took place in Germany, when a teenage girl neglected to make invitations to a birthday party private on Facebook and over 1,500 people showed up. Despite canceling the party after getting more than 1,000 RSVPs, people cloning copies of the invitation ultimately led to over 15,000 RSVPs, and police and private security were needed to maintain order. As Figure 3-11 from Fisheye Analytics shows, there was a critical point in time after the initial announcement where one might have intervened to stop the viral spread of this invitation.
Note
PR disasters might happen quickly and spread within a few hours. For any service to be helpful, the system needs to go back to the message often and check virality in terms of retweets, likes, views, or whatever is appropriate for the media type. There will never be a fully automated tool; a team of social media managers should be ready to flag abnormal behavior, investigate, make a decision, and react. Consequently, there are two questions to ask the potential service supplier who promises you an early warning system:
How often do you check for updates on the spread of the item? Anything that is below 30 minutes can be seen as excellent.
How long do you follow a given article around? As seen with the double rainbow, it took six months for that video to get viral. However, anything above two months is excellent.
Despite not having an early warning system, more and more companies are starting to have a system in place to react once an issue has appeared. McDonald’s, for example, has created such a system. It built a social media “war room” that may not spot issues before they break out, but can react quickly.
A hoax began with a picture of a piece of paper that was put on the front door of a McDonald’s. It read:
Please note: As an insurance measure due in part to a recent string of robberies, African-American customers are now required to pay an additional fee of $1.50 per transaction. Thank you for your cooperation.
It was first posted on a Thursday via a website called McServed.
It took a few days for the picture to go viral and to start spreading under the hashtag #SeriouslyMcDonalds. By Saturday the issue had caught the attention of the McDonald’s social media team. It responded with a post, but afterward kept silent so as not to fire up the issue even more.
That pic is a senseless & ignorant hoax McD’s values ALL our customers. Diversity runs deep in our culture on both sides of the counter.
—McDonald’s Social Media team
As the discussion became a trending topic at twitter, McDonald’s took big measures and asked key gatekeepers in Twitter to “please let your followers know.” Additionally the company responded to concerned tweeps, and by Sunday hardly anyone believed the image to be true.
There is a lot to be learned from this case, as McDonald’s had three things in place that helped it:
It had an effective measurement system for messages as described in Measuring Distributing. It could not only evaluate the spread of the overall issue but benchmark the issue as well, to decide whether to react or not.
It had an effective measurement system to identify gatekeepers as we have described in Measuring People. It reached out to them for help in this state of crisis.
It had an organization and processes in place that were able to react quickly, even over the weekend.
While no early foolproof warning system measuring the change in engagement is possible, it is possible to identify certain indications of the potential for an outbreak of a situation.
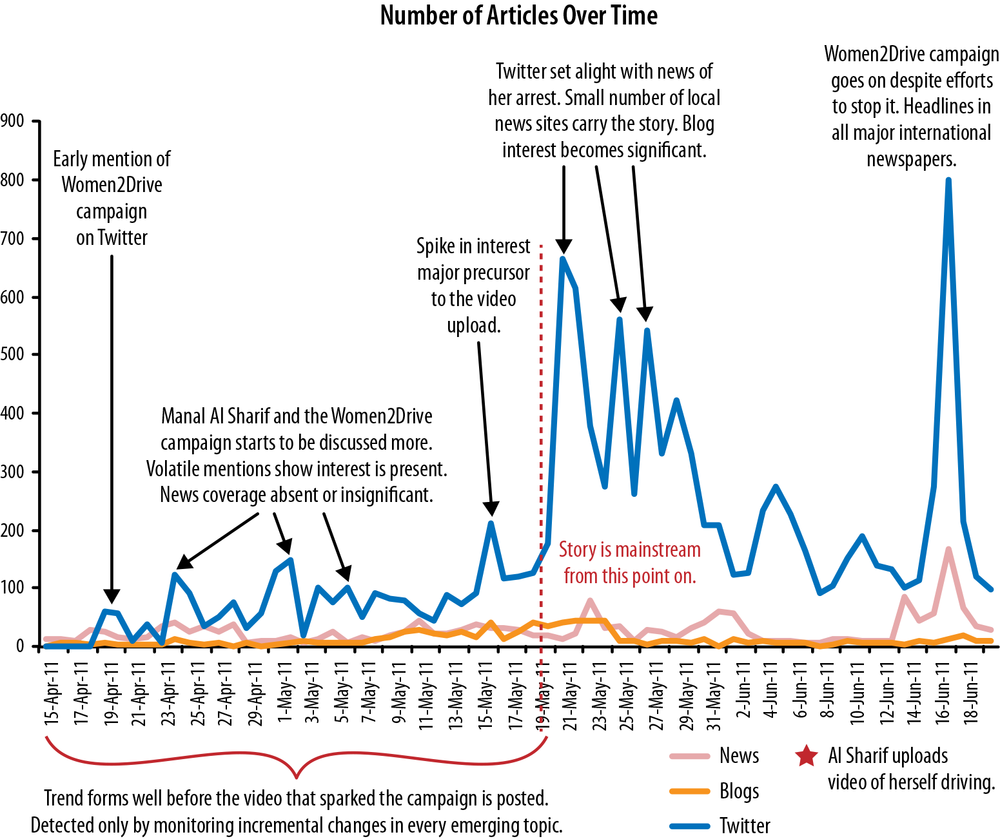
Manal al-Sharif is a young mother and computer scientist in Saudi Arabia. Women in Saudi Arabia are not allowed to drive, so she, along with other activists, started the Women2Drive campaign. As one can see in Figure 3-12, the Women2Drive Twitter campaign started to gain attention. The tipping point was reached when she published a video on the Internet of herself driving. Her subsequent arrest was greeted by a community of people who already had connected around this issue. The community protested against her arrest and called in even bigger international help. Manal al-Sharif was set free after a short while.
The measurement before the YouTube video was released indicates a tendency. There was a community which had connected around the Women2Drive issue. To measure the strength of the community, we will revert back to the same metrics we have discussed in this chapter: context, reach, and spread.
Knowing that Manal al-Sharif had already formed a community and knowing that she had already created some awareness for the topic, she decided that she could go the next step to protest by officially recording her driving on YouTube. The reaction of the government and the subsequent protests from the outside world made the community of protestors even stronger. Manal al-Sharif reached a new level of influence on this topic.
Social Media has created a new way to communicate. It is no surprise that it has therefore changed the department that is concerned mainly with communication. Social media has changed the way we do PR.[78] PR was always a discipline that was hard to quantify and measure. There was the hope that this would change with more data. However, as we mentioned in our initial chapters, more data does not necessarily means easier access to the fourth “V” of data. PR and its quest for insights is the best example. With the many new ways to communicate, many new metrics came. But many of those were descriptive in nature, and they did not reveal the fourth “V” or a ROI. They also do not really help predict anything. But they are very helpful as operational metrics to control the two main transactional tasks of PR: to distribute and to monitor. In this chapter, we discussed the usage of metrics such as:
- Reach
It used to be calculated easily within traditional media. Social media has created new reach metrics. There is no standard, and it is almost impossible to compare those metrics accross different media types.
- Context
It was always key for any communication. Theoretically, we could store all data to create correlations and learn from past experience. However, so far, context is only used in a descriptive fashion or as a benchmark.
- Activity
Despite wide utilization of activity metrics, we believe that the number of articles is a measure that is not helpful for judging the overall success of PR, except when using reading lists.
- Engagement
Better than counting the number of articles are various engagement metrics that measure the spread of each individual article.
- Audience
It is as key as context, but similar to context, it is used only in a descriptive fashion. We saw in Chapter 2 that this does not need to be this way.
The second biggest task of PR is to warn if anything unwanted is happening. Search tools of all kinds surfaced to enable PR departments all over the world. This would be the perfect case for predictive analytics. If we could know when something is happening before it happens, we would have uncovered the fourth “V,” the value of the data. Unfortunately, we have shown that it is technically not easy to have such an early warning system. The lessons from Chapter 8 are true: the more focused the question, the easier it will be to find articles that start spreading fast.
PR has no easy way of measuring an ROI. The impact of its actions are longterm and thus causation (for more insights on causation jump to Part II Chapter 9) is not given. This has been an issue for many PR professionals. Which of the metrics discussed in this chapter could be used for your PR department?
Context and audience are areas where one could use unstructured data to support PR activities. A focused question or reading list here is key to success. What kind or reading list would you design for your business? Who is your target audience, and which metrics describe them best?
Every PR professional takes interest in disaster stories and stories about well-organized teams who have reacted to disasters. Please share with us and the world your favorite disaster on Twitter, @askmeasurelearn, or on our LinkedIn or Facebook page.
[59] Marketing Survey done Dec 2011 by ifbyphone (http://bit.ly/18G0EYQ).
[60] Samantha Murphy, “Twitter Breaks News of Whitney Houston Death 27 Minutes Before Press,” Mashable, Feb 12, http://on.mash.to/18G245u.
[61] Gilad Lotan, “PDF12 Keynote: Networked Power (what we learn from data),” Social Flow Blog, June 2012, http://bit.ly/1cqqPAB.
[62] Gilad Lotan, “Timing, Network and Topicality: A Revealing Look at How Whitney Houston Death News Spread on Twitter,” Gilad Blog, http://bit.ly/1bZfyfI.
[63] Gilad Lotan, “Timing, Network and Topicality: A Revealing Look at How Whitney Houston Death News Spread on Twitter,” Gilad Blog, http://bit.ly/1bZfyfI.
[64] Linton C. Freeman, “A set of measures of centrality based on Betweeness,” Sociometry, 1977, http://bit.ly/JiZU2H.
[65] Joseph E. Phelps et al. ,“Viral Marketing or Electronic Word-of-Mouth Advertising: Examining Consumer Responses and Motivations to Pass Along Email,” Journal of Advertising Research, Dec. 2004, http://bit.ly/1gsMX4d.
[66] Eytan Bakshy, “Everyone’s an Influencer: Quantifying Influence on Twitter,” WSDM, Feb. 2011, http://bit.ly/IRN1eY.
[68] Sophos, “Facebook ID probe shows 41% of users happy to reveal all to potential identity thieves,” Aug 2007, http://bit.ly/1kDuT4V.
[69] Darlene Storm, “EFF warns Big Brother wants to be your friend,” Computerworld, Oct. 2010, http://bit.ly/JjdzXz.
[70] IFRRO, “UK Court of Appeal ruling in NLA v Meltwater case,” Jul 2011, http://bit.ly/1hPkc1Z.
[73] Ken Sweet,“Kenneth Cole Egypt tweets ignite firestorm,” CNN Money, Feb 2003, http://cnnmon.ie/1bId2IT.
[74] Sam Gustin, “Burson-Marsteller Deletes Critical Facebook Posts, Spares Google-Smear Flacks,” wired, May 2011, http://wrd.cm/19F34Uz.
[75] Kashmir Hill, “Shell Oil’s social media nightmare continues, thanks to skilled pranksters behind @ShellisPrepared,” Forbes, July 2012. http://onforb.es/19kxdw3.
[76] Mark Granovetter, “The Strength of Weak Ties,” American Journal of Sociology, 1973.
[77] The time measured is until 80% of all sharing activity has occurred.
[78] If you are part of a pure B2B organization, you probably had little exposure to social media communication overall. However, even in those organizations, the biggest impact of social media is within the PR departments.