
p.1
What Is Sound? Seven Important Characteristics
In This Chapter:
Learning the craft of audio engineering is like learning a foreign language. A new language may be intimidating and difficult at first, but, with time and dedication, a vocabulary is built. Soon words turn into phrases and phrases turn into full sentences. This chapter will cover details of a sound wave and explore some of the language of audio. You will be fluent in no time!
WHAT IS SOUND?
Sound is a vibration or a series of vibrations that move through the air. Anything that creates the vibrations, or waves, is referred to as the source. The source can be a string, a bell, a voice, or anything that generates a vibration within our hearing range.
Imagine dropping a stone into water. The stone (source) will create a series of ripples in the water. The ripples (waves) are created by areas of dense molecules that are being pushed together, while areas with fewer expanding molecules create the flatter sections. Sound travels in a similar way to this, by compression and rarefaction. Compression is the area where dense molecules are pushed together and rarefaction is the area where fewer molecules are pulled apart, or expanded, in the wave. The compression area is higher in pressure and the rarefaction area is lower in pressure.
p.2
This chapter deals with the seven characteristics of a sound wave: amplitude, frequency, phase, velocity, wavelength, harmonics, and envelope. You will also be introduced to the various types of waveforms, analog and digital audio, and lossy/lossless formats.
Although a typical sound is more complex than a simple sine wave, the sine wave is often used to illustrate a sound wave and its seven characteristics.
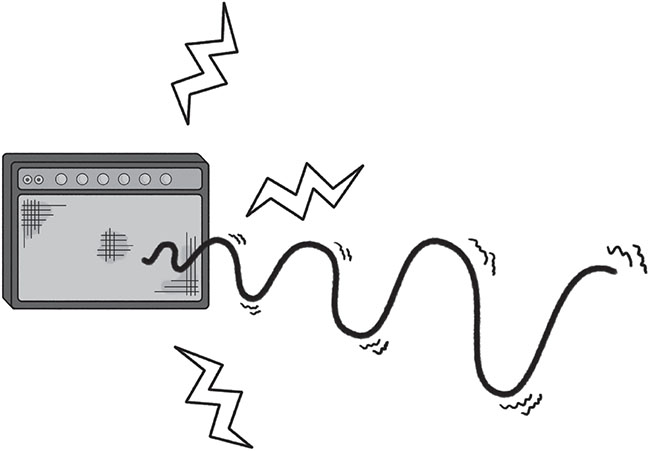
FIGURE 1.1
SEVEN CHARACTERISTICS OF SOUND
You may already know about two characteristics of sound: amplitude and frequency. If you have ever adjusted the tone on your amp or stereo, then you have turned the “amplitude” of a “frequency” or range of frequencies up or down. It is necessary to understand these two important sound wave characteristics, as they are essential building blocks in audio engineering. Two other characteristics of sound help humans identify one sound from another: harmonics and envelope. The remaining three characteristics of sound are velocity, wavelength, and phase. These characteristics identify how fast a sound wave travels, the physical length of a completed cycle, and the phase of the sound wave.
Amplitude
Amplitude is associated with the height of a sound wave and is related to volume.
When a stereo, amp, or television’s volume is turned up or down, the amplitude of the sound being projected is increased or decreased. Loud sounds have higher amplitudes while quiet sounds have lower amplitudes. The greater the amplitude of a sound the greater the sound pressure level (SPL).
p.3
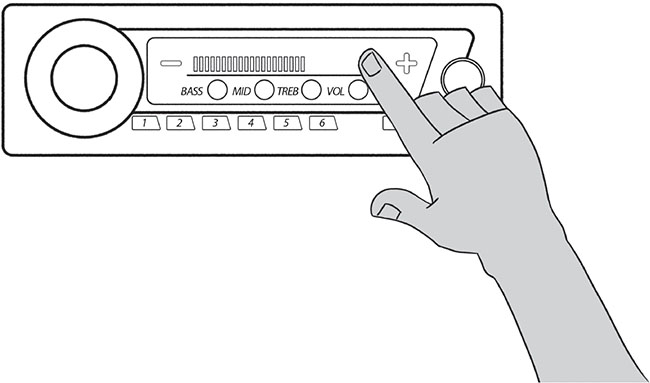
FIGURE 1.2
Amplitude is measured in decibels (dB). Most people can recognize about a 3 dB change in amplitude. A trained ear can recognize even smaller amplitude changes. An increase in amplitude is usually expressed as a “boost” and a decrease in amplitude is often expressed as a “cut.” The word “volume” is often substituted for amplitude. An audio engineer may say, “boost that 3 dB” or “cut that 3 dB.” When amplitude is written out, it is expressed with a positive sign such as +3 dB or a negative sign such as −3 dB.
Here are some common activities and their corresponding decibel levels:
0 dB – near silence
40–50 dB – room ambience
50–60 dB – whisper
60–75 dB – typical conversation
80–85 dB – a blender, optimum level to monitor sound according to the Fletcher–Munson curve
90 dB – factory noise; regular exposure can cause hearing damage
100 dB – baby crying
110 dB – leaf blower, car horn
120 dB – threshold of pain; can cause hearing damage
140 dB – snare drum played hard from about one foot
150–160 dB – jet engine
p.4
As you can see, in our daily lives, we are typically exposed to amplitude levels between about 50 dB and 110 dB. Most people listen to music between 70 dB (on the quiet side) and 100 dB (on the loud side). To learn even more about dBs check out Appendix A.
Frequency
The amount of cycles per second (cps) created by a sound wave is commonly referred to as the frequency. If you are a musician, you may have tuned your instrument to A/440. Here, “440” is the frequency of a sound wave. It is related to pitch. Unlike amplitude, which is measured in decibels, frequency is measured in hertz (Hz), named after the German physicist, Heinrich Hertz. The average human hearing range is from 20 to 20,000 Hz. Typically, once 1000 cycles per second is reached, the frequency is referred in kilohertz (kHz), i.e., 1000 Hz = 1 kHz, 2000 Hz = 2 kHz, and 3000 Hz = 3 kHz. Frequency is related to the pitch of a sound. Figure 1.4 is a handy chart to help identify the frequency ranges of various instruments and how the keys of a piano relate to frequency. The first note on a piano is A, which is 27.5 Hz. Have you ever turned up the bass or treble on your car stereo? If so, you are boosting or cutting the amplitude of a frequency or range of frequencies. This is known as equalization (EQ), a vital aspect of audio production.
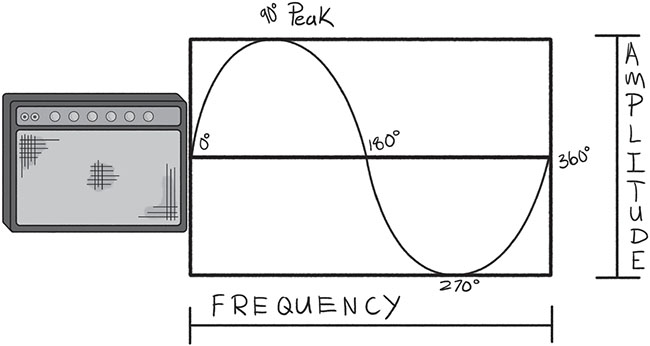
FIGURE 1.3
Each frequency range has distinct characteristics, and some common terms can help you to identify them. I will go into further detail throughout the book, but let’s start here:
p.5
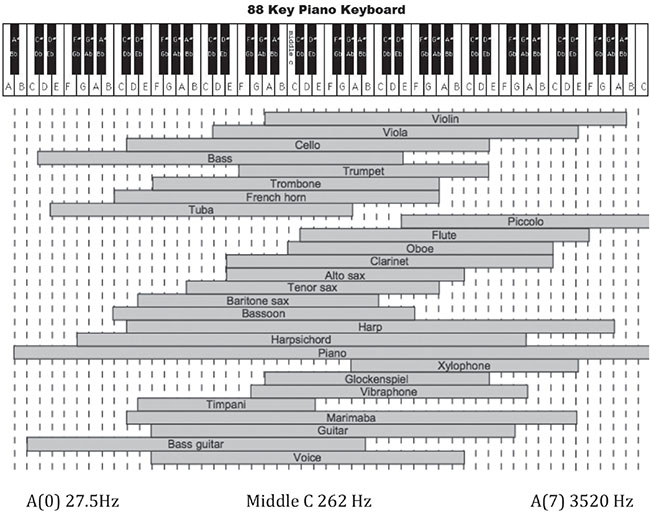
FIGURE 1.4
Frequency is often divided into three ranges:
![]() AUDIO CLIP 1.1
AUDIO CLIP 1.1

Low or bass frequencies are generally between 20 and 200 Hz. These frequencies are omnidirectional, provide power, make things sound bigger, and can be destructive if too much is present in a mix. Note that frequencies under 30 Hz produce more of a “feeling” than a sense of sound.
Mid, or midrange, frequencies are generally between 200 Hz and 5 kHz. This is the range within which we hear the best. These frequencies are more directional than bass frequencies and can make a sound appear “in your face,” or add attack and edge. Less midrange can sound mellow, dark, or distant. Too much exposure can cause ear fatigue.
High or treble frequencies are generally between 5 and 20 kHz and are extremely directional. Boosting in this range makes sounds airy, bright, shiny, or thinner. This range contains the weakest energy of all the frequency ranges. High frequencies can add presence to a sound without the added ear fatigue. A lack of high frequencies will result in a darker, more distant, and possibly muddy mix or sound.
p.6
Midrange is the most heavily represented frequency range in music. It is often broken down into three additional areas:
Low-mids, from around 200 to 700 Hz: darker, hollow tones
Mid-mids, from 700 to 2 kHz: more aggressive “live” tones
High-mids or upper-mids, from 2 to 5 kHz: brighter, present tones
This chart in Figure 1.5 may come in handy when you are learning how to describe a particular sound or when you are mixing. These are general areas and are covered in detail in Chapter 3.
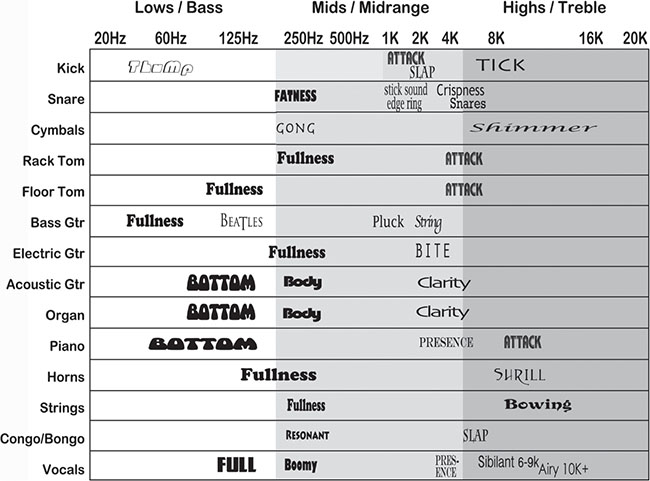
FIGURE 1.5
Phase
Phase designates a point in a sound wave’s cycle and is also related to frequency (see Figure 1.3). It is measured in degrees and is used to measure the time relationship between two or more sine waves.
As you can see from Figure 1.6, when two sound waves are in phase, the result is increased amplitude. When they are 180 degrees out of phase, they can completely cancel each other out, resulting in little or no sound. This concept is used in many modern devices, such as noise-cancelling headphones or expensive car mufflers, to eliminate the outside sound or engine noise. However, sound is not always completely in or out of phase. Sounds can be out of phase by any number of degrees, ranging from 1 to 359. Phase issues can make some frequencies louder and others quieter. Often a room’s acoustics create these areas of cuts and boosts in the frequency spectrum. These cancellations and amplitude increases influence the way a room is going to sound. Standing waves and comb filtering are often the result of these phase interferences. Phase is also very important to keep in mind when stereo miking and when using multiple mics on an intended source. When listening in a typical stereo environment, a sound may be completely out of phase and go unnoticed unless the phase is checked.
p.7
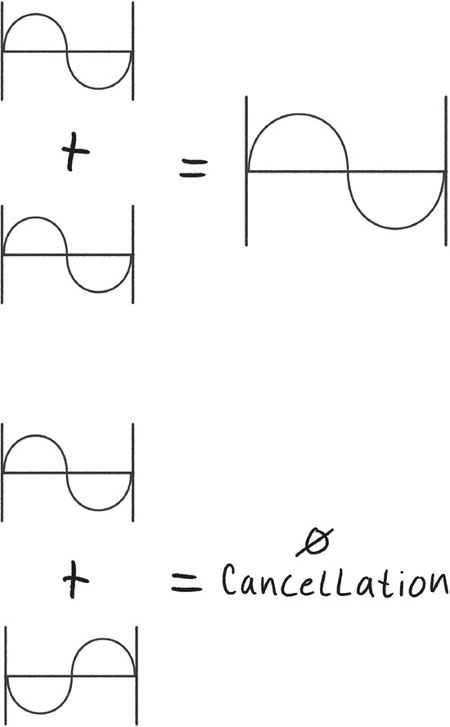
FIGURE 1.6
![]() TIP
TIP
Some tips to check phase:
Mono button
Phase flip (polarity)
Phase meter
p.8
Phase issues can be exposed when a mix or a sound is checked in mono. One of the first records I mixed was a new wave record with thick delays and effects. I was mixing a particular track for a music video. The studio where I was working at that time had a small TV with a mono speaker. I would patch mixes into the TV in order to hear the mixes in mono. This would expose any existing phase issues and instrument imbalances. I patched into that TV after completing what the band and I thought was a pretty good mix, and the vocals and keyboards almost completely disappeared! Imagine if I hadn’t checked the phase in mono. The video would have been aired and there would have been no vocals. I can honestly say after that experience that the mono button became one of my “go to” buttons on the recording console. Many live music venues and dance clubs’ PAs and speaker systems are set up in a mono configuration to get more power. What would happen if one of your out-of-phase mixes were played in a club? It would be less than impressive. Always check your mixes in mono!
![]() VIDEO 1.1 PHASE
VIDEO 1.1 PHASE

Velocity
Velocity is the speed at which sound travels. Sound travels about 1130 feet per second at 68 degrees Fahrenheit (344 m/s at 20°C). The speed at which sound travels is dependent on temperature. For example, sound will travel faster at higher temperatures and slower at lower temperatures, knowing the velocity of sound can come in handy when calculating a standing wave or working with live sound.
Wavelength
Wavelength is the length of the sound wave from one peak to the next. Consider the wavelength to be one compression and rarefaction of a sound wave. In determining the wavelength, use the speed of sound and divide it by the frequency. This will identify the length between these two peaks.
As seen in the figures, the lower the frequency the longer the wavelength. This demonstrates the power and energy that low end creates as a result of a longer wavelength. High frequencies are much smaller in length, resulting in a weaker form of energy that is highly directional.
![]() TIP
TIP
The Rubens’ Tube is a great visual example of compression, rarefaction, frequency, and wavelength. Look up the Rubens’ Tube built by The Naked Scientists on their blog.1
p.9
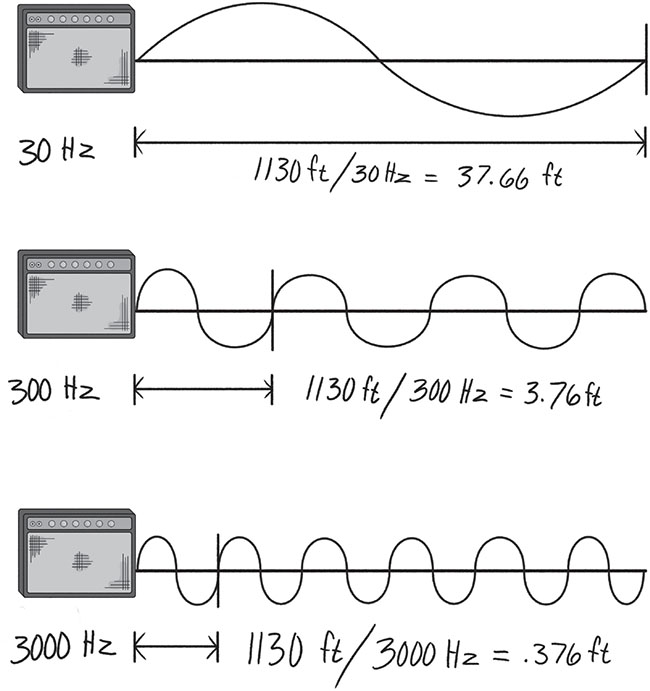
FIGURE 1.7
Unlike other sound wave characteristics previously discussed, harmonics and envelope help humans differentiate between one instrument or sound from the other.
Harmonics
The richness and character of a musical note are often found within the harmonics. Harmonics are commonly referred to as “timbre.” Every instrument has a fundamental frequency, referred to as the fundamental, and harmonics associated with it. On an oscilloscope, the fundamental shows up as a pure sine wave, as seen in the Rubens’ Tube video; however, sound is much more complex. Most sounds contain more information in addition to the fundamental. In music, instruments have their own musical makeup of a fundamental plus additional harmonics unique to that instrument. This is how we can distinguish a bass guitar from a tuba, a French horn from a violin, or any two sounds when the same note at the same volume is played. Instruments that sound smoother, like a flute, have less harmonic information and the fundamental note is more apparent in the sound. Instruments that sound edgier, like a trumpet, tend to have more harmonics in the sound with decreased emphasis on the fundamental.
p.10
If you were to play a low E on the bass guitar, known as E1, the fundamental note would be about 41 Hz. You can figure out the harmonics by simply multiplying the fundamental times two, three, four, etc.
The fundamental note E1 = 41 Hz.
The second harmonic would be 82 Hz (41 × 2).
The third harmonic would be 123 Hz (41 × 3).
The fourth harmonic would be 164 Hz (41 × 4).
It is a common practice among engineers to bring out a sound by boosting the harmonics instead of boosting the fundamental. For instance, if the goal is to hear more bass, boosting 900 Hz may bring out the neck, or fretboard, of the instrument and make the note pop out of the mix. The result is more apparent in bass, without the addition of destructive low end to the instrument.
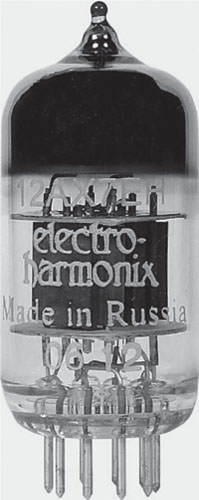
FIGURE 1.8
Additionally, harmonics are divided into evens and odds. Even harmonics are smoother and can make the listener feel comfortable, whereas odd harmonics often make the listener feel edgy. Many engineers and musicians use this knowledge when seeking out microphone preamps, amplifiers, and other musical equipment containing vacuum tubes. These tubes create even distortion harmonics that are pleasing to the ear and odd distortion harmonics that generate more edge and grit.
p.11
![]() TIP
TIP
Taking a music fundamentals class or studying music theory can definitely benefit you as an audio engineer. These classes and concepts can help you develop a well-rounded background and better understanding of music. You can never know too much in this field!
The more you know, the easier time you will have communicating effectively with skilled musicians. If you are able to speak intelligently, they are more likely to be comfortable working with you and putting their trust in you. The more skills you possess the better your chance of success.
Envelope
Like harmonic content, the envelope helps the listener distinguish one instrument or voice from another. The envelope contains four distinct characteristics: attack, decay, sustain, and release.
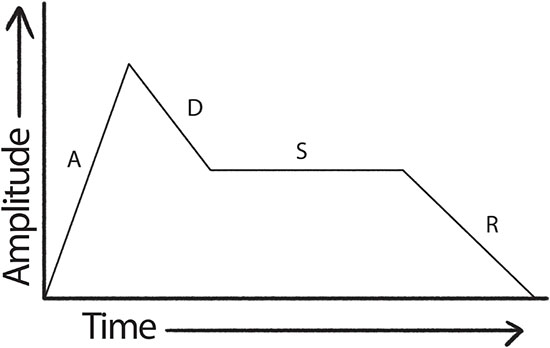
FIGURE 1.9
Attack is the first point of a note or sounds envelope. It is identified as the area that rises from silence to its peak volume.
Decay is the next area of the envelope that goes from the peak to a medium level of decline.
p.12
Sustain identifies the portion of the envelope that is constant in the declining stage.
Release identifies the last point in the envelope where the sound returns back to silence.
A percussive instrument has a very quick attack, reaching the note instantly upon striking. With woodwinds, brass, and reed instruments, no matter how quickly the note is played, it will never reach the note as fast as striking a drum.
OTHER PERIODIC WAVEFORM TYPES
Waveform defines the size and shape of a sound wave. Up to this point, a simple sine wave has been used to illustrate sound. Sound can come in different waveforms, other than a sine wave. Other common waveforms include triangle, square, and sawtooth waves. Each waveform has its own sound and characteristics and each may be used for different applications.
A triangle wave looks like a triangle when viewed on an oscilloscope, a square wave appears as a square, and a sawtooth wave appears as a sawtooth.
A square wave is typically associated with digital audio. A square wave’s sound is often described as hollow and contains the fundamental note plus the odd harmonics. These harmonics gradually decrease in amplitude as we go higher in the frequency range.
A triangle wave is similar to a square wave in that it also contains only the fundamental plus the odd harmonics. It is a kind of a cross between a sine wave and a square wave. One main difference is that the higher frequencies harmonics are even lower in amplitude than those of square waves. This results in a less harsh sound and is often used in synthesis.
A sawtooth wave contains both the even and the odd harmonics of the fundamental. Its sound is harsh and clear. Sawtooth waveforms are best known for their use in synthesizers and are often used for bowed string sounds.
NOISE
Noise is any unwanted sound that is usually non-repeating. Noise is a hum, a hiss, or a variety of extraneous sounds that accompany a sound wave when it is mixed or recorded. Noise may come from a variety of sources besides the instrument, such as an air conditioner, fluorescent lights, or outside traffic.
One way to express quality of sound is by using the signal-to-noise ratio, or S/N. This ratio compares the amount of the desired signal with the amount of unwanted signal that accompanies it. A high-quality sound will have significantly more signal (desired sound) than noise (undesired sound).
Distortion, unlike noise, is caused by setting or recording levels too hot, pushing vacuum tubes, or by bad electronics. When needed, adding it can be an effective way to make a sound dirty, more aggressive, or in your face.
p.13
Headroom is the maximum amount a signal can be turned up or amplified without distortion. As an audio engineer you should be aware that audio devices have different amounts of headroom. Make sure you allow for plenty of headroom when setting audio signal levels. If you don’t, a loud spike of sound may ruin a take. Analog level settings can exceed zero, while digital cannot. Level settings will be discussed in Chapters 5 and 10.
ANALOG AND DIGITAL AUDIO
There are two ways to record and playback sound: analog and digital. Throughout most of the twenty-first century, analog reproduction and playback was the standard technology. Digital compact discs (CDs) were introduced to the public in 1982 and eventually replaced analog cassettes and vinyl. Although there has been a recent resurgence of vinyl and cassettes, digital audio is the norm.
What Is Analog?
Sound that is recorded and reproduced as voltage levels that continuously change over time is known as analog. Examples of analog are cassette tapes, vinyl records, or analog multi-track recorders. The up and down variations in air pressure levels that sound creates are represented in the varying grooves of a record or the arrangement of magnetic particles on a tape. Analog audio gear can be purchased in the form of FX processors, amplifiers, keyboards, tape machines, compressors, audio production consoles, and other electronic equipment.
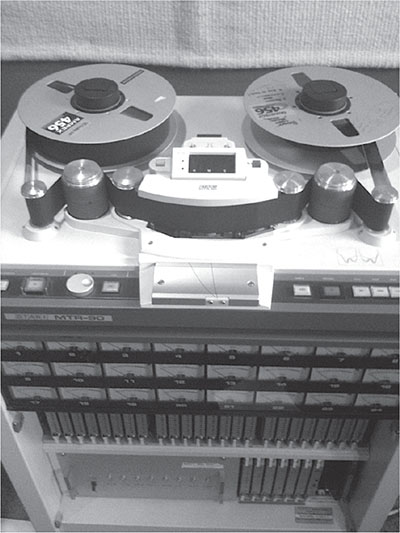
FIGURE 1.10
p.14
What Is Digital?
Digital’s main components are sample rate (related to frequency) and bit depth (related to amplitude). These two components determine the bandwidth and signal-to-noise ratio (S/N). Digital audio technology at its most basic level is a means of encoding data through the use of the binary number system. Digital audio translates the alphabet, base 10 numbers, and other types of information into 1s and 0s, on/off voltage.
Digital Audio Terms
The following terms should help you increase your understanding of digital audio basics:
The Nyquist Theorem: States that the signal’s sample rate must be at least two times greater than the highest desired frequency. For example, a sample rate of 44.1 kHz represents sound up to 22.05 kHz, and a sample rate of 48 kHz represents sound up to 24 kHz.
Sample or sampling rate: Factor in determining the frequency range (bandwidth) in digital audio. The sample rate determines how many samples of the audio signal are taken in a one-second period. A common sample rate of 44.1 kHz means that over forty-four thousand samples are taken per second. By cutting the sampling rate in half, we can determine the highest frequency that will be recorded and reproduced. For instance, a CD’s standard sample rate is 44.1 kHz, which represents up to 22.05 kHz. Other common audio sampling rates are 48kHz, 88.2kHz, 96kHz, and 192 kHz.
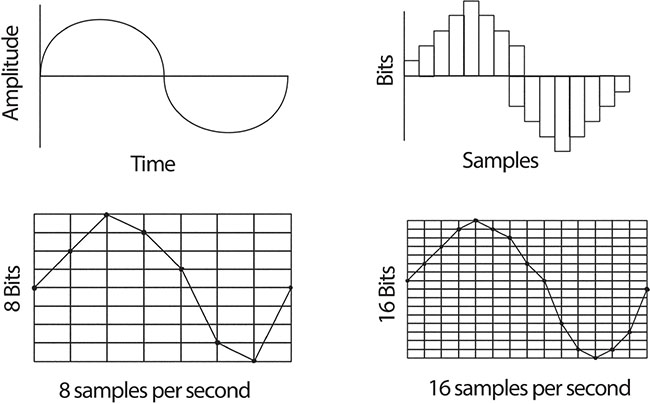
FIGURE 1.11
p.15
Quantization: Refers to the amplitude component of digital audio and determines how many steps or calculations are made. The more steps there are and the smaller the distance between each step, the smoother the representation: 8 bit = 256 steps, 16 bit = 65,536 steps, and 24 bit = 16,777,216 steps. Basically, the higher the bit resolution, the more the sound wave will appear as a sine wave.
Bit depth: Determines the dynamic range and the S/N. Common audio is 16, 24, or 32 bit. Higher bit depths increase the resolution of the audio. Think of bit depth as the knob on a pair of binoculars that allows you to sharpen the image. Higher bit depth, in this case, makes a digital sample of square steps appear smoother and much more like an analog sine wave. This represents the amplitude component of digital audio.
Bit rate: The rate at which digital audio is transmitted. It is expressed in bits per second, generally written as bps.
Normalize: A gain-related process in digital audio where the volume of the entire file is increased to a pre-determined standard. Unlike compression, normalizing a file does not change the dynamic relationship between the tracks. It keeps volume levels steady from song to song. This is useful to know if you are a DJ, creating mix tapes or trying to bring up low volumes in recordings.
Table 1.1 Digital audio comparisons according to bit depth, sample rate, bit rate, and file sizes

A standard audio CD is 16 bits with a 44.1 kHz sample rate. A blank 700 MB CD would hold about 80 minutes of stereo audio. As you can see from the chart, a 24-bit/96 kHz recording takes up at least three times the amount of storage space compared to a 16-bit/44.1 kHz recording.
Lossy vs. Lossless
Many beginner audio engineers are confused about whether or not they should make beats or use samples with lossy files (MP3s) rather than lossless files (WAVs) that are a higher-quality audio file format. A professional uses lossless files over lower-quality audio files – lossy files – almost every time.
p.16
The two main differences between lossy and lossless audio files are storage space and audio quality.
A lossy file is created for compressing sound, image, and video. MP3s, MP4s, and Ogg Vorbis are lossy formats used in audio. Lossy compression is a data encoding system that compresses data by throwing out information that is deemed “unnecessary” so as to decrease the file size. File compression is meant to be transparent; however, if a file such as an MP3 is compressed below a certain limit, the low quality of the audio may become noticeable. A high-quality MP3 bit rate would be 256–320 kbps and a low-quality MP3 would be in the 100 kbps range. One of the biggest arguments against using lossy files is that once you compress the file down, you are unable to recapture the original information that was discarded. The advantage of using a lossy over a lossless format is that a lossy format provides a much smaller audio file. Lossy files are helpful when sending a large number of audio files by e-mail, or uploading and streaming audio or video to the internet. Lossy files are not intended for storing final mixes or when high-quality audio files are needed.
A lossless file can also be compressed, though, unlike a lossy file, when it is re-constructed, the lossless file is completely restored. No information is deleted and it is considered a perfect copy of the original. As demonstrated in the chart seen earlier, lossless formats offer the highest quality audio but take up quite a bit more storage space. AIFF (.aiff), WAV (.wav), FLAC (free lossless audio codec), and ALAC (Apple lossless audio codec) files are examples of lossless formats. Lossless files are used in professional recording environments and when higher-quality audio is desired.
In short, think of quality (lossless) vs. quantity (lossy). Lossless formats are more suitable for audio enthusiasts and professionals specifically interested in maintaining the integrity of the sound quality. The average consumer listening to music or streaming a podcast on a cell phone or computer currently requires the convenience, streaming speed, and storage space provided by a lossy format.
In this chapter, we have learned about seven key sound wave characteristics. We recognized the importance of distinguishing a decibel from a hertz and a low-frequency sound from a high-frequency sound. We also identified the properties of both analog and digital audio and discovered that sound comes in many waveforms. Understanding these terms and concepts will help to create a solid foundation in audio engineering.
NOTE
1 “Rubens’ Tube—waves of fire.” The Naked Scientists, n.d. Retrieved from https://www.thenakedscientists.com/get-naked/experiments/rubens-tube-waves-fire (June 2017).