
Chapter 3. Beautiful Security Metrics
When you can measure what you are speaking about, and express it in numbers, you know something about it; but when you cannot measure it, when you cannot express it in numbers, your knowledge is a meager and unsatisfactory kind; it may be the beginning of knowledge, but you have scarcely, in your thoughts, advanced to the state of science.
The revolutionary idea that defines the boundary between modern times and the past is the mastery of risk; the notion that the future is more than a whim of the gods and that men and women are not passive before nature. Until human beings discovered a way across that boundary, the future was a mirror of the past or the murky domain of oracles and soothsayers who held a monopoly over knowledge of anticipated events.
The two quotes that start this chapter capture the essence of beauty in measurement and its primary deliverable: metrics. Lord Kelvin’s message is that there is no science without metrics. Peter Bernstein’s statement is about risk, which is conceptually related to security. Dr. Bernstein states that metrics free you from the morass of being a prisoner of the past or, even worse, dependent upon fortune tellers—certainly key objectives of science, in general.
For these reasons in themselves, metrics are beautiful—at a conceptual level. What about in practice? In particular, what about the application of metrics for protecting individual, corporate, national, and global interests, especially where those interests rely upon an Information Technology (IT) infrastructure? The purpose of this chapter is to explore the beauty of applied security metrics. I’ll start by using the medical field as an analogy. Then I’ll turn to the domain covered by this book, computer security, and discuss metrics through examples. To do so, I’ll dissect a small collection of highly visible and devastating security incidents. One is in the general area of defending against ATM fraud. Two additional contexts concern well-publicized incidents at two individual public companies: Barings Bank and TJX.
Security Metrics by Analogy: Health
Medical research has used metrics to advance both the science and practice of human health. Health, like security, is intangible. You can feel it but you can’t touch it. Health, like security, is all about achieving the absence of something—namely the absence of failures in mental or physical well-being for health care, and the absence of failures in confidentiality, integrity, or availability for security. Many security practitioners cite these characteristics—intangibility and “proving a negative”—as reasons why a quantitative, rigorous, analytic approach to IT security is hard or impossible. Medical research is a shining counterexample. Therefore, some observations about metrics as applied to the field of medicine will be useful as a lead-in to our discussion on security metrics by example.
Let’s begin by looking at the big questions—stated here as objectives for enlightenment that beautiful security metrics should deliver:
How secure am I?
Am I better off now than I was this time last year?
Am I spending the right amount of dollars, effort, or time?
How do I compare with my peers?
Could that happen to me?
The “that” in question 5 refers to any recent (usually negative) incident.
The first four questions were initially posed as a challenge for security metrics by Dr. Daniel E. Geer, Jr., a very prominent security “metrician”[9] whose doctorate is in epidemiology—a cornerstone of metrics used in public health care research. I added the fifth question.
Dr. Geer says that he first heard questions 1–4 from the CFO of a large, public financial services company. In describing the experience, he recounts that there was a fair amount of disdain when answers were not forthcoming—providing yet more evidence that security as a discipline needs metrics to get the respect it deserves.
Mapping the previous security questions to what you might ask your medical doctor requires almost no rewording. Moreover, like security, one’s health is a complex function of many factors: threats (such as germs and disease), vulnerabilities (such as genetic or environmental conditions), and the impact of their joint occurrence. Preventive health care, like IT security, aims to identify and implement measures that are designed to reduce the probability that a threat will be able to exploit one or more vulnerabilities. Medicine, like IT security operations, aims to identify treatments that reduce the impact when a threat manages to exploit a vulnerability.
Unreasonable Expectations
In both medicine and IT security, the previous questions are not answerable. In scientific terms, they are (charitably put) ill-formed. The first problem is definitions. What is the definition of being healthy or secure? Is a hangnail enough to render a person unhealthy? Or, analogously, is a single unpatched server enough to render a company’s IT infrastructure insecure?
The second problem is context. How did the hangnail get there and is it really a problem? Does the patient have a history or set of characteristics that suggests anything? Does he chew his fingernails? If the hangnail is on the hand of a concert pianist, the impact will be different from the impact of one afflicting a nonmusical office worker. Or, for a vulnerability in an IT asset, the criticality, use, and connectedness (or popularity) of the asset should be considered.
The third problem is uncertainty. A hangnail has some nonzero probability of leading to gangrene and loss of limb or death; or, analogously, a single vulnerability has a nonzero probability of leading to a breach and catastrophic loss or a damaged reputation. Most people know enough about hangnails and their associated risks to treat them appropriately. In contrast, many executives have no idea how to think rationally about vulnerabilities in IT assets. They look to their CISO and CIO who (they perceive) are letting them down.
Why is this? The answer lies in factors that are in part cultural and in part due to lack of scientific rigor. Medical research is currently better at overcoming both factors than is IT security research.
Data Transparency
Let’s first look at culture. The medical community has strong and institutionalized data-sharing mechanisms that are critical prerequisites for researchers to learn more and disseminate knowledge. Consider what happens when an emergent health threat is identified with suspected related deaths or illness. Investigators are summoned and inquiries are conducted by experts from organizations with a wide range of specialties: the attending physician, consulting specialists, nurses, orderlies, immunologists from the Centers for Disease Control and Prevention (CDC), the insurer, drug manufacturers, and the hospital. Their findings may well be examined by journalists and politicians. They will also be widely discussed by health care providers and incorporated into medical school courses and other practitioner education to spread awareness quickly and accurately.
In stark contrast, let’s look at the behavior of banks that operate 9ATM networks. In the late 1980s, New York banks discovered that printing the customer’s full account number on ATM tickets enabled attacks, leading to substantial loss of money for both customers and banks. A thief could stand in an ATM line and obtain a legitimate customer’s PIN by observing manual entry. The thief could then use both the PIN and account number (from discarded printed tickets) to steal money. For many years thereafter, non-New York banks continued to print account numbers on ATM tickets—many out of ignorance. As late as 1992, one bank in the UK was pilloried by the press for continuing this practice. While embarrassing, this publicity had the undeniable benefit that the bank immediately discontinued the outdated and insecure practice.
The value of data sharing is well understood by government and regulatory authorities. The Department of Homeland Security (DHS) has mandated Information Sharing and Analysis Centers targeted at industries such as Financial Services, Telecommunication, Power, and Manufacturing. Starting in early 2002 with California SB 1386 and spreading now to over 38 states, state laws require disclosure to a customer when personal data has been breached. This has resulted in a valuable online database called the Data Loss Database (DataLossDB), which security researchers are now beginning to mine for metrics about data loss size and occurrence by industry, type, and source. In particular, the trends regarding breach size and frequency, as well as insider versus externally perpetrated breaches, can now be characterized with metrics computed from accurate and (relatively) complete hard data.
Reasonable Metrics
Medicine’s reasonable approach to measuring health gives patients a reasonable guideline for assessing their own health while helping them set reasonable expectations. Although patients do ask, “How healthy am I?” they know that it is essentially an unanswerable question, and most medical practitioners give a somewhat circumspect response like, “Everything looks good today.” If pressed, the doctor may embellish this with “Your vital signs are normal. All your test results are normal. You are not overweight, but you should stop smoking”—or something similar. They give a summary that captures a list of unweighted positive and negative facts, all directly or indirectly derived from metrics. In some cases, they use medical terms such as cholesterol and osteopenia and are prepared to provide layman’s definitions, if requested.
The point is that doctors don’t attempt to give one a patient an all-encompassing score. Often, the list is organized into organ systems: cardiovascular, lungs, skin, nervous system, etc. Each of these systems has its associated specialists that the patient can be referred to for focused, in-depth testing and diagnosis.
And, equally importantly, patients find such answers acceptable. Unlike the CFO in Dr. Geer’s meeting, they don’t expect a quick, deterministic score.
Moreover, the field of medicine has also developed an impressive collection of metrics that security metricians can learn from.
First, medical research calls for collecting “patient history,” “vital signs,” and “basic biometrics” to frame a discussion about health. Patient history provides extensive general context that is typically represented as a collection of yes or no answers, like a survey: “Have you ever had measles?” or “Did your mother, father, sister, or brothers have high blood pressure?”
Medical vital signs for most people include temperature, blood pressure, pulse, and respiratory rate. Basic biometrics are height, weight, and pain. For newborns, a special set of vital signs called the Apgar score was designed. This metric was devised in 1952 by Virginia Apgar, a pediatric anesthesiologist, as a simple, somewhat repeatable method to quickly and accurately assess the health of a newborn child immediately after birth. A baby is evaluated at one minute and at five minutes after birth on five criteria: appearance, pulse, irritability reflex, activity, and respiration. The Apgar score is obtained by assigning a value of 0, 1, or 2 to each of the five criteria and computing the total. A perfect score is 10. Along with guidance about assigning values for each criterion, there is also guidance on how to interpret the final score. A score over 7 is viewed as normal. Scores below 3 are critically low.
Second, medical research endorses relative as opposed to absolute measurements. The “pain” biometric mentioned earlier is a great example. Interestingly, pain is measured on a scale of 0 to 5 or a scale of 0 to 10, where a 0 means no pain and a 5 or 10 means the most pain the patient has ever felt. It is considered good practice for the physician to allow the patient to pick which scale (0–5 or 0–10) to use. Equally important is that this metric is measured relative to the patient’s prior experience. There is no absolute scale. Since a given patient can’t have experienced the pain of others, this approach is the only sensible option.
Third, medical research embraces the concept of “good enough.” Positive vital signs and biometrics are probably neither necessary nor sufficient for someone to be healthy. A person can be sick with good scores or, conversely, be well with bad scores. But the latter situation is unusual and, in the spirit of “good enough,” measuring vital signs and biometrics is still viewed as a “best practice.” Moreover, through statistical analysis, medical research has produced levels of confidence that tell how likely it is that an exception will occur.
Finally, and probably most significantly, metrical researchers base their guidance on vast repositories of patient data, collected over decades. The values for medical vital signs have been empirically determined and validated by analyzing this data. This data is available because (1) patients readily agree to being measured and (2) patients agree to share those measurements. Analysis of freely shared patient data allows researchers to identify normal values with distributions that describe the likelihood that an individual will exhibit values different from the norm and how to interpret the differences. Also, they can determine values for different populations, such as newborns, children, teenagers, adults, and the elderly. Analysis can identify other influences on normal values, such as gender, nationality, race, recent activity or lifestyle, whether the person is overweight, and more. Note that individual patient data is never revealed to either the doctors or patients during consultations, just the derived metrics: namely averages, percentile ranges, highs, lows, and standard deviations.
Culturally, the security profession needs to change in ways that emulate the medical profession. Security must develop a system of vital signs and generally accepted metrics that it understands and are “good enough.” These metrics need not be deterministic nor absolute. They can be relative, perhaps even subjective at times. They can have a nonzero chance, but acceptably low and measurable, probability of being false negatives or false positives. IT security practitioners must embrace not only being regularly measured but also sharing data instead of perpetuating the cloak of secrecy that dominates their current behavior. If they don’t change, mandatory fiats, such as the California SB 1386 mandate, will force them to share.
With these changes, security researchers can apply rigorous science to back up their analysis. Only then can they free themselves from being viewed with a level of credibility normally ascribed to soothsayers and fortune tellers.
Security Metrics by Example
Metrics have clearly helped medical practitioners by providing both a framework for quantifying the health of an individual or population and a collection of guidelines to communicate that state to nonexperts. Can metrics do the same for the security of an enterprise? As mentioned earlier, voluntary data sharing in this field is rare, but sometimes, when the consequences are sufficiently dire, information cannot be suppressed and the results of the ensuing investigations become public. In this section, we analyze two situations where catastrophic security incidents occurred and discuss how an effective security metrics program might have alleviated or even eliminated suffering and loss.
Barings Bank: Insider Breach
Let us first look at a breach with the most dire of consequences: bankruptcy. The breach was actually a succession of breaches perpetrated by one individual, Nick Leeson, over a period of four years that resulted in the collapse of Barings Bank and its ultimate sale to the ING Group for one pound sterling in 1995.
The players
Barings Bank was Britain’s oldest merchant bank, founded in 1762. It had a long and distinguished history, helping to finance the Louisiana Purchase, the Napoleonic Wars, the Canadian Pacific Railway, and the Erie Canal. The British government used Barings to liquidate assets in the United States and elsewhere to finance the war effort during World War II. Princess Diana was the great-granddaughter of one of the Barings family. Barings was Queen Elizabeth’s personal bank.
Born in 1967 as a working class son of a plasterer, Nick Leeson’s life is a tale of rags to riches to rags, and possibly back to somewhat lesser riches. He failed his final math exam and left school with few qualifications. Despite this, he managed to land a job as a bank clerk, which led to a succession of additional jobs with other banks, ending up with Barings in the early 1990s. At Barings and earlier, Leeson worked in back-office operations, but shortly after joining Barings, he applied for and received a transfer to the Far East to help straighten out a back-office problem in Jakarta. His work there was visible and successful. In 1992, he was appointed to the position of general manager of Barings Securities (Singapore) Limited (BSS) with the authority to hire both traders and back-office staff to start up a futures trading operation on the SIMEX (today’s Singapore Exchange). Although it was not his job to trade but, rather, to manage, he quickly took the necessary exam, passed it, and began trading on SIMEX along with his team of traders. Consequently, at the time of the breaches, he held three roles: general manager, trader, and de facto head of back-office operations (due to his extensive past experience). Separation of duties is a fundamental tenet of any trading operation, yet it was absent at the BSS operating unit of Barings for four years, only to be discovered too late.
How it happened
Leeson and his team of traders had the authority to perform two types of trades: futures and option orders for external clients and for other Barings business units, and price arbitrage to leverage price differences between futures traded on SIMEX and Japan’s Osaka Securities Exchange (OSE).
Officially, Barings (and Leeson as its designated representative) adopted a trading strategy called a “short straddle.” This involves selling (going short) both a call option and a put option on some stock, interest rate, index, or other underlying instrument—in Leeson’s case, the Nikkei 255 index (among others). For this discussion let’s assume that some number of shares of a publicly traded stock is the underlying instrument.
If you are not familiar with options trading, a few definitions are in order. There are two basic types of options: puts and calls. Both puts and calls are contracts between two parties—a seller and a buyer.
Put options provide a right to sell. A buyer of a put has the option, at her sole discretion, to sell a certain number of shares of stock (N) for a strike price (S) at a time T in the future. The seller of a put option is making a commitment to buy a certain number of shares of stock (N) for a strike price (S) at a time (T) in the future. For one put option, the values of N, S, and T are the same for both the buyer and seller of the put option. The price of the option (Qput) is what the buyer pays to the seller for the contract (i.e., the option).
Calls are essentially a mirror of puts. Call options provide a right to buy. The buyer of a call has the option, at his sole discretion, to purchase a certain number of shares of stock for a strike price at a time in the future. The seller of a call option is making a commitment to sell a certain number of shares of stock for a strike price at a time in the future. As with put options, the parameters N, S, and T all apply and are the same for one contract between the buyer and seller of a call. The price of the option (Qcall) is what the buyer pays to the seller.
A short straddle is a trading strategy in which a trader—say, Nick Leeson—sells matching put and call options. Note that a long straddle is a strategy in which the trader buys matching put and call options. For both of these trading strategies, one can build a model that projects trading profits (Y) as a function of N, S, T, and the current stock price per share (X). Since Nick was authorized to follow a short straddle strategy, let’s look at short straddles in detail.
On day one, Nick sells two options: a put and a call for N shares, strike price S, and expiration date T. Nick receives:
| Q = Qcall + Qput |
from the buyers of his two options. So Nick is starting out with a profit equal to Q. As you will see from our analysis, this is the best Nick can do. At time day 1 plus T, when the two options expire, there are three possible cases:
- Case 1: X = S (the current stock price X is equal to the strike price S at time T)
If the current price and strike price are the same, then neither option will be exercised and Nick will not have to buy or sell any stock. He keeps his profit Q and enjoys the fleeting taste of victory.
- Case 2: S < X (the current stock price X is greater than the strike price S at time T)
In this case, the holder of the call option, who has a right to buy at S (a lower price), will do so. The holder of the put option, with the right to sell at S, will not exercise this option because she can sell at the higher current price. Thus, Nick has to purchase N shares at X and sell N shares at S, yielding an overall profit equal to:
Q – N * (X – S) This is OK as long as N * (X – S) is less than Q. It is easy to imagine a circumstance where this would not be the case. Large N or large (X – S) will put Nick in the hole.
- Case 3: X < S (the current stock price X is less than the strike price S at time T)
In this case, the holder of the put option, who has a right to sell at S (a higher price), will do so. The holder of the call option, with the right to buy at S, will not exercise this option, because he can buy at a lower current price. Thus, Nick has to purchase N shares at S and sell N shares at X, yielding an overall profit equal to:
Q – N * (S – X) This is OK as long as N * (S – X) is less than Q. It is easy to imagine a circumstance where this would not be the case. Large N or large (S – X) will put Nick in the hole.
We can compute the break-even value for the current stock price X at time T by solving the equations shown earlier with the profit set to zero:
| 0 = Q – N * (S – X) where S > X |
| 0 = Q – N * (X – S) where X > S |
This yields:
| X = S – Q/N for X < S |
| X = S + Q/N for X > S |
To summarize, the model for short straddles can be expressed as a graph as shown in Figure 3-1. This graph shows how profit on the y-axis varies in response to changes in the current stock price as reflected on the x-axis.

This is not a pretty picture at all. To be sure, it is a strategy that will yield (limited) profits in a nonvolatile market but potentially huge losses if the market becomes volatile. As Figure 3-1 shows, for large values of N or for large differences between X and S (high price volatility), the profits become increasingly negative.
Almost immediately after beginning to trade, Leeson began taking unauthorized and speculative positions in Nikkei 255 futures, Nikkei stock options, and Japanese Government Bonds. Using his influence over the back-office staff, he reported his profits from the authorized straddles in the proper accounts while hiding his unauthorized activities and losses in an old error account (Account #88888) that was an artifact of his previous back-office project in Jakarta. Table 3-1[10] shows some financial metrics that characterize the situation. All values are in millions of Great Britain Pounds (GBP).
Year | Reported | Actual | Cumulative |
End 1993 | +8.83 M | −21 M | −23 M |
End 1994 | +28.529 M | −185 M | −208 M |
End 1995 | +18.567 M | −619 M | −827 M |
Up until January of 1995, Leeson was primarily unskilled and unscrupulous. But on January 17, 1995, he became monumentally unlucky as well. A major earthquake in Kobe, Japan caused the Nikkei 225 average to plunge. Extreme volatility continued for over a month. Whereas a prudent trader would have taken his losses, Leeson did the opposite: he started an aggressive buying campaign of futures in the Nikkei 225 index, as shown in Figure 3-2.[11]
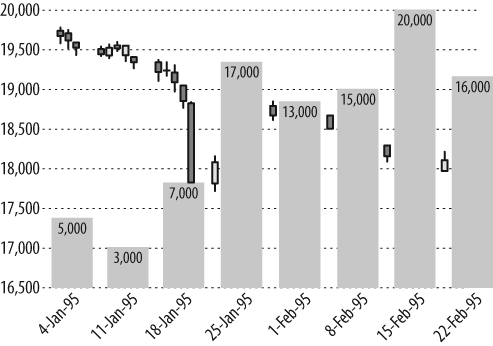
The x-axis reflects time, beginning just before the Kobe earthquake on January 17, 1995, and continuing until just before Barings went into receivership on February 27, 1995. The lefthand y-axis and the bars with whiskers show the Nikkei 225 high, low, and closing averages on the OSE. Before the earthquake, the Nikkei 225 index was trading at a price between 19,000 and 19,500. After the Kobe earthquake, that price plummeted and then wildly swung between as low as 17,400 and as high as 18,800. This translates to high differences between X and S in the short straddle model.
The gray bars in Figure 3-2 are plotted on a scale of Millions of U.S. Dollars ($M) that represent the long futures positions of Barings’ traded by Leeson. This scale ranges from a low of about $3B to a high of more than $20B, as opposed to the scale represented in the left y-axis that represents the Nikkei index, ranging from a low of 16,500 to 20,000. Numbers are provided for each bar to indicate the associated value in $M. So, the height of each bar reflects Leeson’s commitment to purchase Nikkei index shares at a future date for a specific price. Leeson’s maximum commitment during this period was $20 billion—more than 32 times Baring’s then-reported capital of approximately $615 million. This translates to high values for N in the short straddle model.
The end was swift, painful, and very public.
To be sure, the numbers and charts in this section reflect financial metrics, not security metrics. A key characteristic of beautiful security metrics is that they are linked somehow to financial metrics, or at least some meaningful measure of the performance of a business. What are some security metrics that might have provided the red flags needed to catch the problem before the situation became unsalvageable? We first analyze what when wrong and then look at a “what-if” scenario that assumes Barings had a metrics program.
What went wrong
In reviewing the context and sequence of events described, we can make the following observations:
Leeson did not have a clearly defined role with targeted system privileges. In fact, he simultaneously was wearing three hats: trader, back-office manager, and general manager.
Separation of duties between those who define, enforce, and follow policies was absent.
There was no formal process for reviewing Leeson’s access and entitlements for performing back-office and trading functions—specifically gaining access to IT applications.
No controls were in place to ensure that reviews were performed when Leeson’s responsibilities and functions changed.
An important role to which security metrics are well suited is monitoring and performance measurement for controls. In the Barings case, many critical controls were absent. In the next section, we leverage some inspiration from medical research to show how security metrics can be used for both detecting an absence of critical controls and monitoring ongoing effectiveness and efficiency.
Barings: “What if...”
As discussed earlier, medical research has defined a collection of facts that a physician can collect to evaluate a person that she is meeting for the first time and of whom she has no prior knowledge. The first step is to take a history—we have all done that many times. This history is a series of simple questions that provide an overview of patient status. Turning to companies in general and Barings in particular, what would be an appropriate analogy to taking a medical history? The answer is a “security history.” This is a series of high-level questions that provide a general characterization of the organization’s implementation of controls that protect the security of IT assets. Here are some sample questions:
Does the organization have formally documented information security policies and procedures?
Are employees required to follow these policies and procedures?
Does the organization have an identity and access management process that governs the management of user access and entitlements?
Is a separation of duties enforced between individuals that authorize access and those that enable such access to IT assets?
Is a formal review process conducted whenever an employee’s job or responsibilities change?
Is system and application activity instrumented via mechanisms such as logfiles?
Are activity logs regularly analyzed?
The number of questions in a security history may number in the hundreds. Unlike a patient history, it may take days or even weeks for an organization to complete it, but the principle is the same. It highlights the top-level issues and is intended to give the big picture as well as provide a road map for further investigation and ultimately the collection of more targeted metrics.
The IT security market, as of 2008, is starting to develop guidelines for security histories. Unlike the medical profession, where recommended medical history questions are available, there is little organization or structure in the IT security space. But this is changing. Some organizations are emerging to provide requirements:
The Payment Card Industry (PCI) has issued a set of requirements required from its members to trust that a company will appropriately protect customer credit card data.
The Santa Fe Group in partnership with BITS has created the Financial Institution Shared Assessments Program to boost the effectiveness and efficiency of assessing a company’s IT security posture.
Companies such as the Unified Compliance Framework are developing specifications that harmonize requirements as adumbrated by regulations, standards, best practices, and more.
These efforts have high potential for generating a level of consensus “security history” similar to that which the medical profession currently enjoys for medical history.
Barings’ answers to these sample (admittedly targeted) questions, had anyone asked, would have been telling. However, it is reasonable to conjecture that the Barings senior management in the U.K. did not realize how bad things were at BSS operations in the Far East. In fact, had they asked, it is certainly possible that Leeson would have lied in filling out his answers to a questionnaire. A subjective questionnaire that reflects what people say or think needs to be backed up with hard facts and data. Thus, like a medical history, this type of security history must be augmented with metrics. The history is merely a quick and somewhat subjective precursor that can point to areas where more in-depth investigation should begin.
Consider the following what-if scenario: What if a present-day Barings had decided to obtain a Shared Assessments security rating? Or what if a present-day Barings had undergone a mandatory PCI audit as required for maintaining a good-standing status with payment card companies such as Visa and American Express?
Right away, Barings’ lax controls for access to trading and back-office IT systems would likely have been determined. Auditors might have discovered a lack of centralized controls. They might have discovered that there were no regular reviews of employee entitlements—especially when employees changed jobs. In light of these findings, Barings would be faced with a low Shared Assessments rating, which in turn would impact their reputation, or they would potentially lose their ability to process payment card data, thereby losing significant revenue.
These last two business impacts would likely have gotten the attention of senior Barings management. Perhaps this would have prompted them to initiate a project to treat the problem. But how much should they commit to spend, and what should they adopt as realistic objectives or measures of success? It is easy to imagine them asking:
“How did our competitors do?”
“How sophisticated are their identity and access management controls?”
Unlike health care, the IT security profession has no help to offer here. Individuals whose medical data is used for research have similar risks that can materialize in several forms—higher insurance costs or no insurance coverage, difficulty finding employment, credit problems, and possibly litigation if they infect others. But individuals do, despite these risks, share their data. Why? One reason may be a general confidence that their data is appropriately anonymized prior to its release to researchers. Addressing this concern in relation to corporate security, the Center for Internet Security (CIS)[12] has announced a cross-enterprise benchmark metrics project. Associated with this project, my company PlexLogic is launching a service, called MetricsCenter, that can anonymously collect the data needed to compute the CIS benchmark metrics. The MetricsCenter technology leverages research in anonymization, much of which was motivated by the privacy requirements for medical research.[13]
Of course, like Barings in the early 1990s, many companies may not be collecting metrics, so there are none to report. This is like an individual choosing never to visit a physician: not prudent.
As a result, the Barings executives cannot use metrics (others or their own) to define the scale and scope of their “treatment.” Since they have no choice (they need and want a good security rating), Barings must launch an internal project to “treat” their “sick” identity and access management controls based upon intuition. Let’s assume that, this time, they decide to implement a metrics program along with the treatment program.
The good news is that Barings’ project can benefit greatly from metrics, and their implementation is entirely within the control of internal captive resources. In particular, there is no reliance upon others to collect and share data.
Barings: Some security metrics
So, in our what-if scenario, let’s assume that Barings is well along in their project to institute improved controls for identity and access management. Let’s further assume that they have embraced security metrics and are busy collecting, analyzing, and reporting results. Note that while the access management improvements are slowly advancing toward the BSS business unit in Singapore, it is certainly possible for Leeson to be blissfully trading away. But his days are numbered. Let’s take a look at some generic metrics that will have a high likelihood of exposing his transgressions:
- Coverage metrics
These characterize how far a solution has been implemented, as well as inconsistencies in deployment. Here are some examples, in the context of the Barings scenario:
Percentage of applications or basic services—such as email, websites, or shared storage—whose access is managed by an authoritative system. The closer this value is to 100%, the more complete control has been concentrated in one or a few well-managed places, thereby facilitating accountability. To calculate this metric, one would compare two lists: one from the authoritative systems and one compiled from configuration files and activity logs for the target application or service. The percentage of overlap of these two lists is what this metric measures. In Leeson’s case, the metric would expose the existence of secret accounts that the applications recognized for the purpose of granting access but were not officially managed by an authoritative system.
Percentage of login accounts that are explicitly linked to a valid employee or contractor. Any deviation of this metric from 100% should be examined carefully and ultimately justified. A large class of accounts that are not linkable to current employees or contractors would be terminated employees—some of whom may have less than positive attitudes toward their former employer and would almost certainly have “inside” information. Again, this metric is calculated by comparing two lists: the first from an authoritative access control system and the second from the corporation’s human resources or employee roster. The amount of overlap of these two lists is what this metric measures. It would expose that Leeson was using a former employee’s account or a bogus account to gain unauthorized access.
Percentage of accounts or of employees whose access and entitlements are formally reviewed at least once per year, reviewed once per quarter, or have never been reviewed. The percentage of accounts or employees never reviewed should be as close to zero as possible. This metric is often derived from service ticketing systems that keep records of reviews conducted. The result is calculated by dividing the number of conducted reviews by the total number of active accounts. Leeson and his accounts likely were never reviewed, with the worst possible consequences. Leeson was promoted after his first project in Singapore, but his access credentials were never reviewed. As with the other metrics, his existence as an unreviewed employee would prevent this metric from reaching its target.
Percentage of group overlap. In access control systems, it is common practice to define groups of accounts that share the same entitlements. For example, a group called Options Traders could be defined to possess all of the entitlements needed to grant access to a set of trading applications, or another group called Trade Administration could be defined to possess all of the entitlements needed to account for the exchange of money between buyers, sellers, exchanges, and other parties. The percentage of group overlap between the Options Traders and the Trade Administration group should ideally be zero. It may be less of a red flag if all of the accounts in that intersection have recently been reviewed (e.g., within one quarter). In Leeson’s case, his account would have been in that group intersection with no record of any review for over 12 quarters.
Like measuring temperature or pulse rate, none of these metrics are difficult to understand, and none require advanced mathematical computations. Also, they are probably not definitive. It is, after all, unrealistic for any company to achieve 100% perfection in these metrics, just as a person with less than perfect temperature or pulse rate may have a good reason for the deviation (e.g., they just ran up 10 flights of stairs). Also, these metrics are values derived at a single point in time, which gives only a snapshot of an organization’s status. When regularly and repeatedly computed, the time series of measurements can form a valuable data set that will support further, potentially more sophisticated analysis.
Time-series metrics are based on a set of values obtained at regular or irregular time intervals. Dynamic changes in a system over time, as reflected by a time series, show whether system state is improving or degrading—and how rapidly. As examples, consider what we would see if we collected all of the previously described metrics monthly or quarterly. Metrics derived from one business unit within a single organization such as Barings could potentially be used to forecast how rapidly other business units could reasonably be expected to roll out new controls. Perhaps we could even project how long it would take to discover and end Leeson’s unauthorized access to back-office functions.
- Investment metrics
Similarly, if one were tracking the costs associated with a program to improve access controls, one could derive a cost per unit of improvement for any or all of the previous metrics. If the rate of spending is constant and the rate with which a metric approaches its target (e.g., 100%) is slowing, the cost per unit of improvement is increasing. Using forecasting models, one can project how much it will cost to achieve alternate control targets (say, 95%, 96%, etc.). Of course, in Leeson’s case, it would be (with the advantage of hindsight) easy to justify any expenditure to get BSS’s identity and access management systems under control.
- Treatment effect metrics
To derive treatment effect metrics, run a time-series metric to compare performance before and after a “treatment” is applied. Using basic statistical analysis, one can test the null hypothesis, which in this case would say that any detected change is due merely to chance and that the “treatment” made no difference.
As an example, suppose that before initiating the access control project for a designated business unit, Barings decided to collect some metrics about access-related security incidents. Metrics such as the Mean Time Between Security Incidents (MTBSI) or Mean Time to Repair Security Incidents (MTTRSI) would characterize the frequency and impact of observed access security incidents. These baseline values (the “before” time series) could later be compared with the same measures taken after access control was deployed (the “after” time series). Was there improvement? Was it significant (not just by chance)? A statistically significant result would give you confidence that the improvement can be attributed to the deployment of access control.
With “before” and “after” time series data, Barings would have hard facts with which to assess the effectiveness of its treatment. Additionally, it would have hard data to present to auditors and thus either pass an initial audit or clear a negative finding. As more results are gathered in the fullness of time, the statistically derived levels of confidence and quantification of the treatment effects will improve. Finally (this can be only a conjecture in the absence of data), they might have been able to avoid the big access control incident that ended it all.
It is well and good to collect measurements, compute metrics, and analyze results, but these activities are of little value unless one also communicates the findings to the right audience at the right time for driving better decisions. For Barings, it is safe to say that senior executives would not be likely to read detailed reports about access control incidents or, for that matter, any of the detailed technical metrics that we just described. What they might look at is a dashboard with a list of general areas and associated color codes: say, red (bad), yellow (caution), or green (OK). The managers in charge of each area would assign the color codes based upon their interpretation of metrics such as those I just described.
The managers have a tightrope to walk when they are responsible for tracking and reporting security vulnerabilities. Reporting a problem simultaneously brings both the potential benefit of evoking the funding to resolve the problem and the reputational damage for allowing it to happen in the first place. This reputational downside is actually similar to some (but not all) health care situations. Metrics bypass the dilemma by forcing managers to share information with their bosses, who can then evaluate their performance in isolation or as compared with their peers. It’s ironic that these same bosses often refuse to share information outside of their department or outside of their company because they fear being evaluated against their peers as members of the same market ecosystem.
Certainly, Nick Leeson’s account and its contribution to metrics such as those described would have merited at least a yellow rating for access management controls in the BSS business unit or in the Far East location. The presence of a persistent yellow rating, with no improvement, would hopefully have precipitated an executive decision to commission some type of investigation, if for no other reason than to be able to annotate the yellow with statements that the accounts had been reviewed and no problems were discovered.
It is a safe bet that any sort of review would have curtailed or ended Leeson’s unauthorized activities. And, again, it is interesting to note that no understanding of complex derivatives, arbitrage, or higher mathematics would have been necessary.
TJX: Outsider Breach
The second example for security metrics in this chapter looks at the biggest case of payment card theft ever recorded (as of 2008). This is a very recent breach. In fact, events and information about it are still coming to light as this chapter is being written in October 2008. Because of the currency of this case, it is often difficult to assert what is proven and what is yet to be proven. Some of the following narrative is based upon unverified allegations from law enforcement and others close to the case. However, this does not diminish the value of the lessons I draw, because I am using the case to illustrate the value of security metrics.
The breach (or really, breaches) is believed to have started in July 2005 in a parking lot outside a Marshalls discount clothing store near St. Paul, Minnesota. Breaches continued for 18 months until December 2006, when TJX took action. TJX was actually not the first to detect the massive egress of credit card and other customer personal data from their network. Rather, it was credit card holders and issuers who began to see strange transactions on their credit card bills as early as November 2005. It wasn’t until December 2006 that TJX became suspicious enough to hire forensics experts and launch an investigation. Although TJX has survived the breach, it may cost the company as much as $1 billion over five years to cover all of their expenses, such as consultants, IT security upgrades, legal fees, and potential liability to payment card companies and banks. Costs to affected individuals and partners doing business with TJX will take a long time to determine.
The players
TJX Companies, Inc., with 2007 revenues of over $17 billion, is the largest off-price apparel and home fashions retail store chain. The company is parent to eight businesses, 2,500 stores, and 130,000 employees. TJX businesses in the U.S. currently consist of T.J. Maxx, Marshalls, HomeGoods, and A.J. Wright.
As of summer 2008, 11 men have been charged with not only the T.J. Maxx and Marshalls thefts, but also hitting an additional eight retailers in the U.S.: Office Max, Barnes & Noble, Sports Authority, Boston Market, DSW Shoe Warehouse, Dave & Buster’s, Forever 21, and B.J.’s Wholesale Club. Ten are in custody; one is at large. The accused ringleader is Albert Gonzalez, age 27, of Miami, Florida. The others come from Estonia, the Ukraine, China, and Belarus, as well as the U.S.
At the time of his arrest, Gonzalez had in his possession a Glock 27 firearm, a 2006 BMW, a condominium in Florida, and $1.65 million in cash. He had a high school education, was single, and lived with his parents. In 2003, Gonzalez was arrested on fraud charges in New Jersey and was subsequently recruited by the Secret Service to help an investigation into a major computer hacking operation. In 2004, he was credited with helping to take down a message-board operation that was used as a clearinghouse to buy and sell credit card numbers and other personal information. He was subsequently assigned to the TJX case. His assignment was to be an informant and pass information learned about the hackers to the Secret Service. However, the Secret Service now alleges that he was a double agent, passing information he learned from the Secret Service investigators to the hackers. Gonzalez’s Secret Service consulting position allegedly paid him $6,000 per month.
How it happened
Let us first look at how events unfolded from the public perspective. The following time line was published by the Boston Globe on October 25, 2007:[14]
2007 Jan. 17: TJX Cos. says it suffered an unauthorized intrusion into its computer systems, potentially compromising customer credit and debit card data as far back as 2003. The company said it knows of no misuse of data.
2007 Jan. 18: Credit card companies, banks, and customers begin to report fraudulent use of credit and debit card numbers that had been stored in the TJX system. Thousands of cards are canceled.
2007 Feb. 21: TJX reports that hackers may have gained access to its computers in 2005, a year earlier than it previously thought.
2007 March 28: TJX puts the number of credit and debit card numbers stolen by hackers at 45.7 million, but says about 75 percent of those were expired or had their data masked.
2007 July: Florida police obtain guilty pleas from several individuals in Florida for using credit card numbers taken from TJX to purchase $8 million in gift cards and electronics at Wal-Mart and Sam’s Club.
2007 Aug. 14: In a corporate filing, TJX puts the total cost of the data breach at $256 million.
2007 Sept. 21: TJX reaches a tentative settlement with customers affected by the breach, offering store vouchers to those affected and planning to hold a three-day “customer appreciation” sale. The settlement is later amended to offer affected customers the choice of vouchers or cash.
2007 Sept. 25: Canadian privacy officials fault TJX for failing to adopt adequate safeguards to protect customer information.
2007 Oct. 23: Court filings in a case brought by banks against TJX say the number of accounts affected by the thefts topped 94 million.
This time line shows the progression of escalating revelations regarding the impact of the breach, both in terms of numbers affected and ensuing litigation (all interesting metrics in their own right). As of October 2007, the criminals had not been caught, but there was an active investigation involving multiple law enforcement organizations in multiple states and countries. Almost a year later, in August 2008, arrests and indictments were announced.
Here is a time line based upon a technology perspective:
1999: Wireless LANs born: IEEE 802.11b completed and approved.
2001: Hack to crack WEP protection of wireless communication demonstrated.
2002 April: IEEE 802.1X ratified to address port-level security using Extensible Authentication Protocol (EAP), which works with RADIUS servers, already in wide commercial use. It was intended to standardize security for wired network ports, but was found to be applicable to wireless networking as well.
2002 July: Widespread publication of IEEE 802.11b security weaknesses with detailed recommendations to obtain enterprise-class strength.
2004 June: IEEE 802.11i ratified as an amendment to the wireless IEEE 802.11 standard to provide a standard specification for security mechanisms and to supersede the previous security specification.
2005 June: TJX use of WEP protection still prevalent at retail stores.
It is now alleged by law enforcement that Gonzalez and others practiced a popular and low-budget technique called wardriving to uncover open wireless networks. Wardriving involves cruising public areas (in this case, the parking lots of malls and retail stores) in cars equipped with PCs and a good antenna. The antenna discovers wireless networks. The PC runs wireless client software that attempts a connection if the network has open access, or records transmitted packet streams if the network has implemented some form of access security. If the access security is weak, the packet streams can be analyzed using readily available software to extract all the information needed to break in. Once in, the hackers can access network-connected customer databases and begin collecting credit card numbers and other personal information.
To understand how this works in a bit more detail, let us look at a few key facts about wireless networks. We will also provide Consensus Good Practices, recommendations that have been developed by various industry groups and standards organizations:
The IEEE 802.11b standard specifies a Service Set Identifier (SSID) that differentiates wireless access points (independent networks). As an example, a hotel called the Good Night’s Rest might name its WAP GoodNR for convenience. WAPs operating in default mode broadcast the SSID every few seconds in what are known as “Beacon Frames.” While this makes it easy for authorized users to discover and connect to a network, it also makes the same thing easy for unauthorized users.
consensus good practice: A company should set the value of all SSIDs to something obscure. A setting such as “TJX-Miami” is not a good choice. Additionally, it is best to turn off SSID broadcasts.
To authenticate a user who wishes to connect to a network, IEEE 802b specifies a protocol called Wireless Equivalent Privacy (WEP). Most WAPs ship with a default setting for open authentication, which means that WEP is disabled and there is no authentication for clients who wish to connect.
consensus good practice: A company should change the default setting for authentication to disallow open access for all clients.
When WEP is enabled, each individual client is configured with a secret key that is shared with its associated WAP. A prospective network client begins by sending an association request to the WAP, whereupon the WAP replies by sending a string of challenge text to the client. The client then applies an algorithm called RC4 to encrypt the challenge text and then sends it back to the WAP. The WAP authenticates that the client of the challenge text was encrypted correctly.
consensus good practice: Key management for WEP is a nightmare. To change the shared key, the configurations for each and every WAP and client must be updated.
The WEP protocol allows an unauthorized listener to capture two of the three variables in the authentication equation: the challenge text and the RC4-encrypted response. With enough sample pairs, a hacker can discover the shared key using well-known mathematics embodied in freely downloadable software.
consensus good practice: WEP is not adequate protection for a wireless network. Good practices for achieving strong wireless security include the following:
Turn off WEP
Select obscure SSIDs
Isolate wireless subnets with routers and firewalls
Use 802.1X for key management
Apparently TJX, as well as other breached retailers, did not follow guidelines issued as early as July 2002. The hackers leveraged this fact to gain access to the company network. As a result, they could acquire customer information in transit within a store’s network, as well as wirelessly transmitted employee credentials. Using the employee credentials, the hackers gained access to both in-store servers and servers at TJX headquarters in Massachusetts, which stored repositories of customer data.
What went wrong
Unlike the Barings Bank failure, which was an internal breach attributable to an egregious lapse in access management processes, the TJX failure was a breach perpetrated by outside attackers that succeeded due to lapses in network and system management processes. People close to the ongoing investigation allege that the outside attackers found WAPs with default configurations, WAPs with self-evident SSIDs and open access, and WAPs configured to use WEP. These WAPs were the low-hanging fruit that let the hackers gather enormous quantities of valuable data with an incredibly small investment.
So, given our perfect 20/20 hindsight, what did TJX do wrong? The technical lapses are easy to list:
Inadequate network configuration control
Inadequate network usage surveillance
Inadequate server configuration and usage monitoring
Inadequate data protection, particularly data egress
At a deeper level, of course, the technical failures were symptoms of mismanagement:
Ignorance of or indifference to basic security practices, such as password protection
Ignorance about wireless network operation, compounded by failure to follow industry alerts and news about common vulnerabilities
Lack of unified policies and lack of communication with remote sites about recommended policies
Refusal to pursue evidence of trouble when reported
Lack of concern in general for security at all times: during installation, during staff training, and during ongoing use when monitoring should have been taking place
The wireless standards committees and manufacturers also have to shoulder some of the blame for the problem, but that is a wider discussion that I can’t attempt in this article.
Note
It’s not just TJX that is guilty. Nine other retail companies were hit by the same thieves using the same hacking techniques and exploiting the same holes in their IT systems’ security.
TJX: “What if...”
What if TJX had sophisticated sensors that could continually monitor the millions of transactions and the (likely) terabytes of data both stored and in transit within their IT infrastructure? What if they could regularly summarize the telemetry (no human can read it all) and embody it in a collection of metrics, covering a spectrum of aggregation criteria, for regular review? Medical research has produced sophisticated sensors that yield vast quantities of data that can be made available to both researchers and practitioners. It is certainly possible.
The key to successfully creating “smart sensors” in medicine (along with data sharing) is that medical practitioners who deal directly with patients work closely with researchers who, in turn, work closely with vendors that manufacture sensors. As a result, when a medical diagnostic tool is released, it not only can sense data but can also summarize it and provide very specific guidance as to how to interpret results.
As an example, consider equipment that performs bone density or DEXA scans for osteopenia. First, the manufacturer provides information about what the equipment does, how to operate it, when it should be used, and how to interpret results. In addition, medical researchers provide information about risk factors for osteopenia, various treatments (e.g., diet, medication), current research (including medical trials), support groups, references, and additional products. DEXA scan results are often presented as a color-coded picture of a patient’s skeleton, where color represents bone density. It is a complete package.
With the current state of security products, one gets software and a set of manuals that are all about the technology and how to operate it. Papers covering recommended usage and the significance of events, which would be the main vehicle for delivering a diagnosis and interpretation, are, for many security vendors (and their investors), the least interesting part of the product. Indeed, system administrators in the field also have a poor record of reading and understanding such documents. The patented gizmo that lies deep within a sensor or software platform, and which end users will never understand, seems to be what is valued most highly—especially in startups, where a lot of the innovation resides. Security vendors, in general, lack the domain expertise to deliver a complete solution, thereby leaving a gap between what their products deliver and what end users can effectively use.
Security metrics have the potential to bridge some of this gap. By providing definitions that specify both sources of raw (sensor) data as well as how to interpret results, metrics can significantly add to the value of the existing wealth of security management products. The Security Metrics Catalog project, jointly sponsored by SecurityMetrics.org and MetricsCenter.org, is designed to provide a centralized, searchable repository of metrics definitions.[15]
Let’s look at a few security metrics that TJX would have found useful.
TJX: Some security metrics
The problem of data breaches, unlike other computer security issues, gives us the unique opportunity to look at some public metrics, on both global and local levels. Global metrics capture industry-wide experience, whereas local metrics capture the experience of a single enterprise.
Global metrics
Global metrics need global data to drive them. California’s SB 1386 mandate and similar legislation require the reporting, starting in July 2003, of public breaches that affect individual personally identifiable information. The Open Software Foundation, a group of volunteers, tracks publicly reported security incidents, using press accounts as their primary source of information. Their results are posted at the Attrition website[16] in the form of the Data Loss Data Base (DataLossDB) repository, which physically is a comma-delimited file that is easily ingested by most statistics software. As of July 15, 2008, the Open Security Foundation has assumed hosting responsibilities from Attrition.org for the DataLossDB. Maintenance of the DataLossDB will be a community-driven project at a new location, http://datalossdb.org.
Using the DataLossDB as a source, one can derive a simple metric, “Number of Events per Quarter,” and generate the time-series plot shown in Figure 3-3.
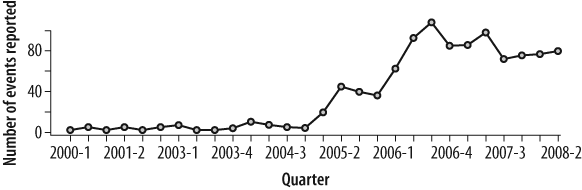
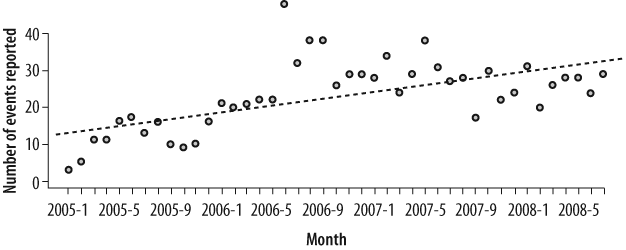
The scope and scale of the mandate to report breaches has grown from just California in mid-2003 to an increasing number of states over the past five years. Clearly, the trend in the number of breaches reported is up, but it does seem to be flattening out. No doubt some of the early growth during 2005 can be attributed to new mandates in more jurisdictions. People who otherwise might not have disclosed an event are now required to do so by law. In Figure 3-4 we’ll “zoom in” to view monthly data, starting in 2005.
The monthly data shows a fair amount of volatility. If we fit a line (using a least-squares model) to the observations, we can see that the trend is increasing slightly. One can use such a line to make projections into the future, but precision is not the goal. The metrics diagrammed (namely the slope and intercept of the dotted line) paint a clear picture that incidents are increasing in frequency and therefore it is fair to say that the situation is getting worse, not better.
The TJX breach was perpetrated by outsiders. It is widely believed that insider breaches are increasing faster than outsider breaches. The DataLossDB data allows us to investigate this question with hard facts and data. Since DataLossDB tags each breach with an “insider” or “outsider” label, we can create a new plot, similar to the previous one but breaking event frequency down into these two subsets. This calculation produces the graph in Figure 3-5, again starting in 2005.
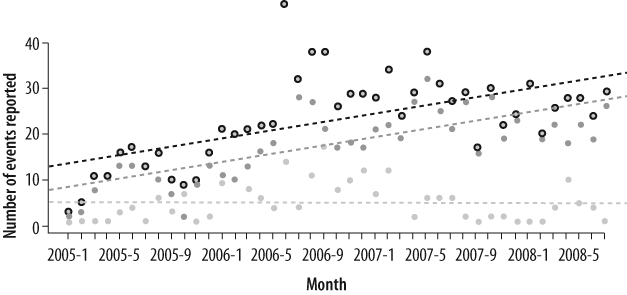
The solid dark gray dots represent the number of insider breaches, and the solid light gray dots represent the number of outsider breaches. The black donuts just replicate the total of the two, as plotted in the earlier trend graph. The dark gray, light gray, and black dotted lines are least-squares fits for the outside, inside, and total frequencies, respectively. It is easy to see that outside breaches are increasing, whereas the incidence of inside breaches are essentially flat, so the increase in total breach frequency is due entirely to the increase in outside breach frequency—at least according to the data in the DataLossDB.
Another aspect of a breach is impact. How far-reaching is the amount of data compromised by each incident? It turns out that the Attrition volunteers record data about each breach that provides a good measure of impact: the total number of individuals affected by the breach. The name for this value is TotalAffected. Of course, for most events this is just the best estimate that the breached company can provide, but it is much better than nothing. Again, we are not necessarily pursuing precision here. So Figure 3-6 shows a box plot that reflects the several “distribution” metrics for TotalAffected on the log10 y-axis, scaled across all breaches for each year starting in 2005 and going through August 11, 2008. In truth, since 2008 is not complete at the time of this writing, one could debate whether we should include 2008 in the graph. Our rationale is that the current year is always of great interest. But it is important to note that the data shown reflects only 7.5 months.
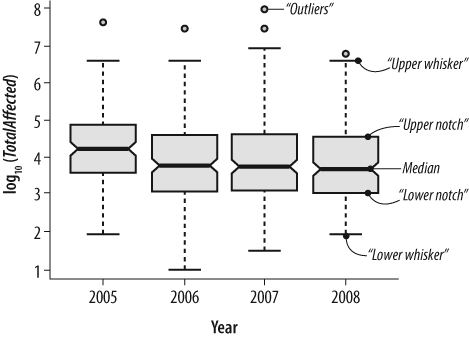
The median is the value of log10(TotalAffected) for which half of the years’ observations are either higher (or lower). The upper and lower notches approximate the third and first quadrant observations, respectively. The upper and lower whiskers reflect values that encompass a 95% confidence interval around the medians of two distributions. In this case, a distribution covers one year of reported breaches, so Figure 3-6 characterizes four distributions, one each for 2005, 2006, 2007, and 2008 (only 7.5 months). The high degree of overlap in all the distributions indicates that the number of individuals affected per breach varies by two orders of magnitude (two notches on the log10 vertical axis), from about 5,000 on the low end to 100,000 on the high end.
It would be interesting to determine the sensitivity of the TotalAffected value to the length of time it takes for a breach to be discovered. In the TJX case, that length of time was approximately 18 months. According to the DataLossDB, the TotalAffected value for the TJX breach is 94 million. Note that the callout labeled “Outlier” points to the bubble that represents TJX’s breach.[17] Unfortunately, the DataLossDB does not track a value for breach time to discover.
Local metrics
Before leaving the topic of TJX, let us very briefly identify local metrics worth tracking, with a focus on internal operations. Perhaps a regular review of these metrics would have inspired TJX IT security operations first to detect and then to protect some of the holes that enabled the breach we have discussed.
Within the TJX IT infrastructure, vulnerability, patch management, and configuration management systems are examples of proactive security systems whose objective is to ensure that certain classes of weaknesses are discovered and repaired before hackers have a chance to exploit them. In performing their work, these systems create vast quantities of data that can be used to derive metrics that characterize how well they are meeting objectives. Two sample classes of metrics include:
- Scan coverage
How much of the corporate network is actually being reviewed? Typically, this metric is expressed as a percentage, and is often broken down by location, owning business unit, type of device, type of vulnerability, or severity. Clearly, the goal is to achieve measurements as close as possible to 100%—i.e., total coverage.
It appears that coverage metrics for TJX WAPs were almost or totally lacking. TJX neglected to review the configuration of any of their wireless access points.
Available tools also complicate monitoring. Often, due to specialization, security management products cover only one type of target, such as routers, WAPs, servers, or even servers running a specific operating system. As is often the case, in 2002, wireless access points were delivered to market well in advance of the enterprise-class scanners capable of discovering vulnerabilities in their configuration. It is certainly possible that TJX was a victim of that gap. This is not to say that they shouldn’t have known better.
- Mean Time to Repair (MTTR)
How long (on average) does it take to remove a flaw that has been discovered (broadly defined) in the IT infrastructure? This metric is expressed in some unit of time: hours, days, weeks, etc. In general, the lower the value of this metric, the less time hackers will have to exploit vulnerabilities.
Although this metric is clearly valuable as a leading indicator of risk, it requires several prerequisites.
First, sensors need to be installed to detect faults such as vulnerabilities, bad configurations, unpatched software, etc. Second, when a vulnerability is found, records must be kept that track the time it was discovered and the time it was validated as fixed. It is not clear that TJX had any mechanism in place to detect deployed wireless access points, much less poorly configured ones. So they were never fixed. MTTR equaled infinity.
If one can’t prevent a breach, the next best strategy is to detect it quickly. It took TJX 18 months and hundreds of thousands of credit card numbers to become suspicious. What are some detection metrics that could have helped?
The thieves who stole the credit card numbers left numerous artifacts of their work:
- Sensitive data (e.g., credit card numbers or SSNs) in outbound network traffic
This is easily detected and can be blocked within minutes by existing commercially available tools generically called data usage monitors.
- Unexplained account activity
Having intercepted account credentials from authorized users, the hackers logged into accounts, searched databases, extracted data, created files, and performed file transfers to move their ill-gotten gains off to servers that they controlled. All of this activity is detectable via database management tools and, often, application logs.
Metrics that aggregate quantities based upon the data collected by data usage monitors, database management systems, and application logs would reflect the magnitude of activity that was required for the hackers to marshal and export their stolen materials. These numbers would stand out in any time series.
More Public Data Sources
Finally, it is worth noting that there are an increasing number of additional public sources for global threat information. This is progress that should not go unacknowledged:
- Symantec DeepSight Threat Management Service[18]
Provides views of the global security threat landscape by capturing and processing security log data from routers, firewalls, IDSs, and other devices. Limited metrics are available, aggregated by dimensions such as location, severity, and type. A sample report for July 2008 is available at http://eval.symantec.com/mktginfo/enterprise/white_papers/b-whitepaper_internet_security_threat_report_xiii_04-2008.en-us.pdf.
- iDefense Labs
A subsidiary of VeriSign, iDefense Labs monitors threat as well as hacker activity and reports the results of its analyses to subscribers and the public.
- SANS Internet Storm Center
This is a free and open service that uses a platform called DShield to allow users of firewalls to share intrusion information. The Internet Storm website extracts simple metrics and publishes reports that identify top ports attacked, top sources of attacks, country reports, and others.
Additional sources of interest are:[19]
http://www.gocsi.com for industry survey results
http://antiphishing.org for phishing, malware, and data-theft data and statistics
http://nvd.nist.gov for vulnerability data and statistics
http://www.commtouch.com/Site/ResearchLab/statistics.asp for spam data and statistics
http://www.postini.com/stats for spam data and statistics
Symantec Internet Security Threat Reports (ISTR), issued annually
http://www.webroot.com for spyware data and statistics
http://www.counterpane.com for polity violations (e.g., IDS, IPS, etc.)
http://www.qualys.com/research/rnd/vulnlaws for interesting analysis on vulnerability prevalence, persistence, and “half-life”
Summary
Security metrics are a critical prerequisite for turning IT security into a science instead of an art. The major ideas I have discussed in this chapter can be summarized as follows:
- Metrics can make a difference
Metrics can and do facilitate better awareness and better decision-making. They force a structure around the analysis of complex situations and shine a light on broken processes or anomalous activity. Once executives and managers know about something, they are usually capable of identifying a solution and monitoring its effects when enacted. In the cases of Barings and TJX, major failures might have been averted or significantly mitigated if only a metrics program were in place to provide critical transparency.
- One size does not fit all
Metrics that matter must address situations of critical interest as well as reflect a high degree of domain knowledge about the situations that they measure. In the discussion in Security Metrics by Example, we spent as much time discussing the business context as we did the metrics that might have demonstrated their beauty by helping to avert disaster.
- You get what you give
If companies do not begin sharing more data about their security successes and failures, IT security management will be doomed to a morass of soothsaying, oracles, and lack of credibility. In the discussion in Security Metrics by Example, there was little data available for us to actually compute and present internal metrics. The DataLossDB data is far better than nothing, but, as a project staffed by volunteers, one can’t expect it to expand its scope and scale without a corresponding increase in investment.
If, on the other hand, a security data-sharing culture takes hold, the IT security management discipline can grow up, become a science, and deliver quantitative metrics to help decision-makers invest in the infrastructure that is the foundation of our increasingly digital world.
- Security metrics is an interdisciplinary pursuit
There is much to be learned from other disciplines, such as medical research. Security metricians must also be knowledgeable in IT security, in mathematics and statistics, in the visualization of quantitative information, in scalable software implementation, and in the business that the metrics will serve.
Security metrics is in its infancy and, in my opinion, has been stuck there for too many years. This chapter is about what I believe is required to give it a kick start. Toward that end, we first looked to the relative success of a more mature discipline with a lot of similarities, and then we applied what we learned to some noteworthy IT security failures.
[9] The term metrician is not a real word. I, and others, have coined it to refer to someone who performs quantitative analysis to identify requirements, models, and visualizations associated with metrics.
[10] Source: Report of the Board of Banking Supervision Inquiry into the Circumstances of the Collapse of Barings, Ordered by the House of Commons, Her Majesty’s Stationery Office, 1995.
[11] See http://www.asiafunclub.com/japan/finance/stock_market/nikkei_1995.shtml and Zang, Peter G., “Barings bankruptcy and financial derivatives,” 1995, World Scientific, p. 137.
[12] See http://www.cisecurity.org for more information.
[13] See http://www.plexlogic.com and http://www.metricscenter.org for more information.
[15] See http://www.securitymetrics.org and http://www.metricscenter.org for more information.
[16] See http://datalossdb.com and the DataLossDB database.
[17] log10(94,000,000) is approximately 7.97.
[18] http://www.symantec.com/business/services/overview.jsp?pcid=hosted_services&pvid=deepsight_early_warning_services
[19] Many thanks to Dr. D. E. Geer, Jr. for providing pointers to these sources.